

Abstract
Hedgehog (Hh) signaling pathway plays a pivotal role in embryonic development. Hh binding to Patched1 (PTCH1) derepresses Smoothened (SMO), thereby activating the downstream signal transduction. Covalent SMO modification by cholesterol in its cysteine‐rich domain (CRD) is essential for SMO function. SMO cholesterylation is a calcium‐accelerated autoprocessing reaction, and STIM1‐ORAI1‐mediated store‐operated calcium entry promotes cholesterylation and activation of endosome‐localized SMO. However, it is unknown whether the Hh‐PTCH1 interplay regulates the activity of the endoplasmic reticulum (ER)‐localized SMO. Here, we found that PTCH1 inhibited the COPII‐dependent export of SMO from the ER, whereas Hh promoted this process. The RRxWxR amino acid motif in the cytosolic tail of SMO was essential for COPII recognition, ciliary localization, and signal transduction activity. Hh and PTCH1 regulated cholesterol modification of the ER‐localized SMO, and SMO cholesterylation accelerated its exit from ER. The GRAMD1/ASTER sterol transport proteins facilitated cholesterol transfer to ER from PM, resulting in increased SMO cholesterylation and enhanced Hh signaling. Collectively, we reveal a regulatory role of GRAMD‐mediated cholesterol transport in ER‐resident SMO maturation and Hh signaling.
Keywords: cholesterylation, COPII, glycosylation, GRAMD1s, SMO
Subject Categories: Membranes & Trafficking, Post-translational Modifications & Proteolysis, Signal Transduction
Cholesterol modification promotes the activity of Hedgehog signaling component Smoothened by accelerating its COPII‐dependent ER exit.

Introduction
The Hedgehog (Hh) signaling pathway plays a key role in regulating embryonic development and postnatal renewal of damaged tissues and organs (Mann & Beachy, 2004; Petrova & Joyner, 2014). Dysregulated Hh signaling leads to developmental defects and even embryonic death. In adulthood, aberrantly activated Hh signaling is closely related to the initiation and progression of a variety of cancers (Beachy et al, 2004; Rubin & de Sauvage, 2006; Briscoe & Therond, 2013). The core components of the Hh signaling pathway include the ligand Hh, the receptor Patched1 (PTCH1), and the G protein‐coupled receptor (GPCR)‐like protein Smoothened (SMO; Hu & Song, 2019). Hh binds to PTCH1 and releases its suppression on SMO. Then, SMO relocates to the primary cilium and activates glioma‐associated oncogene homolog (GLI) transcription factors, which induce the expression of many downstream target genes (Rohatgi et al, 2007; Varjosalo & Taipale, 2007; Ryan & Chiang, 2012; Briscoe & Therond, 2013).
Cholesterol is an essential small signaling molecule in the Hh pathway. Besides modifying Hh at the C terminus (Porter et al, 1996), cholesterol can be covalently linked to the aspartate 95 residue (D95, equivalent to D99 in mouse ortholog) of human SMO (Xiao et al, 2017; Hu et al, 2022). The cholesterylation of SMO is increased by Hh and inhibited by PTCH1, correlating with Hh signaling activation (Xiao et al, 2017). We have generated D99N knock‐in mutation mice and found that the homozygous Smo D99N/D99N mice are embryonic lethal with heart developmental defects (Xiao et al, 2017), phenocopying the Smo‐deficient mice (Zhang et al, 2001). The D95 residue localizes in the bottom of a cholesterol‐binding groove in the N‐terminal cysteine‐rich domain (CRD) of SMO (Byrne et al, 2016; Huang et al, 2016). The D‐to‐N substitution abolishes cholesterol binding and cholesterol conjugation to CRD (Xiao et al, 2017). But it is unclear whether cholesterylation at the CRD is required for the activation of the full‐length SMO protein. We recently found that, although the SMO(D95E) mutant could be bound by cholesterol, it failed to be cholesterylated and translocated to the primary cilium. The Smo D99E/D99E knock‐in mice are embryonic lethal, demonstrating cholesterol conjugation to CRD is required for SMO function (Hu et al, 2022). Using cultured cells, cholesterol modification of SMO is shown to be a Ca2+‐accelerated autoreaction involving an intramolecular ester linkage between D95 and Y130 residues (Hu et al, 2022). Hh stimulation increases Ca2+ concentration in the SMO‐residing endosomes through store‐operated calcium entry (SOCE) mediated by STIM1‐ORAI1 (Hu et al, 2022). The seven transmembrane helixes of SMO form a hydrophobic tunnel to accommodate multiple cholesterol or oxysterol molecules (Huang et al, 2018; Deshpande et al, 2019; Qi et al, 2019, 2020). However, it is unclear how the transmembrane and CRD domains coordinate to regulate SMO activation in response to Hh stimulation.
PTCH1 is a 12‐pass transmembrane protein sharing homology with the bacteria resistance‐nodulation‐division transporter family (Taipale et al, 2002). The cryo‐electron microscopic analysis of PTCH1 protein reveals a hydrophobic conduit that contains multiple cholesterol‐like molecules, suggesting PTCH1 might be able to transport cholesterol through this intramolecular tunnel (Zhang et al, 2018). Functional studies show that PTCH1 regulates cholesterol distribution in the plasma membrane (PM; Zhang et al, 2018; Kinnebrew et al, 2021), thereby controlling cholesterol accessibility to SMO and governing SMO activation on the PM. Regarding the SMO protein pool in endosomes that are also enriched in cholesterol (Luo et al, 2019), we have demonstrated that Ca2+ is the rate‐limiting factor of SMO cholesterylation and activation (Hu et al, 2022). Since the endoplasmic reticulum (ER) is an organelle with low cholesterol but high concentration of luminal Ca2+, it is unknown whether and how the ER‐localized SMO is subjected to Hh and PTCH1 regulation.
Cellular cholesterol is heterogeneously distributed among intracellular membrane organelles. Representing up to 50% of total lipids in the PM, cholesterol only accounts for less than 7% of lipids on a molar basis in the ER (Litvinov et al, 2018). Cholesterol is transported to the ER via multiple pathways, including membrane contacts formed between lysosomes, peroxisome, and the ER (Chu et al, 2015; Xiao et al, 2019), between lysosomes and the ER (Zhao & Ridgway, 2017; Höglinger et al, 2019), and between the PM and the ER (Das et al, 2014; Infante & Radhakrishnan, 2017; Trinh et al, 2022). The GRAMD family proteins, which include GRAMD1A, 1B, 1C, 2, and 3, promote PM‐ER membrane contact formation in response to increasing concentrations of cholesterol in the PM. GRAMDs are ER‐anchored single transmembrane proteins possessing a GRAM domain that can bind to cholesterol and anionic lipids within the PM. GRAMD1s (also named as ASTERs) also possess a StART‐like domain (Besprozvannaya et al, 2018; Sandhu et al, 2018), and exist as homo‐ and heteromeric complexes. The StART‐like domain of GRAMD1s can bind to and transport cholesterol from the PM to the ER (Naito et al, 2019; Ercan et al, 2021).
In this study, we find that PTCH1 inhibits but Hh promotes the ER exit of SMO. The C‐terminal RRxWxR motif of SMO is required for COPII recruitment, ER budding, and subsequent translocation to the primary cilium. Hh and PTCH1 regulate cholesterylation of SMO by controlling the GRAMD1s‐mediated cholesterol transport to the ER from the PM. The cholesterylation of CRD accelerates the ER budding of SMO.
Results
Regulation of Endo H‐resistant glycosylation of SMO by Hh signaling
We used glycosidase treatment to analyze different glycosylated forms of SMO (Marada et al, 2015). Endoglycosidase H (Endo H) and peptide: N‐glycosidase F (PNGase F) were used to distinguish glycosylation that occurs in the ER from that in the Golgi apparatus and beyond. Three forms of endogenous SMO with different electrophoretic mobilities were detected: the fully glycosylated, mature form (higher than 100 kDa) that is only sensitive to PNGase F digestion, the core‐glycosylated one (between 100 and 75 kDa) that is sensitive to Endo H digestion, and the unglycosylated one (approximately 75 kDa). The ER‐resident form accounts for about 78% of the total SMO protein (Fig 1A and B). When SMO was co‐expressed with PTCH1, we observed a substantial decrease in the higher‐molecular‐weight bands of SMO (Fig 1C, compare lanes 4–6 to 1–3). Glycosidase treatment demonstrated that PTCH1 abolished the Endo H‐resistant form of SMO (Fig 1C and D). As controls, the loss‐of‐function mutant PTCH1 variants only slightly decreased the mature form of SMO (Fig EV1A; Gong et al, 2018; Zhang et al, 2018). PTCH1 did not change the glycosylation pattern of Asialoglycoprotein receptor 1 (ASGR1), an irrelevant transmembrane protein (Fig EV1B; Wang et al, 2022). These results suggest that PTCH1 specifically decreases the mature glycosylation form of SMO. On the contrary, the N‐terminal domain of Sonic Hh (ShhN) significantly increased the Endo H‐resistant form of SMO (Figs 1E, compare lanes 4–6 to 1–3 and 10–12 to 7–9, and F). In mouse embryonic fibroblast (MEF) cells, which is a Hh‐responsive cell line (Ocbina & Anderson, 2008), ShhN increased the Endo H‐resistant glycosylation of endogenous SMO in a dose‐dependent manner (Fig 1G and H). In addition, we generated a Ptch1‐knockout (KO) cell line in NIH3T3 cell line by CRISPR‐Cas9 system. This knockout cell showed an increase in mature SMO and high Gli1 expression compared with wild‐type (WT) cells (Fig EV1C–F). Together, these results suggest that PTCH1 inhibits the ER exit of SMO whereas ShhN promotes the process.
Figure 1. The Endo H‐resistant glycosylated form of SMO is decreased by PTCH1 but increased by Hh.

- Three glycosylated forms of endogenous SMO protein are shown. NIH3T3 cells were harvested and treated with indicated glycosidases. Black bracket indicates mature glycosylated form, and gray bracket indicates core‐glycosylated form. The representative results of three independent experiments are shown.
- Densitometric analysis of three glycosylated forms of SMO shown in (A) using Image J. Data are expressed as a percentage of the total SMO protein.
- PTCH1 inhibited the Endo H‐resistant glycosylation of SMO. HEK293T cells were co‐transfected with the SMO and PTCH1 expression plasmids. After 48 h, the cells were harvested, lysed, and treated with indicated glycosidases. Results shown are representative of three independent experiments.
- Quantification of Endo H‐resistant form of SMO shown in (C). Three independent experiments were quantified by Image J and expressed as a percentage of the total SMO protein. Data are expressed as mean ± SEM (***P < 0.001, Student's t‐test).
- Shh increased the Endo H‐resistant form of SMO. Cells were transfected as indicated for 24 h, and incubated with ShhN‐conditioned medium for an additional 24 h. Cells were harvested and analyzed as in (C). Results shown are representative of three independent experiments.
- Quantification of Endo H‐resistant form of SMO shown in (E). Three independent experiments were quantified by Image J and expressed as a percentage of the total SMO protein. Data are expressed as mean ± SEM (***P < 0.001; **P < 0.01, two‐way ANOVA with Sidak's multiple comparison test).
- Shh increased the Endo H‐resistant form of endogenous SMO in MEF cells. Results shown are representative of three independent experiments.
- Densitometric analysis of Endo H‐resistant form of SMO shown in (G). Three independent experiments were quantified by Image J and expressed as a percentage of the total SMO protein. Data are expressed as mean ± SEM (*P < 0.05, one‐way ANOVA with Dunnett's multiple comparison test).
Source data are available online for this figure.
Figure EV1. PTCH1 inhibits SMO glycosylation specifically.

- The PTCH1 loss‐of‐function mutants PTCH1(IVL), PTCH1(NNQ), and PTCH1(3M) failed to inhibit SMO glycosylation in HEK293T cells. The experiments were done similarly in Fig 1C.
- PTCH1 inhibited glycosylation of SMO but not ASGR1 in HEK293T cells. The experiments were done similarly in Fig 1C.
- The Endo H‐resistant form of endogenous SMO was increased in Ptch1‐KO NIH3T3 cells. Results shown are representative of three independent experiments.
- Densitometric analysis of the Endo H‐resistant form of SMO shown in (C) using Image J. Data are expressed as a percentage of the total SMO. Data are expressed as mean ± SEM from three independent experiments (*P < 0.05, unpaired two‐tailed Student's t‐test).
- Sequencing results of Ptch1 gene in WT and Ptch1‐KO cells. Two additional nucleotides (highlighted in red) were inserted, which resulted in the premature termination of translation.
- The mRNA levels of Gli1 were measured in WT and Ptch1‐KO NIH3T3 cells by qRT–PCR. Data are expressed as mean ± SEM from three technical replicates (****P < 0.0001, unpaired two‐tailed Student's t‐test).
Data information: Black bracket indicates mature glycosylated form.
Source data are available online for this figure.
Hh and PTCH1 regulate the association between SMO and SAR1B
To explore the regulatory mechanism of SMO transport, we examined the association between SMO and SAR1B, a small GTPase priming the initial step of COPII vesicle formation. A promiscuous biotin ligase BirA* was utilized to mark cargo recognition by COPII complex as previously established (Roux et al, 2012; Nie et al, 2018). Indeed, SMO could be dose‐dependently biotinylated by BirA* fused to SAR1B (Fig 2A), indicating SMO is a potential cargo protein for COPII. We also generated HEK293T cells stably expressing SAR1B‐BirA*‐FLAG and observed similar SMO biotinylation (Fig 2B). Similar to other small G proteins, the activity of SAR1B is controlled by the bound nucleotide (Pucadyil & Schmid, 2009). Thus, we examined the effect of two SAR1B mutations on the biotinylation of SMO: the GDP‐locked, inactive G37A mutant and the GTP‐locked, constitutively active H79G mutant. The SAR1B(G37A)‐BirA* failed to biotinylate SMO because SAR1B(G37A)‐BirA* was unable to interact with ER membrane, which was a prerequisite for the biotinylation for cargo proteins (Fig 2C). On the contrary, SAR1B(H79G)‐BirA* could efficiently biotinylate SMO. Interestingly, the Endo H‐resistant glycosylation of SMO was inhibited by SAR1B(H79G)‐BirA*, because SAR1B(H79G) could not hydrolyze GTP to GDP, thereby preventing the vesicle from fusing with the Golgi (Bielli et al, 2005).
Figure 2. Recognition of SMO by SAR1B is regulated by Hh and PTCH1.

- Biotinylation of SMO by SAR1B‐BirA* (asterisk denotes the R118G mutation in BirA) in a proximity‐dependent biotinylation assay. The cells were transfected with plasmids encoding SMO and SAR1B‐BirA*‐FLAG. After 48 h, cells were treated with different doses of biotin for 4 h. Cells were harvested and lysates were dialyzed to remove free biotin. Biotinylated proteins were pulled down by streptavidin beads and subjected to immunoblotting analysis.
- The cells were treated with different doses of biotin for 24 h. Cells were harvested, lysed, and subjected to procedure as shown in Fig 2A.
- The GDP‐locked SAR1B(G37A)‐BirA* failed to label SMO, while the GTP‐locked SAR1B(H79G)‐BirA* could efficiently biotinylate SMO. The cells were transfected with plasmids expressing SMO and indicated SAR1B‐BirA*. After 48 h, cells were treated with 15 μM biotin for 4 h. Then, experiments were carried out as described in Fig 2A.
- PTCH1 decreased SAR1B‐BirA*‐mediated biotinylation of SMO but not LMAN1. The experiments were done similarly in Fig 2A.
- The Shh increased the binding of SAR1B to SMO. After transfection for 24 h, cells were incubated with the ShhN‐conditioned medium for an additional 24 h. Then, 15 μM biotin was added into the culture medium for 4 h. The cells were harvested and analyzed as described in Fig 2A.
Data information: All of the experiments were done in the SMO‐KO HEK293T cells, except B, in which the HEK293T cells stably expressing SAR1B‐BirA* were used.
Source data are available online for this figure.
Next, we analyzed whether the SMO‐SAR1B association was regulated by Hh signaling. PTCH1 dose‐dependently reduced the amount of biotin‐labeled SMO by SAR1B‐BirA* (Fig 2D), whereas ShhN increased SMO biotinylation (Fig 2E). As a control, the biotinylation of LMAN1 (Nie et al, 2018), an irrelevant transmembrane cargo protein, was not affected by PTCH1 (Fig 2D).
The RRxWxR on SMO cytosolic tail is the recognition motif of COPII required for maximal Hh signaling
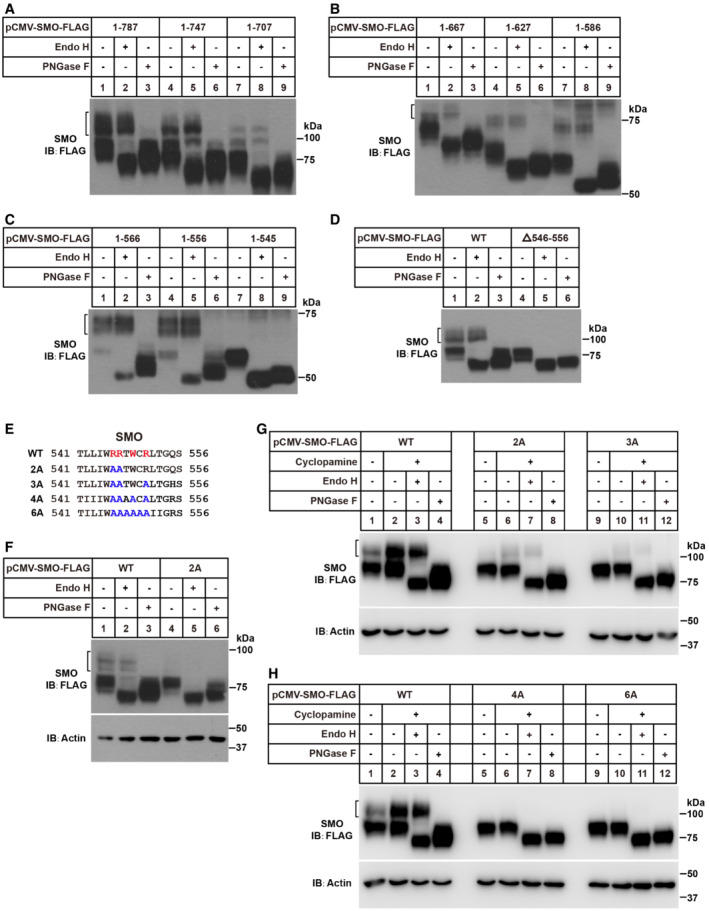
SMO is a GPCR‐like protein with an N‐terminal CRD, seven transmembrane helices, and a carboxyl tail protruding into the cytosol (Fig 3A). To search for the amino acids essential for recognition by COPII subunits, we constructed a series of C‐terminally truncated SMO and analyzed their glycosylation as the readout of ER exit. The SMO(1–787), SMO(1–747), SMO(1–707), SMO(1–667), SMO(1–627), SMO(1–586) and SMO(1–556) all exhibited Endo H‐resistant glycosylation (Fig EV2A–C). But the glycosylation of SMO(1–545) was completely removed by Endo H (Fig EV2C). Consistently, deletion of the 11 amino acids (546–556 a.a.) of SMO prevented the appearance of Endo H‐resistant form (Fig EV2D). The dibasic motif was critical for cargo‐SAR1 recognition in other proteins to exit ER (Giraudo & Maccioni, 2003). Mutation of R546 and R547 residues to alanine greatly reduced post‐ER glycosylation of SMO (Fig EV2E and F), suggesting both residues were required for the Endo H‐resistant glycosylation of SMO. However, when cyclopamine—an SMO antagonist, which enhances the maturation of SMO (Fig EV2G; Rohatgi et al, 2009)—was applied, a small amount of SMO protein could still be exported from ER, as evidenced by the residual Endo H‐resistant glycosylation (Fig EV2G, lane 7, upper band). Further mutation of two nearby amino acids (W549 and R551) to alanine (R546A/R547A/W549A/R551A mutations, designated as 4A) completely inhibited Endo H‐resistant glycosylation, indicating this RRxWxR (x stands for any amino acid) motif is required for the recognition by COPII subunits (Figs 3B and EV2H). The cycloheximide‐chase assay revealed the half‐lives of SMO(WT) and SMO(4A) were comparable (Fig EV3A and B), suggesting that SMO(4A) might not be misfolded.
Figure 3. The RRxWxR motif in the cytoplasmic tail is required for ER exit and SMO activity.
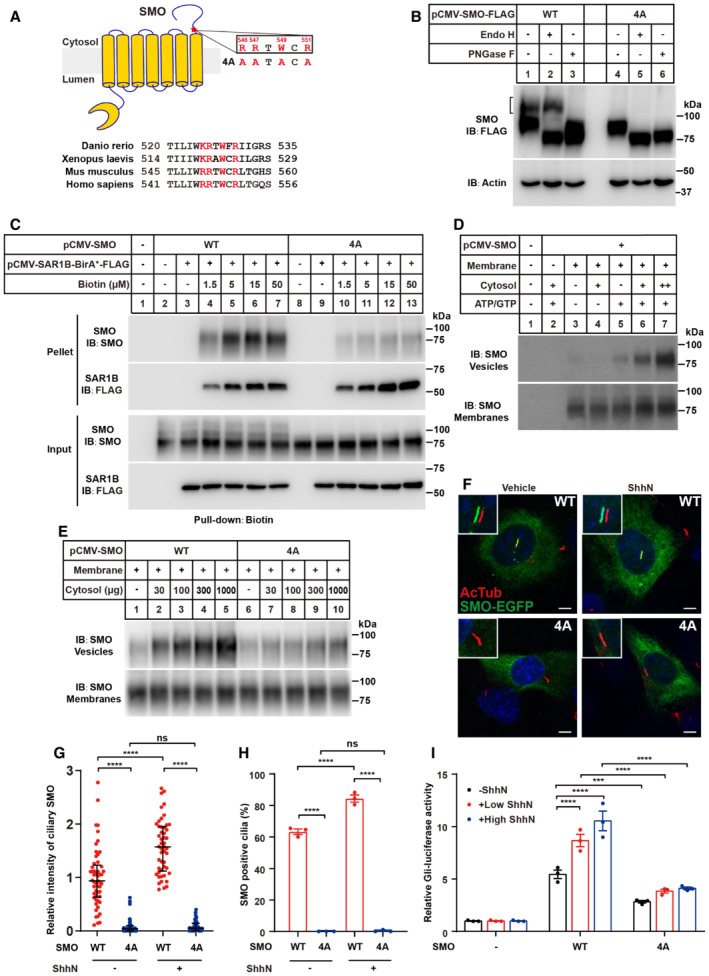
- Topology of human SMO and the alignment of SMO partial sequences of different species are shown. The RRxWxR (x stands for any amino acid) motif is highlighted in red.
- Treatment with glycosidase demonstrated that SMO (4A, in which RRTWCR was mutated to AATACA) was sensitive to Endo H. The experiments were done similarly in Fig 2A. Black bracket indicates mature glycosylated form.
- SAR1B‐BirA*‐mediated biotinylation of the SMO variants. The experiments were done similarly in Fig 2A.
- In vitro budding of SMO. Membranes were prepared and incubated in vitro in the presence of cytosol, ATP, GTP, and an ATP‐regenerating system as described in experimental procedures. Then, vesicle and membrane fractions were separated by centrifugation and subjected to immunoblotting analysis.
- In vitro budding of the SMO variants. The experiments were done as same as in (D).
- The ciliary localization of SMO variants. Smo‐KO NIH3T3 cells were transfected with the EGFP fused SMO variants, incubated with serum starvation medium for 24 h to fully induce cilia formation, and treated with or without ShhN‐conditioned medium for 4 h. Cells were immunostained with the acetylated tubulin (red). Results shown are representative of three independent experiments. Scale bars: 5 μm.
- Quantitative assessment of the intensity of ciliary SMO in (F) by Image J. More than 45 cells were randomly selected and counted for each group. Data are presented as median with interquartile. (****P < 0.0001; ns, not significant, two‐way ANOVA with Sidak's multiple comparison test).
- Quantification of the percentage of cells with ciliary SMO. Data are presented as mean ± SEM from three biological replicates (****P < 0.0001; ns, not significant, two‐way ANOVA with Tukey's multiple comparison test). Eighty to 90 cilia were analyzed in each group in each experiment.
- Gli‐luciferase reporter assay in Smo‐KO NIH3T3 cells. The cells were transfected with plasmids encoding SMO or SMO variants, GLI‐promoted firefly luciferase and renilla luciferase. After 24 h, cells were incubated with a medium containing different amounts of ShhN for another 24 h. Data are presented as mean ± SEM from three technical replicates (****P < 0.0001; ***P < 0.001, two‐way ANOVA with Dunnett's multiple comparison test).
Data information: In (B–E) the SMO‐KO HEK293T cells were used.
Source data are available online for this figure.
Figure EV2. Glycosylation analysis of SMO variants.
-
A–DGlycosidase treatment of full‐length and truncated SMO. After transfection for 48 h, the cells were harvested and treated with glycosidases as described in Fig 1A.
-
EThe schematic diagram of SMO(WT) and mutants. Residues required for ER exit of SMO are highlighted in red.
-
FSMO(WT) and SMO(2A) were tested for Endo H and PNGase F sensitivity.
-
G, HGlycosidase treatment of the SMO variants. After transfection for 24 h, the cells were treated with 5 μM cyclopamine for 24 h.
Data information: All of these experiments were done in HEK293T cells. Black bracket indicates mature glycosylated form.
Source data are available online for this figure.
Figure EV3. Characterization of SMO(WT) and SMO(4A), and the effect of VirA on SMO.

- The protein stability of SMO(WT) and SMO(4A) was analyzed by cycloheximide (CHX) chase experiments. Cells stably expressing SMO(WT) or SMO(4A) were treated with 100 μM CHX for different time durations before harvesting. The samples were lysed and subjected to immunoblotting analysis.
- The SMO protein levels at different time points were quantified by Image J. Densitometry at t = 0 was defined as 100%. AU, arbitrary unit.
- Co‐transfection of plasmids encoding SMO and VirA blocks the transport of SMO from ER to Golgi. After transfection for 48 h, the cells were lysed by RIPA buffer and subjected to immunoblotting analysis.
- The cholesterol probe (CP)‐modified SMO was Endo H‐sensitive.
- PTCH1 and ShhN regulated cholesterylation of SMO in the presence or absence of VirA.
Data information: All of these experiments were done in HEK293T cells. Black bracket indicates mature glycosylated form.
Source data are available online for this figure.
We next analyzed the SMO‐SAR1B association using the proximity‐dependent biotinylation assay. The biotinylation of SMO(4A) was greatly reduced compared with SMO(WT), suggesting the interaction of SAR1B‐BirA* with the mutated SMO was impaired (Fig 3C). We then analyzed the budding event of SMO from the isolated membrane in the in vitro budding assay (Espenshade et al, 2002). To synchronize the SMO protein at the ER, we co‐expressed SMO with VirA, a cytosolic GTPase‐activating protein isolated from the bacterium Shigella flexneri and used to block the ER‐to‐Golgi transport (Dobbs et al, 2015). As expected, VirA entrapped the SMO at the ER and prevented mature glycosylation (Fig EV3C). The in vitro budding of SMO, like other canonical COPII cargoes (Nie et al, 2018), required cytosolic factors and ATP/GTP (Fig 3D). The amount of vesicular budding of the SMO(4A) was much less than that of SMO(WT) (Fig 3E). Thus, we concluded the RRxWxR motif was essential for efficient COPII‐dependent ER exit of SMO.
SMO must translocate to the primary cilium to transduce the signal across the PM following Hh stimulation. However, the 4A mutation largely abolished the ciliary localization of SMO (Fig 3F–H). As a downstream event of Hh pathway activation, the transcription factor GLI proteins initiate the expression of target genes. Thus, we used a well‐established GLI‐responsive luciferase reporter system to evaluate the signaling capacity of SMO variants. The activity of SMO(4A) was significantly diminished either at the basal level or upon ShhN treatment (Fig 3I). Collectively, the RRxWxR motif is required for the ciliary translocation and proper function of SMO.
SMO cholesterylation facilitates its ER exit
Our previous study has shown that human SMO is covalently modified by cholesterol on the D95 residue for relaying Hh signaling (Xiao et al, 2017; Qiu et al, 2021; Hu et al, 2022). We utilized a bioorthogonal cholesterol derivative probe (CP) that could substitute cholesterol to support cell growth to analyze protein cholesterylation (Fig EV4D; Xiao et al, 2017). Cholesterol modification of SMO was inhibited by PTCH1 and enhanced by ShhN (Fig 4A). Conversely, the cholesterylation of endogenous SMO was increased in Ptch1‐KO NIH3T3 cells (Fig 4B). These data validated our previous results showing that the cholesterylation of endogenous SMO was increased by knocking down Ptch1 or ShhN treatment (Xiao et al, 2017). Notably, most of the CP‐linked SMO was resistant to Endo H digestion (Fig 4C), suggesting that (i) SMO is mainly cholesterylated in post‐ER compartments, or/and (ii) SMO can be cholesterylated in the ER but rapidly exit ER. The mechanism and regulation of the cholesterylation of the endosomal SMO have been reported (Hu et al, 2022). We then investigated the regulation of the ER‐resident SMO.
Figure EV4. Analysis of SMO(1–259) and SMO(D95E).

- Topology of human SMO(1–259).
- Confocal images showing SMO(1–259)‐FLAG was colocalized with GFP‐Sec61β (an ER marker) in NIH3T3 cells. The cells were incubated with or without ShhN‐conditioned medium for 4 h before fixation with 4% paraformaldehyde (PFA). Scale bars: 2.5 μm.
- Treatment with glycosidase demonstrated that SMO(1–259) was sensitive to Endo H.
- Schematic diagram showing the procedure for detecting CP‐modified protein. After transfection for 24 h, 2 μg/ml of cholesterol probe (CP) and the ShhN‐conditioned medium were applied for an additional 16 h. The cell lysates were subjected to copper‐catalyzed azide‐alkyne cycloaddition (CuAAC) to biotin alkyne, then CP‐modified proteins were pulled down by streptavidin beads.
- Cholesterylation of SMO(1–259) was inhibited by PTCH1 and increased by ShhN.
- The CP‐modified SMO(1–259) was Endo H‐sensitive.
- The Endo H‐resistant form of SMO(D95E) was less than SMO. Black bracket indicates mature glycosylated form.
Data information: The experiments were done in HEK293T cells in (C, E–G).
Source data are available online for this figure.
Figure 4. Cholesterylation of SMO accelerates its ER exit.

-
AShh increased cholesterylation of SMO. HEK293T cells were transfected, harvested, and analyzed as depicted in Fig EV4D.
-
BThe SMO cholesterylation of Ptch1‐KO NIH3T3 cells was increased compared with WT cells.
-
CThe CP‐modified SMO was mainly resistant to Endo H. The CP‐modified SMO proteins were pulled down by streptavidin beads and digested with Endo H or PNGase F at 37°C. Then, proteins were eluted with SDS–PAGE sample buffer and subjected to immunoblotting analysis. Results shown are representative of two independent experiments.
-
DCholesterylation of SMO(4A) was inhibited by PTCH1 and increased by ShhN.
-
EThe CP‐modified SMO(4A) was sensitive to Endo H treatment.
-
FThe levels of CP‐modified WT SMO and SMO(4A) were compared. 1.39% of SMO(WT) pellet samples and 11.1% of SMO(4A) pellet samples were loaded. Results shown are representative of three independent experiments.
-
GQuantification of CP‐modified SMO is shown in (F). Three independent experiments were quantified by Image J and expressed as a percentage of the total SMO. Data are expressed as mean ± SEM (****P < 0.0001, unpaired two‐tailed Student's t‐test).
-
H, IThe stimulative/inhibitory effect of Shh/PTCH1 on SMO and SAR1B interaction was compromised by D95E mutation. The experiments were done the same as in Fig 2E.
Data information: In (C–F) HEK293T cells were used.
Source data are available online for this figure.
To analyze whether SMO can be modified by cholesterol in the ER, we measured the cholesterylation of SMO(4A), an ER‐trapped SMO mutant. Surprisingly, the 4A mutant was covalently conjugated to CP. The cholesterylation of SMO(4A) was inhibited by PTCH1 and enhanced by ShhN (Fig 4D). The CP‐linked SMO(4A) was completely sensitive to Endo H (Fig 4E), confirming that the cholesterylation of SMO(4A) occurred in the ER. We also quantified the ratio of modification of WT and 4A forms of SMO. About 9% of SMO(WT) can be modified by CP. But only 2% of SMO(4A) was conjugated to CP, much less than the SMO(WT) protein (Fig 4F and G).
Consistently, although VirA blocks SMO budding, the SMO(WT) could be still modified by CP and was subjected to PTCH1 inhibition and ShhN elevation (Fig EV3C–E). The Hh and PTCH1 regulation was also recapitulated in the ER membrane anchored, N‐terminal fragment (1–259 a.a.) of SMO (Fig EV4A and E). The ER localization of this truncated protein was confirmed by glycosidase digestion and immunofluorescence assays (Fig EV4C and B). The CP‐linked SMO(1–259) was fully sensitive to Endo H digestion (Fig EV4F). Meanwhile, the Endo H‐resistant form of SMO(D95E), a mutant that could not be modified by cholesterol, was less than WT SMO (Fig EV4G). The interaction between SMO(D95E) and SAR1B was weaker than SMO(WT)‐SAR1B. Also the regulatory effects of ShhN and PTCH1 on SMO(D95E) were compromised compared with SMO(WT) (Fig 4H and I). Together, these results demonstrate that SMO cholesterylation can occur in ER and promote ER exit of SMO.
Accessibility of PM cholesterol controls SMO cholesterylation and Hh pathway activity
We have demonstrated that the cholesterylation of endosome‐localized SMO is an autoprocessing process accelerated by Ca2+. Hh stimulation increases local Ca2+ concentration in the SMO‐localized endosomes through SOCE (Hu et al, 2022). Unlike endosomes, the ER lumen contains high concentrations (0.1–1 mM) of free Ca2+ whereas the ER membrane has very low level (less than 7% of total ER lipids) of cholesterol. Hence, the regulatory mechanism of cholesterylation of endosomal SMO may not apply to the ER‐localized SMO. It is known that a fraction of PM cholesterol is continuously transported to the ER (Infante & Radhakrishnan, 2017). We then asked whether the PM‐ER cholesterol transport contributed to SMO cholesterylation.
Anthrolysin‐O domain‐4 (ALOD4) is a bacteria‐derived cholesterol‐binding peptide and has been used to sequestrate cholesterol on the outer leaflet of the PM by inhibiting its flip‐flop, thus lowering the cholesterol content on the inner leaflet of the PM (Infante & Radhakrishnan, 2017; Fig 5A). ALOD4 dose‐dependently decreased SMO(WT) and SMO(4A) cholesterylation (Fig 5B and C). Accordingly, entrapment of cholesterol by ALOD4 counteracted ShhN‐induced ciliary translocation of SMO and the Gli1 expression (Fig 5D–G).
Figure 5. Restraint of cholesterol transport from the PM to the ER blocks the Hh signaling.

-
AALOD4 decreases ER cholesterol levels by binding and trapping cholesterol in the outer leaflet of plasma membranes.
-
B, CALOD4 inhibited the cholesterol modification of SMO and SMO(4A). Cells were treated with ALOD4 for 1 h and then incubated with a medium containing ShhN and CP for 2 and 3 h. In C, ShhN and CP were added for 2 h. Cells were harvested and analyzed as depicted in Fig EV4D.
-
DCiliary localization of endogenous SMO treated with or without ALOD4. Cells were treated with ALOD4 for 1 h, and then incubated with ShhN‐conditioned medium for 2 h. Results shown are representative of three independent experiments. Scale bars: 5 μm.
-
EQuantitative assessment of the intensity of ciliary SMO in (D). More than 80 cells were randomly selected and counted for each group. Data are presented as median with interquartile. (****P < 0.0001, one‐way ANOVA with Dunnett's multiple comparison test).
-
FQuantification of the percentage of cells with ciliary SMO in (D). Data are presented as mean ± SEM from three biological replicates (****P < 0.0001, one‐way ANOVA with Dunnett's multiple comparison test). Ninety to 100 cilia were analyzed in each group in each experiment.
-
GEffect of ALOD4 on the expression of Gli1 was measured by qRT–PCR. The cells were treated with ALOD4 for 1 h, and then incubated with ShhN‐conditioned medium for 5 h. Data are expressed as mean ± SEM from three technical replicates (****P < 0.0001, two‐way ANOVA with Dunnett's multiple comparison test).
Data information: All of the experiments were done in NIH3T3 cells.
Source data are available online for this figure.
GRAMD1s play a critical role in the delivery of PM cholesterol to ER. We then tested whether GRAMD1s could facilitate SMO cholesterylation. Co‐expression of either GRAMD1A/B/C promoted cholesterol modification of WT and the ER‐resident form of SMO (Figs 6A and B, and EV5A–D). In addition, GRAMD1B increased the mature form of WT SMO but not SMO(D95E) in the presence of cholesterol (Fig 6C and D). The ShhN‐stimulated Gli1 expression was dramatically increased in the GRAMD1B‐overexpressing cells. And this effect was more pronounced in the presence of cholesterol (Fig 6E). ShhN stimulation promoted the distribution of GRAMD1B to the PM‐ER contact sites (Fig 6F and G). The D4H (Kinnebrew et al, 2021) staining indicated that ShhN increased PM accessible cholesterol level. The SMO inhibitor vismodegib failed to reverse such an effect, which ruled out the participation of the SMO downstream signaling pathway (Fig EV5E and F). Meanwhile, the mature form of SMO was increased by cholesterol and ShhN (Fig EV5G). GRAMD1B tended to localize in ER‐PM contact sites in Ptch1‐KO NIH3T3 cells compared with WT cells, suggesting that the Ptch1‐KO cells have more accessible cholesterol on the PM (Fig EV5H). These results suggest that the PM‐ER cholesterol transport positively regulates Hh signaling by providing cholesterol as a substrate for modifying ER‐localized SMO.
Figure 6. Overexpression of GRAMD proteins promotes the maturation of SMO and Hh signaling.

-
A, BGRAMD1B increased cholesterylation of SMO. HEK293T cells were co‐transfected with the SMO or SMO(4A) and GRAMD1B protein expression plasmids for 24 h and then incubated with a cholesterol depletion medium (DMEM supplemented with 5% lipoprotein‐deficient serum, 1 μM lovastatin, and 10 μM mevalonate) for 12 h, followed by 2 μg/ml of CP treatment. The cells were harvested and analyzed as depicted in Fig EV4D. Results shown are representative of two independent experiments.
-
C, DGRAMD1B promoted SMO maturation. The expression plasmids of SMO or SMO(D95E) and GRAMD1B were transfected into SMO‐KO HEK293T cells. After 12 h, cells were switched to a cholesterol depletion medium for 16 h and then added 50 μM MβCD‐cholesterol for 8 h. Black bracket indicates mature glycosylated form.
-
EExpression of Gli1 mRNAs measured by qRT–PCR in NIH3T3 cells stably expressing GRAMD1B. After incubating in serum starvation medium for 16 h, cells were depleted of cholesterol by treatment with 1.5% HPCD for 0.5 h and then incubated in serum starvation medium containing 1 μM lovastatin, 10 μM mevalonate and 10 μM MβCD‐cholesterol, ShhN as indicated for 24 h. Data are expressed as mean ± SEM from three technical replicates (****P < 0.0001; *P < 0.05; ns, not significant, unpaired two‐tailed Student's t‐test).
-
FConfocal images of NIH3T3 cells stably expressing mCherry‐GRAMD1B. PM was labeled with wheat germ agglutinin (WGA)‐CF®488A conjugate. Cells were incubated in a cholesterol depletion medium for 16 h and switched to the same medium containing 50 μM MβCD‐cholesterol for 1 h. Cells were then treated with or without ShhN‐conditioned medium for another 2 h. Results shown are representative of three independent experiments. Scale bars: 5 μm.
-
GThe percentage of cells with GRAMD1B localization on PM. Data are represented as mean ± SEM from three biological replicates (**P < 0.01, two‐way ANOVA with Sidak's multiple comparison test). Sixty to 70 cells were analyzed in each group in each experiment.
Source data are available online for this figure.
Figure EV5. The GRAMDs promote SMO cholesterylation and maturation.

-
A–DGRAMD1 proteins increased the cholesterylation of SMO and SMO(4A) in HEK293T cells.
-
ERepresentative confocal images show the D4H‐GFP signal on the PM of NIH3T3 cells. Vismodegib, 1 μM. Scale bars: 5 μm.
-
FQuantitative assessment of the intensity of D4H‐GFP in (E). At least 22 cells were analyzed in each treatment. Data are presented as median with interquartile (****P < 0.0001; one‐way ANOVA with Tukey's multiple comparison test).
-
GCholesterol and ShhN promoted SMO maturation in NIH3T3 cells.
-
HThe PM localization of mCherry‐GRAMD1B was increased in Ptch1‐KO NIH3T3 cells compared with WT cells. The PM was marked with WGA. Scale bars: 5 μm.
-
ISequencing results of Gramd gene in WT and Gramd‐5KO NIH3T3 cells. Inserted or deleted nucleotides that resulted in frame‐shift mutations were highlighted in red.
-
JThe mRNA levels of SREBP pathway genes in WT and Gramd‐5KO NIH3T3 cells. Data are expressed as mean ± SEM from three technical replicates. (****P < 0.0001; ***P < 0.001, unpaired two‐tailed Student's t‐test).
-
KThe HMGCR protein level in WT and Gramd‐5KO NIH3T3 cells.
Source data are available online for this figure.
Next, we generated GRAMDs penta‐knockout NIH3T3 cell line via CRISPR‐Cas9 technique (designated as 5KO) in which GRAMD1A, 1B, 1C, 2, and 3 were all ablated (Fig EV5I–K). Deletion of five GRAMD proteins resulted in decreased SMO cholesterylation in two independent clones (Fig 7A). ShhN failed to fully activate hedgehog signaling in the 5KO cells, as judged by SMO glycosylation, SMO ciliary translocation, and endogenous Gli1 expression (Fig 7B–G). The reduction in Gli1 mRNA level in 5KO cells can be partially rescued by overexpression of GRAMD1A, 1B, and 1C (Fig 7H). Pharmacological inhibition of GRAMD1s by AI3d, the selective chemical inhibitor (Xiao et al, 2021), downregulated cholesterol modification of SMO and Gli1 mRNA (Fig 7I and J).
Figure 7. Inhibition of GRAMD proteins hampers the maturation of SMO and Hh signaling.

- The cholesterol modification of endogenous SMO was decreased in NIH3T3 cells lacking Gramd1a, 1b, 1c, 2, and 3 (Gramd‐5KO). The cells were incubated in a cholesterol depletion medium for 12 h, followed by 2 μg/ml of CP and ShhN for an additional 12 h.
- The glycosylation of endogenous SMO was decreased in Gramd‐5KO NIH3T3 cells. The ShhN‐conditioned medium was applied for 24 h. Black bracket indicates mature glycosylated form.
- The ciliary localization of endogenous SMO in WT or Gramd‐5KO NIH3T3 cells. Cells were incubated in serum starvation medium for 24 h to fully induce cilia formation and then incubated with or without ShhN‐conditioned medium for 2 h. Results shown are representative of three independent experiments. Scale bars: 5 μm.
- Quantitative assessment of the intensity of ciliary SMO in (C). More than 100 cells were randomly selected and counted for each group. Data are presented as median with interquartile. (****P < 0.0001, two‐way ANOVA with Tukey's multiple comparison test).
- Quantification of the percentage of cells with ciliary SMO. Data are presented as mean ± SEM from three biological replicates (****P < 0.0001, two‐way ANOVA with Sidak's multiple comparison test). Eighty‐six to 100 cilia were analyzed in each group in each experiment.
- The protein levels of Gli1 were significantly reduced in Gramd‐5KO cells. The cells were incubated in a serum starvation medium with or without ShhN for 24 h. Results shown are representative of two independent experiments.
- GLI‐luciferase reporter assay in WT or Gramd‐5KO NIH3T3 cells. Data are presented as mean ± SEM from three technical replicates (****P < 0.0001; ***P < 0.001; *P < 0.05, two‐way ANOVA with Sidak's multiple comparison test).
- The Gli1 mRNA levels were measured in WT, Gramd‐5KO, Gramd‐5KO overexpression GRAMD1A, 1B, 1C NIH3T3 cells by qRT–PCR after treatment with or without ShhN‐conditioned medium for 8 h. Data are expressed as mean ± SEM from three technical replicates (****P < 0.0001, two‐way ANOVA with Tukey's multiple comparison test).
- The GRAMD inhibitor AI3d inhibited cholesterol modification of SMO in NIH3T3 cells. The cells were incubated in cholesterol depletion medium for 16 h and then treated with 3 μM AI3d for 6 h. Next, cells were incubated in the same medium containing ShhN and 2 μg/ml of CP for an additional 2 h.
- The GRAMD inhibitor AI3d decreased the mRNA levels of Gli1 in NIH3T3 cells. Cells were incubated in serum starvation medium for 16 h, depleted of cholesterol by 1.5% HPCD for 0.5 h, and then treated with serum starvation medium containing 1 μM lovastatin, 10 μM mevalonate and 1 μM AI3d for 6 h. Next, cells were incubated in the same medium containing ShhN and 10 μM MβCD‐cholesterol for an additional 16 h. Data are expressed as mean ± SEM from three technical replicates (****P < 0.0001, one‐way ANOVA with Sidak's multiple comparison test).
- Model for the regulation of intracellular transport of SMO by Hh signaling.
Source data are available online for this figure.
Based on the above data and others' work, we propose a model depicting how the Hh‐PTCH1 axis regulates the ER‐localized SMO (Fig 7K). The PM‐localized PTCH1 transports cholesterol and restricts the amount of accessible cholesterol in the PM. Hh binds to and inhibits PTCH1, thereby increasing the amount of accessible cholesterol in the PM (Zhang et al, 2018; Kinnebrew et al, 2021). The GRAMDs sense the PM cholesterol, promote ER‐PM contact formation, and deliver cholesterol to the ER from the PM. In the ER, SMO is modified by cholesterol through the Ca2+‐catalyzed autoprocessing mechanism (Hu et al, 2022). Cholesterylation of SMO probably by changing the conformation increases the interaction between the C‐terminal RRxWxR motif and COPII complex. At last, SMO is transported to primary cilium to participate in Hh signaling pathway.
Discussion
Our previous studies have shown that human SMO is cholesterylated on the D95 residue and this covalent modification is essential for its ciliary localization and function (Xiao et al, 2017). The cholesterol modification of SMO is a Ca2+‐accelerated autoprocessing reaction. A high‐energy intermediate, the D95‐Y130 intramolecular ester linkage, is involved in the SMO cholesterylation (Hu et al, 2022). The regulatory mechanism of SMO cholesterylation is complicated, depending on where SMO locates in the cell.
The Hh signaling initiates on the PM when Hh binds to PTCH1. PTCH1 possesses a hydrophobic conduit through which cholesterol can be transported to specific membrane microdomains or extracellular space, therefore limiting the amount of accessible cholesterol (Kinnebrew et al, 2021). Hh binds to PTCH1 and blocks the conduit within PTCH1. Therefore, the cholesterol level and distribution in the PM are altered (Zhang et al, 2018; Kinnebrew et al, 2019, 2021; Radhakrishnan et al, 2020). Our studies suggest that three pools of SMO, at the PM, endosomes, and the ER are differently regulated. For the PM SMO, the increased amounts of accessible cholesterol in the PM, together with high concentrations of extracellular Ca2+ (Hurwitz, 1996), cause cholesterylation of SMO. This portion of active SMO then transduces signal to the ER through Gαi‐IP3R, resulting in the ER Ca2+ depletion and STIM1 oligomerization. The ER‐localized STIM1 binds to ORAI1 in the PM and causes ORAI1 channel to open, allowing the extracellular Ca2+ to flow into cytosol. This process results in elevated Ca2+ concentration in SMO‐localized endosomes and increased cholesterylation of the endosomal SMO that occurs through the Ca2+‐stimulated autoreaction. Our current work reveals how ER‐localized SMO is regulated by the Hh‐PTCH1 axis. The increased accessible PM cholesterol following Hh stimulation can be sensed by GRAMD1s in the ER, which via the GRAMD domains bind to cholesterol and anion lipids in the PM and promote ER‐PM membrane contacts formation, and via the StART‐like domains transport cholesterol to the ER from the PM. Because the ER lumen has high concentrations of Ca2+, cholesterylation of SMO happens with the elevated cholesterol supplied from the PM. The model explains how the three pools of SMO are modified by cholesterol that is regulated by Hh/PTCH1.
The activation of the endosome‐ and ER‐localized SMO are coordinated in cells. The STIM1‐ORAI1 interaction mediates the ER‐PM contacts where GRAMD2 is also present (Besprozvannaya et al, 2018). The GRAMD2 marks a subset of ER‐PM membrane contacts that are required for PM STIM1 recruitment (Besprozvannaya et al, 2018). Hh stimulation induces cytosolic Ca2+ increases, which promote ER‐PM contacts tethered by E‐SYT1, 2, and 3. GRMAD2 also co‐localizes with E‐SYT tethers at ER‐PM contacts. In our results, Hh stimulation does increase the ER‐PM contact localization of GRAMD1B. Notably, the cholesterylation level of ER‐retention mutant SMO(4A) is only one‐fourth that of SMO(WT) (Fig 4G), suggesting that cholesterylation occurs in other post‐ER compartments, such as the cholesterol‐rich endosomes. Thus, the noncholesterylated SMO could be transported to Golgi and beyond in a relatively slow manner. As ShhN still increased the binding of SMO(D95E) to SAR1B although the magnitude was lower compared with SMO(WT) (Fig 4I), it is possible that Hh/PTCH1 might regulate SMO ER exit through an additional mechanism that is independent of SMO cholesterylation. For example, the activated PM‐ or endosome‐localized SMO can transduce signals that could cause the phosphorylation of ER‐localized SMO and accelerate its ER exit.
Structural studies reveal that cholesterol‐induced conformational change of SMO CRD and the transmembrane domain is the key to SMO activation. However, the cytoplasmic tail of SMO is either truncated or invisible in these structures due to high flexibility (Byrne et al, 2016; Huang et al, 2016, 2018). With the aid of proximity‐dependent biotinylation assay, we provided indirect evidence showing the interaction between the C‐terminal tail of SMO and COPII subunit. The cytoplasmic tail of SMO is indispensable for maintaining the proper activity of SMO, since C‐terminally truncated SMO is unable to rescue Smo −/− phenotype in Drosophila (Nakano et al, 2004). Meanwhile, multiple phosphorylation and ubiquitination sites are identified on the cytosolic tail, which plays an essential role in SMO oligomerization, endocytosis, and ciliary localization (Zhang et al, 2004; Zhao et al, 2007; Li et al, 2012, 2018; Hu & Song, 2019). In our study, we highlight a conserved motif, RRxWxR, in the cytosolic tail capable of interacting with the COPII complex for ER exit. The WR residues overlapping to this motif have been shown to regulate ciliary translocation and development function in zebrafish (Fig EV2E; Corbit et al, 2005). Our current results demonstrate that the defective translocation of mouse SMO(W549R to AA) to primary cilium likely results from ablated COPII transport (Corbit et al, 2005). A previous study proved that KAAD‐cyclopamine could enhance the glycosylation of SMO (Chen et al, 2002), presumably by affecting the exposure of RRxWxR to COPII complex.
Collectively, our work demonstrates that the increase of accessible cholesterol in the PM recruits GRAMDs to ER‐PM junctions, allowing for the transfer of cholesterol to the ER to covalently modify SMO. SMO cholesterylation can expose the RRxWxR motif to COPII machinery, promoting SMO to transport to Golgi and then primary cilium to become fully functional. Our results demonstrate the novel role of GRAMDs in modulating SMO activity and the crosstalk between intracellular cholesterol transport and Hh signaling.
Materials and Methods
Reagents and Tools table
| Reagent or Resource | Source | Identifier |
|---|---|---|
| Antibodies | ||
| Mouse mAb anti‐FLAG, clone M2 | Sigma | Cat#F3165; RRID: AB_259529 |
| Mouse mAb anti‐SMO, clone E5 | Santa Cruz | Cat#sc‐166685; RRID: AB_2239686 |
| Mouse mAb anti‐GLI1, clone L42B10 | Cell Signaling Technology | Cat#2643; RRID: AB_2294746 |
| Mouse mAb anti‐Ace‐tubulin | Sigma | Cat#T6793; RRID: AB_477585 |
| Mouse mAb anti‐Myc‐9E10 | ATCC clone 9E10 | ATCC Cat#CRL‐1729 |
| Mouse mAb anti‐beta Actin | Proteintech | Cat#66009‐1‐lg; RRID: AB_2687938 |
| Rabbit pAb anti‐ARL13B | Proteintech | Cat#17711‐1‐AP RRID: AB_2060867 |
| Mouse mAb anti‐HMGCR‐A9 | ATCC clone A9 | ATCC Cat#CRL‐1811 |
| Rabbit pAb anti‐mCherry | Proteintech | Cat#26765‐1‐AP; RRID: AB_2876881 |
| Bacterial and virus strains | ||
| DH5α Competent Cells | Bao‐Liang Song Lab | N/A |
| Chemicals, peptides, and recombinant proteins | ||
| Cholesterol | Sigma | Cat#C3045 |
| Methyl‐β‐cyclodextrin | CTD, Inc. | Cat#TRMB‐P |
| Hydropropyl‐β‐cyclodextrin | CTD, Inc. | Cat#THPB‐P |
| Cycloheximide | Sigma | Cat#C1988 |
| Cyclopamine | MCE | Cat#4449‐51‐8 |
| Cholesterol probe (CP) | Bao‐Liang Song Lab | Xiao et al (2017) |
| CuSO4 | Sigma | Cat#C8027 |
| TBTA | Tokyo Chemical Industry | Cat#T2993 |
| Sodium L‐ascorbate | Sigma | Cat#A7631 |
| Biotin alkyne | Bao‐Liang Song Lab | Xiao et al (2017) |
| Endoglycosidase H (Endo H) | New England Biolabs | Cat# P0703L |
| Peptide N‐Glycosidase F (PNGase F) | New England Biolabs | Cat#P0704L |
| Lipoprotein‐deficient serum (LPDS) | This study | N/A |
| Trypsin | Promega | Cat#V5111 |
| AI‐3d | Peter Tontonoz | Xiao et al (2021) |
| Vismodegib | MCE | Cat#HY‐10440 |
| Critical commercial assays | ||
| Luciferase assay kit | Promega | Cat#E1500 |
| NeutrAvidin agarose | Thermo Scientific | Cat#29202 |
| Wheat germ agglutinin (WGA)‐CF®488 | Biotium | Cat#29022‐1 |
| Dialysis devices | Thermo Scientific | Cat#88404 |
| QuikChange mutagenesis kit | Agilent | Cat#200519 |
| qPCR SYBR Green master mix | Yeasen Biotech | Cat#11201ES03 |
| Experimental models: cell lines | ||
| HEK293T cell | ATCC | Cat#CRL‐3216 |
| NIH3T3 cell | ATCC | Cat#CRL‐1658 |
| Oligonucleotides | ||
| qPCR‐msGli1‐F: CTACTCGGGGTTCAATGATGC | This study | N/A |
| qPCR‐msGli1‐R: TGTGGAGTTGGGGCTAGACAT | This study | N/A |
| qPCR‐msGapdh‐F: TGTGTCCGTCGTGGATCTGA | This study | N/A |
| qPCR‐msGapdh‐R: CCTGCTTCACCACCTTCTTGAT | This study | N/A |
| qPCR‐ms18s‐F: agtccctgccctttgtacaca | This study | N/A |
| qPCR‐ms18s‐R: cgatccgagggcctcacta | This study | N/A |
| qPCR‐msSrebp2‐F: GCGTTCTGGAGACCATGGA | This study | N/A |
| qPCR‐msSrebp2‐R: ACAAAGTTGCTCTGAAAACAAATCA | This study | N/A |
| qPCR‐msHmgcs‐F: GCCGTGAACTGGGTCGAA | This study | N/A |
| qPCR‐msHmgcs‐R: GCATATATAGCAATGTCTCCTGCAA | This study | N/A |
| qPCR‐msHmgcr‐F: CTTGTGGAATGCCTTGTGATTG | This study | N/A |
| qPCR‐msHmgcr‐R: AGCCGAAGCAGCACATGAT | This study | N/A |
| qPCR‐msMvk‐F: GGTGTGGTCGGAACTTCCC | This study | N/A |
| qPCR‐msMvk‐R: CCTTGAGCGGGTTGGAGAC | This study | N/A |
| qPCR‐msFdft1‐F: TCCCTGACGTCCTCACCTAC | This study | N/A |
| qPCR‐msFdft1‐R: GGGGATCCGGTGATAAATCT | This study | N/A |
| qPCR‐msLss‐F: GCACACCACAGACCTGAGTTTC | This study | N/A |
| qPCR‐msLss‐R: GGACAGTTTTCTGGAACCTGTGA | This study | N/A |
| qPCR‐msLdlr‐F: TGACTCAGACGAACAAGGCTG | This study | N/A |
| qPCR‐msLdlr‐R: ATCTAGGCAATCTCGGTCTCC | This study | N/A |
| qPCR‐msInsig1‐F: TCACAGTGACTGAGCTTCAGCA | This study | N/A |
| qPCR‐msInsig1‐R: TCATCTTCATCACACCCAGGAC | This study | N/A |
| Software and algorithms | ||
| Leica Application Suite X | Leica | https://www.leica‐microsystems.com/products/microscope‐software/p/leica‐las‐x‐ls/ |
| ImageJ | NIH | https://imagej.nih.gov/ij/ |
| GraphPad Prism 6.01 | GraphPad | http://graphpad.com/ |
Recombinant plasmids
The following expression plasmids were used: pCMV‐SMO‐3 × FLAG and variants encode full‐length or C‐terminally truncated human SMO followed by 3 × FLAG epitope, pCMV‐SMO encodes full‐length human SMO without tag, pSMO‐EGFP encodes full‐length human SMO followed by an EGFP epitope. pCMV‐PTCH1‐5 × Myc encodes full‐length mouse PTCH1 followed by 5 × Myc epitope, pCMV‐ShhN encodes the N‐terminal mouse Shh (a.a. 1–198) without tag. pCMV‐GRAMD 1A, 1B, 1C, 2, 3–3 × FLAG encodes full‐length human GRAMD 1A, 1B, 1C, 2, 3 followed by 3 × FLAG epitope. pmCherry‐GRAMD 1B encodes full‐length human GRAMD1B and an N‐terminal mCherry epitope. The pET‐28a‐6 × His‐FLAG‐ALOD4 was generated by synthesizing the sequences of FLAG along with ALO (amino acid 404–512) bearing two‐point mutation (Infante & Radhakrishnan, 2017) and then inserted into the C terminus of 6 × His in pET‐28a. Site‐directed mutagenesis was performed using KOD Hot Start DNA polymerase (Novagen).
Cell culture and transfection
NIH3T3, HEK293T cells were grown in a monolayer at 37°C under 5% CO2. HEK293T cells were maintained in medium A (DMEM and 100 units/ml penicillin and 100 μg/ml streptomycin sulfate) supplemented with 10% fetal bovine serum (FBS). NIH3T3 was maintained in medium A supplemented with 10% fetal calf serum (FCS). The cholesterol depletion medium was medium A supplemented with 5% lipoprotein‐deficient serum (LPDS, d > 1.215 g ml/l), 1 μM lovastatin, and 10 μM mevalonate. NIH3T3 cells were transfected with LTX (Invitrogen) following the manufacturer's protocol. HEK293T cells were transfected with LPEI.
Method details
Generation of stable cell lines and knockout cell lines
HEK293T cells stably expressing SAR1B‐BirA*‐FLAG or mCherry‐GRAMD1B were generated by transient transfection followed by antibiotic selection. Single clones were isolated and sequenced. HEK293T cells were used to generate SMO‐KO cells, and NIH3T3 cells were used to generate Smo‐KO, Ptch1‐KO, and Gramd‐5KO cells using the CRISPR‐Cas9 system. gRNA was designed by the CRISPR Design website and then cloned into a pX330 vector. The gRNA‐containing constructs and a puromycin‐resistant expression plasmid were co‐transfected into HEK293T or NIH3T3 cells. Cells were selected with 4 μg/ml puromycin and then seeded into 96‐well plates. Clones derived from single cell were identified by sequencing. The gRNA sequences were as follows: human SMO‐GTTGTAGCGCAGCGGCTCGC, mouse Smo‐GCTGCTGAGCCACTGCGGC, mouse Ptch1‐CAGATAGTCCCGGTCCGGCG, mouse Gramd1a‐GCTCCCCGTCTCTTCGTAAG, Gramd1b‐GACACGGAGCGCCTCATTGT, Gramd1c‐GAAGCAGCGTGGATGACGCT, Gramd2‐TAAAGAAGTATAGCCGGGAA, Gramd3‐CATCTGTGGAGGCCGAGTCC.
Glycosylation analysis assay
Cells were transfected for 48 h, harvested, and lysed with RIPA buffer (50 mM Tris–HCl, pH 8.0, 150 mM NaCl, 0.1% SDS, 1.5% NP40, 0.5% deoxycholate, 2 mM MgCl2) plus protease inhibitors. The lysates were passed through a 22‐gauge needle 10 times and centrifuged at 17,142 g for 10 min at 4°C. The resulting supernatants were incubated with denaturing buffer (New England Biolabs) at 95°C for 10 min, then were treated with Endo H or PNGase F for 1 h at 37°C. The samples were subjected to immunoblotting analysis (Wang et al, 2011).
Proximity‐dependent biotinylation assay
HEK293T cells were transfected with plasmids encoding SAR1B‐BirA*‐FLAG and SMO for 48 h and then incubated in DMEM supplemented with 10% FBS and 15 μM biotin for 4 h. The cells were harvested and lysed by RIPA buffer containing protease inhibitors. Lysates were dialyzed against RIPA to remove free biotin, and biotinylated proteins were precipitated by streptavidin beads (Hu et al, 2018).
Streptavidin pull‐down assay
The cells were lysed with RIPA buffer containing protease inhibitors. After dialyzing against RIPA to remove free biotin, the lysates were incubated with 20 μl streptavidin agarose for 6 h at 4°C. Then, beads were washed five times with 1 ml RIPA buffer. The biotinylated proteins were eluted with SDS–PAGE sample buffer and subjected to immunoblotting analysis.
Preparation of mouse liver cytosol
The livers of C57BL/6 mice were perfused with 0.9% (w/v) NaCl through the portal vein at room temperature. The livers were excised and cut into small pieces, then adjusted to 2 ml/g of ice‐cold buffer E containing 50 mM HEPES‐KOH at pH 7.2, 250 mM sucrose, 70 mM KOAc, 5 mM potassium EGTA, 2.5 mM Mg (OAc)2 plus protease inhibitors (10 μg/ml leupeptin, 5 μg/ml pepstatin A, 25 μg/ml ALLN, 1 mM DTT). Livers were disrupted by a homogenizer. Homogenates were centrifuged at 1,000 g for 10 min. Supernatants were sequentially centrifuged at 20,000 g for 20 min, 186,000 g for 1 h, and 186,000 g for 45 min. The final supernatant was collected to obtain purified cytosol (Lu et al, 2020).
Isolation of microsomal membranes
The HEK293T cells were harvested and lysed in 0.5 ml of buffer B (50 mM HEPES, pH 6.8, 250 mM sucrose, 10 mM KOAc, and 0.5 mM Mg(OAc)2). The cell suspension was passed through a 22‐gauge needle 20 times and centrifuged at 1,000 g for 5 min at 4°C. The supernatant from this spin was centrifuged at 16,000 g for 3 min at 4°C. The pellet was resuspended and washed twice with 0.5 ml buffer A (50 mM HEPES, pH 7.2, 250 mM sucrose, 70 mM KOAc, and 1.5 mM Mg(OAc)2, 5 mM potassium EGTA), centrifuged at 16,000 g for 3 min at 4°C, and finally resuspended in 80 μl buffer A (Nohturfft et al, 2000).
In vitro vesicle budding assay
Each reaction contained 80 μl of buffer A, 80 μg of microsomal membranes from HEK293T cells, 30–1,000 μg of mouse liver cytosol, 12 mM ATP, 4 mM GTP, 80 mM creatine phosphate, 32 units/ml creatine kinase, and protease inhibitors. Reactions were performed at 28°C for 15 min and stopped by putting on ice for 1 min followed by centrifugation at 16,000 g for 3 min at 4°C. Sixty microliters of supernatants were centrifuged at 100,000 g for 20 min at 4°C. The supernatants were discarded, and the pellet fractions were designated as vesicles. After removing the remaining supernatants from 16,000 g spin, the pellet fraction was designated as membranes. The samples were subjected to immunoblotting analysis (Sun et al, 2005).
Click chemistry
This reaction was performed as previously reported (Tang et al, 2011). Briefly, 100 μM biotin alkyne, CuSO4, and Vc were mixed, and then, TBTA was added. The mixture was allowed to react at room temperature for 1.5 h.
Protein stability assay
Cells were transfected with SMO(WT) and SMO(4A) expressing plasmids for 24 h and treated with 100 μM cycloheximide for different time durations (0, 1, 2, 4, 6, and 8 h). Then, cells were harvested and were subjected to immunoblotting analysis. Densitometry at t = 0 was defined as 100% (Ma et al, 2016).
Immunofluorescence
The NIH3T3 cells were grown to confluency and incubated in serum starvation medium (0.5% FCS/DMEM) or DMEM for 24 h to fully induce cilia formation. After fixation with 4% paraformaldehyde (PFA) in PBS at −20°C for 5 min (for Ace‐tubulin immunostaining) or at room temperature for 30 min, cells were permeabilized with 0.2% Triton X‐100 in PBS. Cells were blocked with 1% BSA in PBS and incubated with primary antibodies overnight and fluorescent secondary antibodies for 1 h at room temperature. The NIH3T3 cells stably expressing mCherry‐GRAMD1B were incubated for 10 min in PBS containing 0.75 μg/ml of CF®488‐labeled wheat germ agglutinin at room temperature and fixed with 4% paraformaldehyde (PFA) in PBS (Mohammadpour et al, 2017). Confocal images were taken using the laser scanning confocal microscopy (Leica SP8).
Fluorescence quantification
For ciliary SMO quantification, the cilia were outlined with a mask in the Ace‐tubulin (or ARL 13B) channel and the SMO fluorescence intensities were then measured in the SMO image channel by ImageJ (or by Leica LAS X). The fluorescence intensity of ciliary SMO was obtained by using cilium‐located SMO fluorescence intensity divided by the area of the corresponding cilium. More than 60 cells were randomly selected and calculated for each group.
Gli‐luciferase reporter assay
This reaction was performed as previously reported (Xiao et al, 2017). NIH3T3 cells were plated in 24‐well plates at 6 × 10⁴ cells. Cells were transfected for 24 h, grown to confluency, and switched to serum starvation medium (0.5% FCS/DMEM) containing different amounts of ShhN for 24 h. The cells were lysed and the firefly and Renilla luciferase activities were measured using the Dual‐Luciferase Reporter Kit (Promega) and read on a GLOMAX luminometer (Promega). The Gli‐firefly/Renilla luciferase ratio indicated hedgehog signaling activity. All of the samples were conducted in triplicate (Fu et al, 2016).
Statistical analysis
Data are analyzed by GraphPad Prism 6.01.
Author contributions
Xiaolu Zhao: Supervision; writing – review and editing. Wan‐Er Zeng: Investigation; methodology. Jie Luo: Supervision; validation; investigation; methodology; writing – review and editing. Xiong‐Jie Shi: Data curation; supervision; investigation; methodology. Zhi‐Ping Qiu: Data curation; validation; investigation; visualization; methodology; writing – original draft; writing – review and editing. Yuan‐Bin Liu: Resources; validation; methodology. Ao Hu: Resources; validation; methodology; writing – review and editing. Zi‐Cun Lin: Data curation; validation; visualization; methodology; writing – review and editing. Bao‐Liang Song: Conceptualization; data curation; supervision; funding acquisition; investigation; methodology; project administration; writing – review and editing.
Disclosure and competing interests statement
The authors declare that they have no conflict of interest.
Supporting information
Expanded View Figures PDF
Source Data for Expanded View
PDF+
Source Data for Figure 1
Source Data for Figure 2
Source Data for Figure 3
Source Data for Figure 4
Source Data for Figure 5
Source Data for Figure 6
Source Data for Figure 7
Acknowledgements
We thank Ms. Dan Liang and Jing Jin for their technical assistance. We thank Dr. Peter Tontonoz (UCLA) for AI3d and Dr. Xiao‐Wei Chen (Peking University) for the SAR1B and VirA plasmids. This work was supported by grants from the National Natural Science Foundation of China (92153301, 32021003) and the Ministry of Science and Technology of the People's Republic of China (2018YFA0800703). B‐LS acknowledges the support from the Tencent Foundation through the XPLORER PRIZE.
The EMBO Journal (2023) 42: e111513
Data availability
This study includes no data deposited in external repositories.
References
- Beachy PA, Karhadkar SS, Berman DM (2004) Tissue repair and stem cell renewal in carcinogenesis. Nature 432: 324–331 [DOI] [PubMed] [Google Scholar]
- Besprozvannaya M, Dickson E, Li H, Ginburg KS, Bers DM, Auwerx J, Nunnari J (2018) GRAM domain proteins specialize functionally distinct ER‐PM contact sites in human cells. eLife 7: e31019 [DOI] [PMC free article] [PubMed] [Google Scholar]
- Bielli A, Haney CJ, Gabreski G, Watkins SC, Bannykh SI, Aridor M (2005) Regulation of Sar1 NH2 terminus by GTP binding and hydrolysis promotes membrane deformation to control COPII vesicle fission. J Cell Biol 171: 919–924 [DOI] [PMC free article] [PubMed] [Google Scholar]
- Briscoe J, Therond PP (2013) The mechanisms of hedgehog signalling and its roles in development and disease. Nat Rev Mol Cell Biol 14: 416–429 [DOI] [PubMed] [Google Scholar]
- Byrne EFX, Sircar R, Miller PS, Hedger G, Luchetti G, Nachtergaele S, Tully MD, Mydock‐McGrane L, Covey DF, Rambo RP et al (2016) Structural basis of smoothened regulation by its extracellular domains. Nature 535: 517–522 [DOI] [PMC free article] [PubMed] [Google Scholar]
- Chen JK, Taipale J, Cooper MK, Beachy PA (2002) Inhibition of hedgehog signaling by direct binding of cyclopamine to smoothened. Genes Dev 16: 2743–2748 [DOI] [PMC free article] [PubMed] [Google Scholar]
- Chu BB, Liao YC, Qi W, Xie C, Du X, Wang J, Yang H, Miao HH, Li BL, Song BL (2015) Cholesterol transport through lysosome‐peroxisome membrane contacts. Cell 161: 291–306 [DOI] [PubMed] [Google Scholar]
- Corbit KC, Aanstad P, Singla V, Norman AR, Stainier DY, Reiter JF (2005) Vertebrate smoothened functions at the primary cilium. Nature 437: 1018–1021 [DOI] [PubMed] [Google Scholar]
- Das A, Brown MS, Anderson DD, Goldstein JL, Radhakrishnan A (2014) Three pools of plasma membrane cholesterol and their relation to cholesterol homeostasis. eLife 3: e02882 [DOI] [PMC free article] [PubMed] [Google Scholar]
- Deshpande I, Liang J, Hedeen D, Roberts KJ, Zhang Y, Ha B, Latorraca NR, Faust B, Dror RO, Beachy PA et al (2019) Smoothened stimulation by membrane sterols drives hedgehog pathway activity. Nature 571: 284–288 [DOI] [PMC free article] [PubMed] [Google Scholar]
- Dobbs N, Burnaevskiy N, Chen D, Gonugunta VK, Alto NM, Yan N (2015) STING activation by translocation from the ER is associated with infection and autoinflammatory disease. Cell Host Microbe 18: 157–168 [DOI] [PMC free article] [PubMed] [Google Scholar]
- Ercan B, Naito T, Koh DHZ, Dharmawan D, Saheki Y (2021) Molecular basis of accessible plasma membrane cholesterol recognition by the GRAM domain of GRAMD1b. EMBO J 40: e106524 [DOI] [PMC free article] [PubMed] [Google Scholar]
- Espenshade PJ, Li WP, Yabe D (2002) Sterols block binding of COPII proteins to SCAP, thereby controlling SCAP sorting in ER. Proc Natl Acad Sci USA 99: 11694–11699 [DOI] [PMC free article] [PubMed] [Google Scholar]
- Fu L, Wu H, Cheng SY, Gao D, Zhang L, Zhao Y (2016) Set7 mediated Gli3 methylation plays a positive role in the activation of sonic hedgehog pathway in mammals. eLife 5: e15690 [DOI] [PMC free article] [PubMed] [Google Scholar]
- Giraudo CG, Maccioni HJ (2003) Endoplasmic reticulum export of glycosyltransferases depends on interaction of a cytoplasmic dibasic motif with Sar1. Mol Biol Cell 14: 3753–3766 [DOI] [PMC free article] [PubMed] [Google Scholar]
- Gong X, Qian H, Cao P, Zhao X, Zhou Q, Lei J, Yan N (2018) Structural basis for the recognition of sonic hedgehog by human Patched1. Science 361: eaas8935 [DOI] [PubMed] [Google Scholar]
- Höglinger D, Burgoyne T, Sanchez‐Heras E, Hartwig P, Colaco A, Newton J, Futter CE, Spiegel S, Platt FM, Eden ER (2019) NPC1 regulates ER contacts with endocytic organelles to mediate cholesterol egress. Nat Commun 10: 4276 [DOI] [PMC free article] [PubMed] [Google Scholar]
- Hu A, Song BL (2019) The interplay of patched, smoothened and cholesterol in hedgehog signaling. Curr Opin Cell Biol 61: 31–38 [DOI] [PubMed] [Google Scholar]
- Hu A, Zhao XT, Tu H, Xiao T, Fu T, Wang Y, Liu Y, Shi XJ, Luo J, Song BL (2018) PIP4K2A regulates intracellular cholesterol transport through modulating PI(4,5)P2 homeostasis. J Lipid Res 59: 507–514 [DOI] [PMC free article] [PubMed] [Google Scholar]
- Hu A, Zhang JZ, Wang J, Li CC, Yuan M, Deng G, Lin ZC, Qiu ZP, Liu HY, Wang XW et al (2022) Cholesterylation of smoothened is a calcium‐accelerated autoreaction involving an intramolecular ester intermediate. Cell Res 32: 288–301 [DOI] [PMC free article] [PubMed] [Google Scholar]
- Huang P, Nedelcu D, Watanabe M, Jao C, Kim Y, Liu J, Salic A (2016) Cellular cholesterol directly activates smoothened in hedgehog signaling. Cell 166: 1176–1187 [DOI] [PMC free article] [PubMed] [Google Scholar]
- Huang P, Zheng S, Wierbowski BM, Kim Y, Nedelcu D, Aravena L, Liu J, Kruse AC, Salic A (2018) Structural basis of smoothened activation in hedgehog signaling. Cell 174: 312–324 [DOI] [PMC free article] [PubMed] [Google Scholar]
- Hurwitz S (1996) Homeostatic control of plasma calcium concentration. Crit Rev Biochem Mol Biol 31: 41–100 [DOI] [PubMed] [Google Scholar]
- Infante RE, Radhakrishnan A (2017) Continuous transport of a small fraction of plasma membrane cholesterol to endoplasmic reticulum regulates total cellular cholesterol. eLife 6: e25466 [DOI] [PMC free article] [PubMed] [Google Scholar]
- Kinnebrew M, Iverson EJ, Patel BB, Pusapati GV, Kong JH, Johnson KA, Luchetti G, Eckert KM, McDonald JG, Covey DF et al (2019) Cholesterol accessibility at the ciliary membrane controls hedgehog signaling. eLife 8: e50051 [DOI] [PMC free article] [PubMed] [Google Scholar]
- Kinnebrew M, Luchetti G, Sircar R, Frigui S, Viti LV, Naito T, Beckert F, Saheki Y, Siebold C, Radhakrishnan A et al (2021) Patched 1 reduces the accessibility of cholesterol in the outer leaflet of membranes. eLife 10: e70504 [DOI] [PMC free article] [PubMed] [Google Scholar]
- Li S, Chen Y, Shi Q, Yue T, Wang B, Jiang J (2012) Hedgehog‐regulated ubiquitination controls smoothened trafficking and cell surface expression in Drosophila . PLoS Biol 10: e1001239 [DOI] [PMC free article] [PubMed] [Google Scholar]
- Li S, Li S, Wang B, Jiang J (2018) Hedgehog reciprocally controls trafficking of Smo and Ptc through the Smurf family of E3 ubiquitin ligases. Sci Signal 11: eaan8660 [DOI] [PMC free article] [PubMed] [Google Scholar]
- Litvinov DY, Savushkin EV, Dergunov AD (2018) Intracellular and plasma membrane events in cholesterol transport and homeostasis. J Lipids 2018: 3965054 [DOI] [PMC free article] [PubMed] [Google Scholar]
- Lu XY, Shi XJ, Hu A, Wang JQ, Ding Y, Jiang W, Sun M, Zhao X, Luo J, Qi W et al (2020) Feeding induces cholesterol biosynthesis via the mTORC1‐USP20‐HMGCR axis. Nature 588: 479–484 [DOI] [PubMed] [Google Scholar]
- Luo J, Jiang LY, Yang H, Song BL (2019) Intracellular cholesterol transport by sterol transfer proteins at membrane contact sites. Trends Biochem Sci 44: 273–292 [DOI] [PubMed] [Google Scholar]
- Ma G, Li S, Han Y, Li S, Yue T, Wang B, Jiang J (2016) Regulation of smoothened trafficking and hedgehog signaling by the SUMO pathway. Dev Cell 39: 438–451 [DOI] [PMC free article] [PubMed] [Google Scholar]
- Mann RK, Beachy PA (2004) Novel lipid modifications of secreted protein signals. Annu Rev Biochem 73: 891–923 [DOI] [PubMed] [Google Scholar]
- Marada S, Navarro G, Truong A, Stewart DP, Arensdorf AM, Nachtergaele S, Angelats E, Opferman JT, Rohatgi R, McCormick PJ et al (2015) Functional divergence in the role of N‐linked glycosylation in smoothened signaling. PLoS Genet 11: e1005473 [DOI] [PMC free article] [PubMed] [Google Scholar]
- Mohammadpour R, Safarian S, Buckway B, Ghandehari H (2017) Comparative endocytosis mechanisms and anticancer effect of HPMA copolymer‐ and PAMAM dendrimer‐MTCP conjugates for photodynamic therapy. Macromol Biosci 17: 10.1002/mabi.201600333 [DOI] [PMC free article] [PubMed] [Google Scholar]
- Naito T, Ercan B, Krshnan L, Triebl A, Koh DHZ, Wei FY, Tomizawa K, Torta FT, Wenk MR, Saheki Y (2019) Movement of accessible plasma membrane cholesterol by the GRAMD1 lipid transfer protein complex. eLife 8: e51401 [DOI] [PMC free article] [PubMed] [Google Scholar]
- Nakano Y, Nystedt S, Shivdasani AA, Strutt H, Thomas C, Ingham PW (2004) Functional domains and sub‐cellular distribution of the hedgehog transducing protein smoothened in Drosophila . Mech Dev 121: 507–518 [DOI] [PubMed] [Google Scholar]
- Nie C, Wang H, Wang R, Ginsburg D, Chen XW (2018) Dimeric sorting code for concentrative cargo selection by the COPII coat. Proc Natl Acad Sci USA 115: E3155–E3162 [DOI] [PMC free article] [PubMed] [Google Scholar]
- Nohturfft A, Yabe D, Goldstein JL, Brown MS, Espenshade PJ (2000) Regulated step in cholesterol feedback localized to budding of SCAP from ER membranes. Cell 102: 315–323 [DOI] [PubMed] [Google Scholar]
- Ocbina PJ, Anderson KV (2008) Intraflagellar transport, cilia, and mammalian hedgehog signaling: analysis in mouse embryonic fibroblasts. Dev Dyn 237: 2030–2038 [DOI] [PMC free article] [PubMed] [Google Scholar]
- Petrova R, Joyner AL (2014) Roles for hedgehog signaling in adult organ homeostasis and repair. Development 141: 3445–3457 [DOI] [PMC free article] [PubMed] [Google Scholar]
- Porter JA, Young KE, Beachy PA (1996) Cholesterol modification of hedgehog signaling proteins in animal development. Science 274: 255–259 [DOI] [PubMed] [Google Scholar]
- Pucadyil TJ, Schmid SL (2009) Conserved functions of membrane active GTPases in coated vesicle formation. Science 325: 1217–1220 [DOI] [PMC free article] [PubMed] [Google Scholar]
- Qi X, Liu H, Thompson B, McDonald J, Zhang C, Li X (2019) Cryo‐EM structure of oxysterol‐bound human smoothened coupled to a heterotrimeric Gi. Nature 571: 279–283 [DOI] [PMC free article] [PubMed] [Google Scholar]
- Qi X, Friedberg L, De Bose‐Boyd R, Long T, Li X (2020) Sterols in an intramolecular channel of smoothened mediate hedgehog signaling. Nat Chem Biol 16: 1368–1375 [DOI] [PMC free article] [PubMed] [Google Scholar]
- Qiu ZP, Hu A, Song BL (2021) The 3‐beta‐hydroxysteroid‐Delta(8), Delta(7)‐isomerase EBP inhibits cholesterylation of smoothened. Biochim Biophys Acta Mol Cell Biol Lipids 1866: 159041 [DOI] [PubMed] [Google Scholar]
- Radhakrishnan A, Rohatgi R, Siebold C (2020) Cholesterol access in cellular membranes controls hedgehog signaling. Nat Chem Biol 16: 1303–1313 [DOI] [PMC free article] [PubMed] [Google Scholar]
- Rohatgi R, Milenkovic L, Scott MP (2007) Patched1 regulates hedgehog signaling at the primary cilium. Science 317: 372–376 [DOI] [PubMed] [Google Scholar]
- Rohatgi R, Milenkovic L, Corcoran RB, Scott MP (2009) Hedgehog signal transduction by smoothened: pharmacologic evidence for a 2‐step activation process. Proc Natl Acad Sci USA 106: 3196–3201 [DOI] [PMC free article] [PubMed] [Google Scholar]
- Roux KJ, Kim DI, Raida M, Burke B (2012) A promiscuous biotin ligase fusion protein identifies proximal and interacting proteins in mammalian cells. J Cell Biol 196: 801–810 [DOI] [PMC free article] [PubMed] [Google Scholar]
- Rubin LL, de Sauvage FJ (2006) Targeting the hedgehog pathway in cancer. Nat Rev Drug Discov 5: 1026–1033 [DOI] [PubMed] [Google Scholar]
- Ryan KE, Chiang C (2012) Hedgehog secretion and signal transduction in vertebrates. J Biol Chem 287: 17905–17913 [DOI] [PMC free article] [PubMed] [Google Scholar]
- Sandhu J, Li S, Fairall L, Pfisterer SG, Gurnett JE, Xiao X, Weston TA, Vashi D, Ferrari A, Orozco JL et al (2018) Aster proteins facilitate nonvesicular plasma membrane to ER cholesterol transport in mammalian cells. Cell 175: 514–529 [DOI] [PMC free article] [PubMed] [Google Scholar]
- Sun LP, Li L, Goldstein JL, Brown MS (2005) Insig required for sterol‐mediated inhibition of Scap/SREBP binding to COPII proteins in vitro. J Biol Chem 280: 26483–26490 [DOI] [PubMed] [Google Scholar]
- Taipale J, Cooper MK, Maiti T, Beachy PA (2002) Patched acts catalytically to suppress the activity of smoothened. Nature 418: 892–897 [DOI] [PubMed] [Google Scholar]
- Tang JJ, Li JG, Qi W, Qiu WW, Li PS, Li BL, Song BL (2011) Inhibition of SREBP by a small molecule, betulin, improves hyperlipidemia and insulin resistance and reduces atherosclerotic plaques. Cell Metab 13: 44–56 [DOI] [PubMed] [Google Scholar]
- Trinh MN, Brown MS, Seemann J, Vale G, McDonald JG, Goldstein JL, Lu F (2022) Interplay between Asters/GRAMD1s and phosphatidylserine in intermembrane transport of LDL cholesterol. Proc Natl Acad Sci USA 119: e2120411119 [DOI] [PMC free article] [PubMed] [Google Scholar]
- Varjosalo M, Taipale J (2007) Hedgehog signaling. J Cell Sci 120: 3–6 [DOI] [PubMed] [Google Scholar]
- Wang LJ, Wang J, Li N, Ge L, Li BL, Song BL (2011) Molecular characterization of the NPC1L1 variants identified from cholesterol low absorbers. J Biol Chem 286: 7397–7408 [DOI] [PMC free article] [PubMed] [Google Scholar]
- Wang JQ, Li LL, Hu A, Deng G, Wei J, Li YF, Liu YB, Lu XY, Qiu ZP, Shi XJ et al (2022) Inhibition of ASGR1 decreases lipid levels by promoting cholesterol excretion. Nature 608: 413–420 [DOI] [PubMed] [Google Scholar]
- Xiao X, Tang JJ, Peng C, Wang Y, Fu L, Qiu ZP, Xiong Y, Yang LF, Cui HW, He XL et al (2017) Cholesterol modification of smoothened is required for hedgehog signaling. Mol Cell 66: 154–162 [DOI] [PubMed] [Google Scholar]
- Xiao J, Luo J, Hu A, Xiao T, Li M, Kong Z, Jiang L, Zhou Z, Liao Y, Xie C et al (2019) Cholesterol transport through the peroxisome‐ER membrane contacts tethered by PI(4,5)P(2) and extended synaptotagmins. Sci China Life Sci 62: 1117–1135 [DOI] [PubMed] [Google Scholar]
- Xiao X, Kim Y, Romartinez‐Alonso B, Sirvydis K, Ory DS, Schwabe JWR, Jung ME, Tontonoz P (2021) Selective Aster inhibitors distinguish vesicular and nonvesicular sterol transport mechanisms. Proc Natl Acad Sci USA 118: e2024149118 [DOI] [PMC free article] [PubMed] [Google Scholar]
- Zhang XM, Ramalho‐Santos M, McMahon AP (2001) Smoothened mutants reveal redundant roles for Shh and Ihh signaling including regulation of L/R asymmetry by the mouse node. Cell 105: 781–792 [PubMed] [Google Scholar]
- Zhang C, Williams EH, Guo Y, Lum L, Beachy PA (2004) Extensive phosphorylation of smoothened in hedgehog pathway activation. Proc Natl Acad Sci USA 101: 17900–17907 [DOI] [PMC free article] [PubMed] [Google Scholar]
- Zhang Y, Bulkley DP, Xin Y, Roberts KJ, Asarnow DE, Sharma A, Myers BR, Cho W, Cheng Y, Beachy PA (2018) Structural basis for cholesterol transport‐like activity of the hedgehog receptor patched. Cell 175: 1352–1364 [DOI] [PMC free article] [PubMed] [Google Scholar]
- Zhao K, Ridgway ND (2017) Oxysterol‐binding protein‐related protein 1L regulates cholesterol egress from the Endo‐lysosomal system. Cell Rep 19: 1807–1818 [DOI] [PubMed] [Google Scholar]
- Zhao Y, Tong C, Jiang J (2007) Hedgehog regulates smoothened activity by inducing a conformational switch. Nature 450: 252–258 [DOI] [PubMed] [Google Scholar]