

Abstract
This study aimed to analyse cerebral grey matter changes in mild cognitive impairment (MCI) using voxel-based morphometry and to diagnose early Alzheimer's disease using deep learning methods based on convolutional neural networks (CNNs) evaluating these changes. Participants (111 MCI, 73 normal cognition) underwent 3-T structural magnetic resonance imaging. The obtained images were assessed using voxel-based morphometry, including extraction of cerebral grey matter, analyses of statistical differences, and correlation analyses between cerebral grey matter and clinical cognitive scores in MCI. The CNN-based deep learning method was used to extract features of cerebral grey matter images. Compared to subjects with normal cognition, participants with MCI had grey matter atrophy mainly in the entorhinal cortex, frontal cortex, and bilateral frontotemporal lobes (p < 0.0001). This atrophy was significantly correlated with the decline in cognitive scores (p < 0.01). The accuracy, sensitivity, and specificity of the CNN model for identifying participants with MCI were 80.9%, 88.9%, and 75%, respectively. The area under the curve of the model was 0.891. These findings demonstrate that research based on brain morphology can provide an effective way for the clinical, non-invasive, objective evaluation and identification of early Alzheimer's disease.
Keywords: cerebral grey matter, convolutional neural network, deep learning, mild cognitive impairment, voxel-based morphometry
Introduction
Alzheimer’s disease (AD), a progressive and irreversible disease characterized by memory loss and cognitive impairment, has become the most common neurodegenerative disorder. Recently, researchers have focused on the preclinical stage of AD based on its clinical symptoms and biological markers (Rathore et al. 2017; Jack Jr et al. 2018). Mild cognitive impairment (MCI), which is characterized by a slight but measurable cognitive decline and memory function impairment, has been considered the intermediate stage between physiological aging and AD (Lennart 2009). Studies have shown that the cognitive decline may start several years to decades before the clinical AD diagnosis, first as an asymptomatic period, then transforming into MCI (Petrella et al. 2003; Hinrichs et al. 2011). If a patient at the MCI stage could be recognized in time for interventions and treatments, the patient’s disease progression might be delayed or even prevented from advancing to the AD stage (Langa and Levine 2014).
During the past years, several neuroimaging biomarkers have been used to classify MCI and AD patients or to predict the conversion of patients with MCI (Suk et al. 2014; Moradi et al. 2015; Li et al. 2019). Structural magnetic resonance imaging (sMRI) is the extensive utilization of neuroimaging methods due to noninvasive techniques and high resolution. The features of brain atrophy can be directly observed and measured on sMRI, including ventricle enlargement (Nestor et al. 2008), hippocampal atrophy (Henneman et al. 2009), and gray matter (GM) loss. Thus, volumetric measures and morphometric patterns are potential features for the diagnosis of MCI and AD, as well as the prediction of conversion from MCI to AD (Liu et al. 2019; Wang et al. 2019).
Voxel-based morphometry (VBM) can analyze and evaluate the structural changes of brain regions in neurodegenerative diseases, such as dementia (Karas et al. 2004; Muñoz-Ruiz et al. 2012; Möller et al. 2016), Parkinson’s disease (Potgieser et al. 2014; Tessitore et al. 2016; Gao et al. 2017), and multiple sclerosis (Zhang et al. 2016). This method was first proposed and standard used by John Ashburner and his colleagues (Ashburner and Friston 2000). The size of each voxel of the segmented tissue automatically analyze by VBM is analyzed to identify volume differences indicative of GM atrophy or local changes in WM density. Therefore, VBM is not biased towards structural changes in a specific area of the brain, avoids subjective differences caused by artificially depicting regions of interest, and can objectively and comprehensively evaluate the anatomical changes of the entire brain. Even small brain volume or density changes in early AD can be visualized (Burton et al. 2004; Whitwell et al. 2007; Josephs et al. 2008; Serra et al. 2010; Chapleau et al. 2016; Matsuda 2016).
Based on the characteristics of cerebral GM changes, medical images contain a large amount of valuable information that reflects the development and progression of the disease. Advancements in data mining and machine learning make it possible to extract many quantitative features and convert medical images into minable data (Erickson et al. 2017; Rathore et al. 2017). Deep learning, as a branch of machine learning, has been widely used in the field of medical image research and has shown great potential (Hosny et al. 2018). The processing dimensionality of medical imaging is higher than that of other fields, which requires a more powerful model in terms of learning and adaptability. Thanks to its network architecture, deep learning can automatically extract and learn highly representative features from different medical image data and perform feature representations, thereby expressing the internal image information more objectively and explicitly. At present, machine learning and deep learning approaches are used for different MR-based tasks, such as deep learning frameworks for diagnostic AD classification (Ortiz et al. 2016; Luo et al. 2017), multipattern recognition of arterial spin labeling perfusion maps to classify patients with AD, MCI, and subjective cognitive decline (Collij et al. 2016; Lyduine et al. 2016), and hippocampal MRI data to accurately predict the progression of MCI to AD (Lin et al. 2018; Liu et al. 2020).
In this study, we focus on early AD stages, aiming to discover subtle differences in brain anatomy between subjects with normal aging but normal cognition and those with MCI using VBM-based processing and analysis techniques. We also propose a convolutional neural network (CNN) that can distinguish between normal aging and MCI based on GM images extracted by VBM from MR images.
Materials and methods
Study population
We enrolled 13 normal control (NC) participants and 17 individuals with MCI in this study. The MCI criteria included: (1) the preservation of the general cognitive function is determined by a clinician based on structured interviews with informants and patients, (2) no signs of dementia, (3) decline in episodic memory, defined as 1.5 standard deviations lower than the average of the control group (Jessen et al. 2014), (4) normal activities of daily living and normal general cognitive function in activities of daily living, and (5) no psychiatric or medical explanation for the diagnosed memory impairment. The criteria to include participants into the NC group were as follows: (1) no cognitive impairment, (2) no abnormalities on conventional brain MRI, (3) no neurological deficits, and (4) no physical, mental, or neurological disorders. The MCI and NC groups were recruited in our hospital from the Department of Neurological Clinic Service and the Medical Examination Center, respectively. Informed consent was obtained from all participants before MR examination according to the procedures approved by the local ethics committee.
Magnetic resonance imaging
MRI was performed using a 3.0-T scanner (Signa; General Electric Medical Systems) with an 8-channel standard head coil. The main MRI parameters of the 3D volume imaging sequence that covered the whole brain were repetition time (TR) = 6.8 ms, echo time (TE) = 2.5 ms, slice thickness = 1 mm with no intersection gap, matrix size = 512 × 512, and field of view = 160 × 160 mm.
Database
For this study, 94 subjects with MCI (60 early MCI and 34 late MCI) and 60 NC subjects were randomly selected from the Alzheimer’s Disease Neuroimaging Initiative (ADNI) database. This database was established in 2003 by the National Institute on Aging (NIA), the National Institute of Biomedical Imaging and Bioengineering (NIBIB), and a contribution from various pharmaceutical companies and foundations. The database is mainly aimed at different stages and subtypes of pathologies like MCI, AD, and vascular dementia, as well as healthy subjects, to compile their MRI, PET, functional MRI, and other biological data. Clinical markers and neuropsychological evaluation scores are integrated to determine sensitivity and specificity of early AD onset markers through imaging-omics. This database can help researchers and clinicians to develop new treatment methods and monitor treatment effects in patients with AD (Jack et al. 2010; Weiner et al. 2010; Wyman et al. 2013).
Image preprocessing
T1-weighted MR images of the brain were preprocessed using the VBM8 tool of the SPM8 software package (Wellcome Department of Imaging Neuroscience, London, United Kingdom) based on MATLAB R2012b (The MathWorks, Natick, MA, United States of America). First, the structural images were segmented into GM, WM, and cerebrospinal fluid images by using a unified segmentation procedure after image-intensity nonuniformity correction was performed. The segmented GM and WM images were then nonlinearly transformed using diffeomorphic anatomical registration (DARTEL) techniques. Subsequently, the images were modulated to create a modified template for DARTEL based on the MNI152 template provided by SPM8, followed by smoothing with an 8-mm full width at half maximum isotropic Gaussian kernel. The obtained GM images were analyzed using the SPM8 statistical software package, with age, sex, and total intracranial volume as covariates, to compare the differences between groups and to assess changes in brain structure corresponding to overall cognitive function (Fig. 1).
Fig. 1.

Flowchart depicting the VBM processing. The original T1-weighted magnetic resonance image was registered to the standard brain template for head movement correction and skull dissection. Then, GM segmentation was performed using the configured standard cerebral GM. After Gaussian smoothing, the final cerebral GM image was obtained. Abbreviations: GM, gray matter; VBM, voxel-based morphometry.
Deep learning
Additionally, we developed a 3D CNN-based deep learning architecture to recognize early AD using MR images. Image preprocessing included noise removal and normalization. The GM images of the 2 groups were repositioned and resampled to a resolution of 121 × 145 × 121, and a few abnormal points were excluded. The image values were proportionally distributed in the [0,1] space and flipped in the same direction. Thus, all GM images of the brain were registered in the same template space and had the same intensity range. The 3D CNN network had 4 convolutional layers and 4 pooling layers. The size of the first pooling layer was 5 × 5, whereas the sizes of the other 3 layers were 3 × 3. The sizes of the 4 convolutional layers were 2 × 2, and the first convolution layer generated 64 images with a feature size of 117 × 141 × 117. After pooling, the 64 feature images were sampled to 58 × 70 × 58. Finally, a 5 × 7 × 5 feature vector was generated through three convolutional layers and a pooling layer. The feature vector was sent to the completely connected layer and softmax layer for classification, and dropout was used in this layer to better fit the image features (Fig. 2).
Fig. 2.

The convolutional neural network architecture. Abbreviations: MCI, mild cognitive impairment; NC, normal control.
Statistical analysis
All data are presented as the mean ± standard deviation. The two-sample t-test was applied to comparisons between the NC and MCI groups because all samples had a normal distribution. We used Pearson’s χ2-test to compare the sex distribution between the 2 groups. P < 0.05 was considered a statistically significant difference. Statistical analyses were performed using SPSS 20.0.
The SPM8 T-map was obtained using a threshold for statistical significance of GM volume changes with a false discovery rate of P = 0.01 and family-wise error of P = 0.05. After correction with AlphaSim, brain regions with P < 0.05 and clusters larger than 100 voxels were considered significantly different. Using the same correction method, the correlation analysis between Gaussian-smoothed cerebral GM images and Mini-Mental State Examination (MMSE) scores was performed to obtain a statistical difference map and evaluate the changes in cerebral GM structure corresponding to the overall cognitive function. The statistically significant brain areas, center coordinates (MNI coordinates), and peak intensities were recorded. Finally, the xjView toolkit was used to visualize the results.
Results
Participants
Baseline demographic and clinical characteristics of the MCI and NC groups are presented in Table 1. Significant differences between the study groups were found in mean age (P < 0.05), MMSE score (P < 0.01), and Montreal Cognitive Assessment (MoCA) score (P < 0.01). As can be expected, median MMSE and MoCA scores were higher in NC subjects compared to those in patients with MCI.
Table 1.
Demographic characteristics of the MCI and NC groups.
| MCI | NC | P value | |
|---|---|---|---|
| Number | 73 | 111 | - |
| Male/female | 35/38 | 58/53 | 0.883 |
| Age (year) | 68.76 ± 6.62 | 69.60 ± 6.94 | 0.514 |
| MMSE (score) | 20.76 ± 6.17 | 27.23 ± 1.74 | <0.01 |
| MoCA (score) | 16.12 ± 6.96 | 25.08 ± 3.20 | <0.01 |
Abbreviations: MCI, mild cognitive impairment; MMSE, Mini-Mental State Examination; MoCA, Montreal Cognitive Assessment; NC, normal control.
VBM: comparison of GM volumes between MCI and NC participants
To correct for cluster size, we used the AlphaSim application (implemented in REST 1.8) with P < 0.0001 (corrected, voxel-level). Compared to the NC group, patients of the MCI group showed GM atrophy in the left parahippocampal gyrus, inferior temporal gyrus, middle temporal gyrus, medial frontal gyrus, inferior frontal gyrus, postcentral gyrus, medial frontal gyrus, Frontal_Inf_Tri_L (aal), and Parietal_Inf_L (aal), as well as the right sublobar, superior temporal gyrus, and Frontal_Sup_Medial_R (aal) (Table 2, Fig. 3).
Table 2.
Anatomic locations of areas showing significant gray matter differences between MCI and normal control participants (FDR = 0.01, FEW = 0.05 corrected).
| Brain region | Side | Talairach coordinates | P value | Peak intensity | Z score | ||
|---|---|---|---|---|---|---|---|
| X | Y | Z | |||||
| Parahippocampal gyrus | Left | −13.5 | −36 | −1.5 | <0.0001 | 8.5237 | 7.78 |
| Temporal_Inf_L (aal) | Left | −52.5 | −19.5 | −25.5 | <0.0001 | 6.3737 | 6.04 |
| Middle temporal gyrus | Left | −51 | −51 | −13.5 | <0.0001 | 7.2746 | 6.80 |
| Sub-lobar | Right | 30 | 9 | −10.5 | <0.0001 | 8.1034 | 7.47 |
| Frontal_Sup_Medial_R (aal) | Right | 6 | 60 | 4.5 | <0.0001 | 6.1283 | 5.83 |
| Medial frontal gyrus | Left | −6 | 60 | 7.5 | <0.0001 | 6.7069 | 6.33 |
| Superior temporal gyrus | Right | 54 | −52.5 | 18 | <0.0001 | 6.587 | 6.22 |
| Inferior frontal gyrus | Left | −46.5 | 6 | 27 | <0.0001 | 6.8632 | 6.46 |
| Frontal_Inf_Tri_L (aal) | Left | −40.5 | 34.5 | 16.5 | <0.0001 | 6.8677 | 6.46 |
| Postcentral gyrus | Left | −54 | −24 | 15 | <0.0001 | 5.7569 | 5.51 |
| Parietal_Inf_L (aal) | Left | −46.5 | −45 | 45 | <0.0001 | 6.2427 | 6.51 |
| Medial frontal gyrus | Left | 28.5 | 9 | 54 | <0.0001 | 5.8299 | 5.57 |
Abbreviations: FDR, false discovery rate; FEW, family-wise error; MCI, mild cognitive impairment.
Fig. 3.

Comparison of GM volumes between patients with MCI and NC participants (transverse plane). Significant changes (P < 0.0001) are indicated as colored brain areas where GM atrophy of the MCI group exceeds that of the NC group. Abbreviations: GM, gray matter; MCI, mild cognitive impairment; NC, normal control.
GM volume changes related to MMSE scores in MCI
Regarding GM volume changes, brain regions showing a significant correlation with the decline in MMSE score mainly included the left parahippocampal gyrus, inferior temporal gyrus, middle temporal gyrus, inferior frontal gyrus, and inferior parietal edge of the angular gyrus, as well as the right putamen and superior temporal gyrus (P < 0.01; Table 3, Fig. 4).
Table 3.
Anatomic locations of areas showing significant correlations between gray matter atrophy and MMSE performance decline in patients with MCI (FDR = 0.01, FEW = 0.05 corrected). Abbreviations: FDR, false discovery rate; FEW, family-wise error; MCI, mild cognitive impairment; MMSE, mini-mental state examination.
| Brain region | Side | Talairach coordinates | P value | Peak intensity | Z score | ||
|---|---|---|---|---|---|---|---|
| X | Y | Z | |||||
| Parahippocampal gyrus | Left | −15 | −5 | −38 | <0.01 | 5.9253 | 5.59 |
| Putamen | Right | −31 | −31 | −42 | <0.01 | 7.7716 | 7.07 |
| Inferior temporal gyrus | Left | 26 | 65 | −11 | <0.01 | 6.7818 | 6.29 |
| Middle temporal gyrus | Left | −2 | 34 | −30 | <0.01 | 7.3907 | 6.78 |
| Superior temporal gyrus | Right | 3 | −62 | 68 | <0.01 | 6.2792 | 5.88 |
| Inferior frontal gyrus | Left | −40 | −43 | 18 | <0.01 | 6.9193 | 6.40 |
| Inferior parietal edge angular gyrus | Left | −15 | −5 | −38 | <0.01 | 6.771 | 6.28 |
Fig. 4.

GM volume changes related to MMSE scores in patients with MCI (transverse plane). Significant correlations (P < 0.01) between MCI atrophy and MMSE score are indicated as colored brain areas. Abbreviations: GM, gray matter; MCI, mild cognitive impairment; MMSE, mini-mental state examination.
Deep learning
In the training data set, the accuracy of the CNN-based deep learning model to identify changes in the cerebral GM of participants with MCI was 97.8%. Thus, the model was used to classify images of the verification data set. The accuracy of the CNN model with the verification data set was 96.0%. In the test set, the accuracy of the model to identify changes in the cerebral GM of participants with MCI was 80.9%, and the sensitivity and specificity were 88.9% and 75.0%, respectively. The area under the receiver operating characteristics curve was 0.891 (Figs. 5 and 6).
Fig. 5.

The solid lines represented the accuracy of the CNN-based deep learning model for training and validation sets. The dotted line in the background represented the curve fitted by the model during the training and validation data set. Abbreviations: CNN, convolutional neural network.
Fig. 6.
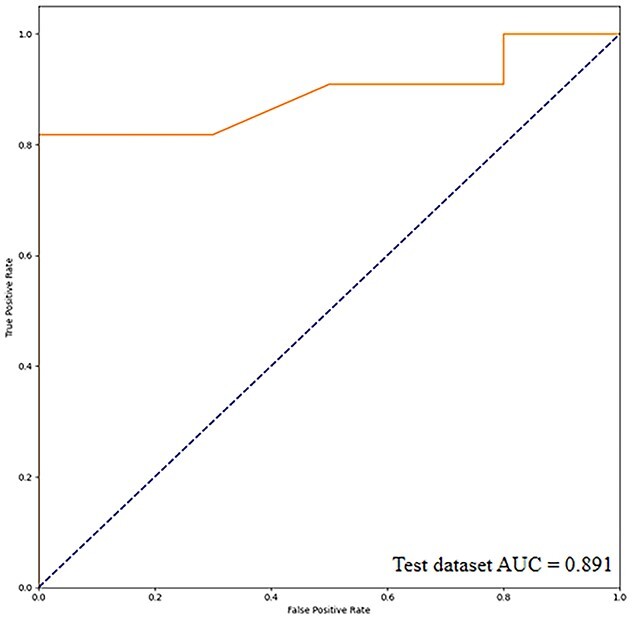
ROC curve of the deep learning model. The solid line represents the ROC curve of the test data set. Abbreviations: AUC, area under the curve; CNN, convolutional neural network; ROC, receiver operating characteristics.
Discussion
To study AD-related changes in the brain, researchers used the VBM method to analyze changes in the GM of patients with AD in different populations, at different stages of onset, and with different pathogenetic mechanisms (Burton et al. 2004; Josephs et al. 2008; Lee et al. 2010). When comparing GM changes between patients with AD and cognitively healthy people, morphological alterations in the AD population mainly comprised atrophy of the medial temporal lobe, including the hippocampus (Rombouts et al. 2000; Baron et al. 2001; Hirao et al. 2006), entorhinal cortex (Frisoni et al. 2005; Ishii, Kawachi, et al. 2005a; Di Paola et al. 2007), and amygdala (Shiino et al. 2006; Whitwell et al. 2007). These findings are consistent with the clinical symptoms of memory dysfunction in this population (Ishii, Sasaki, et al. 2005b; Kinkingnéhun et al. 2008). Some researchers examined the differences in GM atrophy between early-onset and late-onset AD. Compared to subjects with early-onset AD, the hippocampus, temporoparietal cortex, and precuneus of early-onset AD patients showed GM atrophy, while those with late-onset AD also experienced the same. It affected most areas of the temporal lobe, and the degree of atrophy in the brain area of memory function, especially the hippocampus and entorhinal cortex area were more obvious than that of early onset (Frisoni et al. 2005). Some researchers also suggest that in the late-onset AD population, GM atrophy only occurs in the bilateral hippocampus, and the younger the onset age, the lower the GM density of the precuneus (Karas et al. 2007).
In this study, we focused on MCI because patients at this stage still have no memory impairment and their changes in MR images of the brain are basically the same as those found in the general population. Moreover, the use of VBM to examine changes in the cerebral GM of aged but cognitively normal subjects and individuals with MCI was less researched. The visualization of statistical difference maps demonstrated that subjects with MCI had distinct changes in the cerebral GM, such as the atrophy of the parahippocampal gyrus, a region of the entorhinal cortex. This result is consistent with pathological changes in AD stages III-IV (Braak and Braak 1995; Matsuda 2016).
We also observed that patients with MCI presented atrophy of the cerebral cortex and subcortical structures prior to cognitive impairment. The temporal lobe is closely related to learning and memory. Atrophy in the temporal lobe of the dominant hemisphere may cause impairments of language and memory functions. When the atrophy affects also the nondominant temporal lobe, the ability to delay memory will be further reduced, affecting the brain’s coordinated response to spatial positioning. We also found that the brain area in the left hemisphere of participants with MCI showed significantly more atrophy than the right hemisphere, which is related to the function of the dominant hemisphere.
In patients with MCI, morphological changes related to overall cognition are mainly located in the subcortical area and entorhinal cortex, especially the parahippocampal gyrus (Pinto et al. 2019). This study showed that patients with lower scores tended to be affected by severer atrophy, especially in brain regions related to memory function, which may be related to the pathological mechanism of cognitive impairment in these patients.
sMRI can visualize the brain atrophy of people with dementia, which manifests as the reduction in cerebral GM, and the functional performance is in early-stage dementia related to neuropathological changes, such as neuronal damage and degeneration (Jack et al. 2013). The composition of the human cerebral GM plays an important role in behavioral responses such as memory (Graybiel 2000), cognition (Babikian et al. 1990), and sensorimotor function (Grahn et al. 2008), making the evaluation of GM changes in MCI populations useful.
Consequently, a deep learning CNN was trained in this study to extract GM features and learn from the extracted image features to distinguish patients with MCI from a normal cognitive population with good results. To improve our data set, we added images from a public data set based on the sample size of the enrolled participants. To increase the data volume of the sample, the T1-weighted MR images were registered into a common anatomical space through linear and nonlinear transformations, eliminating differences between individuals with varying brain sizes and shapes. In the CNN model, we appropriately used 4 convolutional layers and 4 pooling layers to extract the feature vector of brain gray matter, and added more nonlinear information to make the network have stronger fitting ability. Each convolutional layer was applied to the input image and detected the extracted gray matter image features. Each pooling layer reduced the spatial dimension of the convolved image and the computational complexity of the network to controls overfitting. After pooling, the size of the feature images would gradually decrease, but the image feature information contained in each pooling layer would be more and more accurate than the previous pooling layer, so the obtained feature vector would be sent to the complete connection layer and softmax layer for classification. Further, since the subjects collected in the experiment came from 2 data sets, the weights of each layer were updated in each training, and the validation set was appropriately used to find the best model for the model on the basis of controlling data overfitting. The optimal parameters improved the model stability. For example, Zhao et al. (2020) collected T1-weighted brain images of normal cognitive, MCI, and AD subjects obtained from 6 different MR scanners and public ADNI data sets to apply the modified segmentation method based on local label learning. The regions of interest were selected in the bilateral hippocampi, and other clinical parameters were added. Finally, a multivariate-based SVM classifier was used to categorize the images and predict the levels of the 3 study groups (Zhao et al. 2020). In particular, characteristic hippocampus changes have a certain clinical value as a biomarker to predict early AD transformation (Huang et al. 2019; Spasov et al. 2019; Liu et al. 2020). Li et al. (2019) used hippocampal changes over a 3-year period to establish a time-to-event model based on deep learning that identified people with MCI at a high risk of developing dementia. Given that the MCI population has a higher risk of developing dementia every year, we strived in our study to discriminate patients with MCI from aged but cognitively normal subjects before they had cognitive impairment or mild memory impairment.
Some researchers divide MCI into early- and late-onset groups, and the area of interest selects the GM of the brain. The difference is that the authors divided the 3D GM image into 2D planes, then conducted deep learning according to the standard anatomical orientation (Gorji and Kaabouch 2019). Considering that 3D continuous MR images are used in clinical practice, we did not perform plane cutting, which was conducive to deep learning methods that can continuously extract features from GM images with zero spacing. Moreover, we used VBM to segment the GM of the brain before using the CNN to identify early AD. The deep learning method eliminated a small number of abnormal image points, and the GM images from both data sets were placed in the same template space, reducing differences between brains and ensuring the same intensity range of images. From the perspective of brain GM changes in the onset of MCI, good accuracy was achieved in the test set of MCI subjects with its own data set, so that early AD could be identified and achieved good results. Our results demonstrate that research based on brain morphology can provide effective tools for the clinical, noninvasive, objective evaluation, and identification of individuals with MCI.
This study has some limitations. First, it was difficult to clinically identify patients with MCI. Although sufficient MCI samples were obtained from the ADNI database, limitations of our corresponding collection need to be considered. Second, according to the time of MCI onset, some of the enrolled participants with MCI may have already been in the late-onset stage. We did not distinguish between early and late stages of MCI onset and disease progression. Third, to identify MCI in the normal aging population based on GM changes, we used a deep neural network to evaluate the generalization of the model without evaluating it with other deep learning models.
In conclusion, VBM, used as an analysis method for morphological changes in neurological diseases, can facilitate the evaluation of altered brain structures related to memory and cognitive impairment in early AD. Furthermore, a newly developed deep learning CNN had good accuracy in identifying patients with MCI based on cerebral GM changes. The evaluation of brain structures is an effective tool to noninvasively and objectively assess and identify patients with early stages of AD.
Supplementary Material
Acknowledgments
We wish to thank the participants and their families for their contribution to our research.
Contributor Information
Huaidong Huang, Department of Medical Imaging, The 2nd Affiliated Hospital, Medical College of Shantou University, No. 69, Dongxia North Road, Jinping District, Shantou 515041, China.
Shiqiang Zheng, Department of Computer Science, Shantou University, No. 243, Daxue Road, Jinping District, Shantou 515063, China.
Zhongxian Yang, Medical Imaging Center, Shenzhen Hospital, Southern Medical University, No. 1333, Xinhu Road, Bao'an District, Shenzhen 518000, China.
Yi Wu, Department of Neurology, Shantou Central Hospital and Affiliated Shantou Hospital of Sun Yat-Sen University, No. 114, Waima Road, Jinping District, Shantou 515041, China.
Yan Li, Department of Medical Imaging, The 2nd Affiliated Hospital, Medical College of Shantou University, No. 69, Dongxia North Road, Jinping District, Shantou 515041, China.
Jinming Qiu, Department of Medical Imaging, The 2nd Affiliated Hospital, Medical College of Shantou University, No. 69, Dongxia North Road, Jinping District, Shantou 515041, China.
Yan Cheng, Department of Medical Imaging, The 2nd Affiliated Hospital, Medical College of Shantou University, No. 69, Dongxia North Road, Jinping District, Shantou 515041, China.
Panpan Lin, School of Clinical Medicine, Quanzhou Medical College, No. 2, Anji Road, Luojiang District, Quanzhou 362000, China.
Yan Lin, Department of Medical Imaging, The 2nd Affiliated Hospital, Medical College of Shantou University, No. 69, Dongxia North Road, Jinping District, Shantou 515041, China.
Jitian Guan, Department of Medical Imaging, The 2nd Affiliated Hospital, Medical College of Shantou University, No. 69, Dongxia North Road, Jinping District, Shantou 515041, China.
David John Mikulis, Division of Neuroradiology, Department of Medical Imaging, University of Toronto, University Health Network, Toronto Western Hospital, 399 Bathurst Street, Toronto, Ontario M5T 2S7, Canada.
Teng Zhou, Department of Computer Science, Shantou University, No. 243, Daxue Road, Jinping District, Shantou 515063, China.
Renhua Wu, Department of Medical Imaging, The 2nd Affiliated Hospital, Medical College of Shantou University, No. 69, Dongxia North Road, Jinping District, Shantou 515041, China.
Funding
This work was supported by the Natural Science Foundation of China (Grant Nos 82020108016, 31870981, 61902232), the 2020 Li Ka Shing Foundation Cross Disciplinary Research (Grant Nos 2020LKSFBME06, 2020LKSFG05D), and the Grant for Key Disciplinary Project of Clinical Medicine under the Guangdong High-Level University Development Program (002-18120302).
Conflict of interest statement. None declared.
References
- Ashburner J, Friston KJ. Voxel-based morphometry--the methods. NeuroImage. 2000:11(6 Pt 1):805–821. [DOI] [PubMed] [Google Scholar]
- Babikian VL, Wolfe N, Linn R, Knoefel JE, Albert ML. Cognitive changes in patients with multiple cerebral infarcts. Stroke. 1990:21(7):1013–1018. [DOI] [PubMed] [Google Scholar]
- Baron JC, Chételat G, Desgranges B, Perchey G, Landeau B, de la Sayette V, Eustache F. In vivo mapping of gray matter loss with voxel-based morphometry in mild Alzheimer's disease. NeuroImage. 2001:14(2):298–309. [DOI] [PubMed] [Google Scholar]
- Braak H, Braak E. Staging of Alzheimer's disease-related neurofibrillary changes. Neurobiol Aging. 1995:16(3):271–278. [DOI] [PubMed] [Google Scholar]
- Burton EJ, McKeith IG, Burn DJ, Williams ED, O'Brien JT. Cerebral atrophy in Parkinson's disease with and without dementia: a comparison with Alzheimer's disease, dementia with Lewy bodies and controls. Brain. 2004:127(Pt 4):791–800. [DOI] [PubMed] [Google Scholar]
- Chapleau M, Aldebert J, Montembeault M, Brambati SM. Atrophy in Alzheimer's disease and semantic dementia: an ALE meta-analysis of voxel-based morphometry studies. J Alzheimers Dis. 2016:54(3):941–955. [DOI] [PubMed] [Google Scholar]
- Collij LE, Heeman F, Kuijer JP, Ossenkoppele R, Benedictus MR, Möller C, Verfaillie SC, Sanz-Arigita EJ, van Berckel BN, van der Flier WM, et al. Application of machine learning to arterial spin labeling in mild cognitive impairment and Alzheimer disease. Radiology. 2016:281(3):865–875. [DOI] [PubMed] [Google Scholar]
- Di Paola M, Macaluso E, Carlesimo GA, Tomaiuolo F, Worsley KJ, Fadda L, Caltagirone C. Episodic memory impairment in patients with Alzheimer's disease is correlated with entorhinal cortex atrophy. A voxel-based morphometry study. J Neurol. 2007:254(6):774–781. [DOI] [PubMed] [Google Scholar]
- Erickson BJ, Korfiatis P, Akkus Z, Kline TL. Machine learning for medical imaging. Radiographics. 2017:37(2):505–515. [DOI] [PMC free article] [PubMed] [Google Scholar]
- Frisoni GB, Testa C, Sabattoli F, Beltramello A, Soininen H, Laakso MP. Structural correlates of early and late onset Alzheimer's disease: voxel based morphometric study. J Neurol Neurosurg Psychiatry. 2005:76(1):112–114. [DOI] [PMC free article] [PubMed] [Google Scholar]
- Gao Y, Nie K, Huang B, Mei M, Guo M, Xie S, Huang Z, Wang L, Zhao J, Zhang Y, et al. Changes of brain structure in Parkinson's disease patients with mild cognitive impairment analyzed via VBM technology. Neurosci Lett. 2017:658:121–132. [DOI] [PubMed] [Google Scholar]
- Gorji HT, Kaabouch N. A deep learning approach for diagnosis of mild cognitive impairment based on MRI images. Brain Sci. 2019:9(9):E217. [DOI] [PMC free article] [PubMed] [Google Scholar]
- Grahn JA, Parkinson JA, Owen AM. The cognitive functions of the caudate nucleus. Prog Neurobiol. 2008:86(3):141–155. [DOI] [PubMed] [Google Scholar]
- Graybiel AM. The basal ganglia. Curr Biol. 2000:10(14):R509–R511. [DOI] [PubMed] [Google Scholar]
- Henneman WJ, Sluimer JD, Barnes J, van der Flier WM, Sluimer IC, Fox NC, Scheltens P, Vrenken H, Barkhof F. Hippocampal atrophy rates in Alzheimer disease: added value over whole brain volume measures. Neurology. 2009:72(11):999–1007. [DOI] [PMC free article] [PubMed] [Google Scholar]
- Hinrichs C, Singh V, Xu G, Johnson SC. Predictive markers for AD in a multi-modality framework: an analysis of MCI progression in the ADNI population. NeuroImage. 2011:55(2):574–589. [DOI] [PMC free article] [PubMed] [Google Scholar]
- Hirao K, Ohnishi T, Matsuda H, Nemoto K, Hirata Y, Yamashita F, Asada T, Iwamoto T. Functional interactions between entorhinal cortex and posterior cingulate cortex at the very early stage of Alzheimer's disease using brain perfusion single-photon emission computed tomography. Nucl Med Commun. 2006:27(2):151–156. [DOI] [PubMed] [Google Scholar]
- Hosny A, Parmar C, Quackenbush J, Schwartz LH, Aerts HJWL. Artificial intelligence in radiology. Nat Rev Cancer. 2018:18(8):500–510. [DOI] [PMC free article] [PubMed] [Google Scholar]
- Huang Y, Xu J, Zhou Y, Tong T, Zhuang X. Diagnosis of Alzheimer's disease via multi-modality 3D convolutional neural network. Front Neurosci. 2019:13:509. [DOI] [PMC free article] [PubMed] [Google Scholar]
- Ishii K, Kawachi T, Sasaki H, Kono AK, Fukuda T, Kojima Y, Mori E. Voxel-based morphometric comparison between early- and late-onset mild Alzheimer's disease and assessment of diagnostic performance of Z score images. AJNR Am J Neuroradiol. 2005a:26(2):333–340. [PMC free article] [PubMed] [Google Scholar]
- Ishii K, Sasaki H, Kono AK, Miyamoto N, Fukuda T, Mori E. Comparison of gray matter and metabolic reduction in mild Alzheimer's disease using FDG-PET and voxel-based morphometric MR studies. Eur J Nucl Med Mol Imaging. 2005b:32(8):959–963. [DOI] [PubMed] [Google Scholar]
- Jack CR Jr, Bernstein MA, Borowski BJ, Gunter JL, Fox NC, Thompson PM, Schuff N, Krueger G, Killiany RJ, Decarli CS, et al. Update on the magnetic resonance imaging core of the Alzheimer's disease neuroimaging initiative. Alzheimers Dement. 2010:6(3):212–220. [DOI] [PMC free article] [PubMed] [Google Scholar]
- Jack CR Jr, Knopman DS, Jagust WJ, Petersen RC, Weiner MW, Aisen PS, Shaw LM, Vemuri P, Wiste HJ, Weigand SD, et al. Tracking pathophysiological processes in Alzheimer's disease: an updated hypothetical model of dynamic biomarkers. Lancet Neurol. 2013:12(2):207–216. [DOI] [PMC free article] [PubMed] [Google Scholar]
- Jack CR Jr, Bennett DA, Blennow K, Carrillo MC, Dunn B, Haeberlein SB, Holtzman DM, Jagust W, Jessen F, Karlawish J, et al. NIA-AA research framework: toward a biological definition of Alzheimer's disease. Alzheimers Dement. 2018:14(4):535–562. [DOI] [PMC free article] [PubMed] [Google Scholar]
- Jessen F, Wolfsgruber S, Wiese B, Bickel H, Mösch E, Kaduszkiewicz H, Pentzek M, Riedel-Heller SG, Luck T, Fuchs A, et al. AD dementia risk in late MCI, in early MCI, and in subjective memory impairment. Alzheimers Dement. 2014:10(1):76–83. [DOI] [PubMed] [Google Scholar]
- Josephs KA, Whitwell JL, Duffy JR, Vanvoorst WA, Strand EA, Hu WT, Boeve BF, Graff-Radford NR, Parisi JE, Knopman DS, et al. Progressive aphasia secondary to Alzheimer disease vs FTLD pathology. Neurology. 2008:70(1):25–34. [DOI] [PMC free article] [PubMed] [Google Scholar]
- Karas GB, Scheltens P, Rombouts SA, Visser PJ, van Schijndel RA, Fox NC, Barkhof F. Global and local gray matter loss in mild cognitive impairment and Alzheimer's disease. NeuroImage. 2004:23(2):708–716. [DOI] [PubMed] [Google Scholar]
- Karas G, Scheltens P, Rombouts S, van Schijndel R, Klein M, Jones B, van der Flier W, Vrenken H, Barkhof F. Precuneus atrophy in early-onset Alzheimer's disease: a morphometric structural MRI study. Neuroradiology. 2007:49(12):967–976. [DOI] [PubMed] [Google Scholar]
- Kinkingnéhun S, Sarazin M, Lehéricy S, Guichart-Gomez E, Hergueta T, Dubois B. VBM anticipates the rate of progression of Alzheimer disease: a 3-year longitudinal study. Neurology. 2008:70(23):2201–2211. [DOI] [PubMed] [Google Scholar]
- Langa KM, Levine DA. The diagnosis and management of mild cognitive impairment: a clinical review. JAMA. 2014:312(23):2551–2561. [DOI] [PMC free article] [PubMed] [Google Scholar]
- Lee JE, Park B, Song SK, Sohn YH, Park HJ, Lee PH. A comparison of gray and white matter density in patients with Parkinson's disease dementia and dementia with Lewy bodies using voxel-based morphometry. Mov Disord. 2010:25(1):28–34. [DOI] [PubMed] [Google Scholar]
- Lennart M. Neuroscience: Alzheimer's disease. Nature. 2009:461(7266):895–897. [DOI] [PubMed] [Google Scholar]
- Li H, Habes M, Wolk DA, Fan Y. A deep learning model for early prediction of Alzheimer's disease dementia based on hippocampal magnetic resonance imaging data. Alzheimers Dement. 2019:15(8):1059–1070. [DOI] [PMC free article] [PubMed] [Google Scholar]
- Lin W, Tong T, Gao Q, Guo D, Du X, Yang Y, Guo G, Xiao M, Du M, Qu X. Convolutional neural networks-based MRI image analysis for the Alzheimer's disease prediction from mild cognitive impairment. Front Neurosci. 2018:12:777. [DOI] [PMC free article] [PubMed] [Google Scholar]
- Liu CF, Padhy S, Ramachandran S, Wang VX, Efimov A, Bernal A, Shi L, Vaillant M, Ratnanather JT, Faria AV, et al. Using deep Siamese neural networks for detection of brain asymmetries associated with Alzheimer's disease and mild cognitive impairment. Magn Reson Imaging. 2019:64:190–199. [DOI] [PMC free article] [PubMed] [Google Scholar]
- Liu M, Li F, Yan H, Wang K, Ma Y, Shen L, Xu M. A multi-model deep convolutional neural network for automatic hippocampus segmentation and classification in Alzheimer's disease. NeuroImage. 2020:208:116459. [DOI] [PubMed] [Google Scholar]
- Luo S, Li X, Li J. Automatic Alzheimer’s disease recognition from MRI data using deep learning method. J Appl Math Phys. 2017:05:1892–1898. [Google Scholar]
- Lyduine EC, Fiona H, Joost K, Rik O, Marije B, Christiane M, Sander V, Ernesto S, Bart B, Wiesje F, Philip S, Frederik B, Alle W. Application of Machine Learning to Arterial Spin Labeling in Mild Cognitive Impairment and Alzheimer Disease. Radiology. 2016:281(3):865–875. [DOI] [PubMed] [Google Scholar]
- Matsuda H. MRI morphometry in Alzheimer's disease. Ageing Res Rev. 2016:30:17–24. [DOI] [PubMed] [Google Scholar]
- Möller C, Hafkemeijer A, Pijnenburg YAL, Rombouts SARB, van der Grond J, Dopper E, van Swieten J, Versteeg A, Steenwijk MD, Barkhof F, et al. Different patterns of cortical gray matter loss over time in behavioral variant frontotemporal dementia and Alzheimer's disease. Neurobiol Aging. 2016:38:21–31. [DOI] [PubMed] [Google Scholar]
- Moradi E, Pepe A, Gaser C, Huttunen H, Tohka J, Alzheimer's Disease Neuroimaging Initiative . Machine learning framework for early MRI-based Alzheimer's conversion prediction in MCI subjects. NeuroImage. 2015:104:398–412. [DOI] [PMC free article] [PubMed] [Google Scholar]
- Muñoz-Ruiz MÁ, Hartikainen P, Koikkalainen J, Wolz R, Julkunen V, Niskanen E, Herukka SK, Kivipelto M, Vanninen R, Rueckert D, et al. Structural MRI in frontotemporal dementia: comparisons between hippocampal volumetry, tensor-based morphometry and voxel-based morphometry. PLoS One. 2012:7(12):e52531. [DOI] [PMC free article] [PubMed] [Google Scholar]
- Nestor SM, Rupsingh R, Borrie M, Smith M, Accomazzi V, Wells JL, Fogarty J, Bartha R. Ventricular enlargement as a possible measure of Alzheimer's disease progression validated using the Alzheimer's disease neuroimaging initiative database. Brain. 2008:131(Pt 9):2443–2454. [DOI] [PMC free article] [PubMed] [Google Scholar]
- Ortiz A, Munilla J, Górriz JM, Ramírez J. Ensembles of deep learning architectures for the early diagnosis of the Alzheimer's disease. Int J Neural Syst. 2016:26(7):1650025. [DOI] [PubMed] [Google Scholar]
- Petrella JR, Coleman RE, Doraiswamy PM. Neuroimaging and early diagnosis of Alzheimer disease: a look to the future. Radiology. 2003:226(2):315–336. [DOI] [PubMed] [Google Scholar]
- Pinto TCC, Machado L, Bulgacov TM, Rodrigues-Júnior AL, Costa MLG, Ximenes RCC, Sougey EB. Is the Montreal cognitive assessment (MoCA) screening superior to the mini-mental state examination (MMSE) in the detection of mild cognitive impairment (MCI) and Alzheimer's disease (AD) in the elderly? Int Psychogeriatr. 2019:31(4):491–504. [DOI] [PubMed] [Google Scholar]
- Potgieser AR, van der Hoorn A, Meppelink AM, Teune LK, Koerts J, de Jong BM. Anterior temporal atrophy and posterior progression in patients with Parkinson's disease. Neurodegener Dis. 2014:14(3):125–132. [DOI] [PubMed] [Google Scholar]
- Rathore S, Habes M, Iftikhar MA, Shacklett A, Davatzikos C. A review on neuroimaging-based classification studies and associated feature extraction methods for Alzheimer's disease and its prodromal stages. NeuroImage. 2017:155:530–548. [DOI] [PMC free article] [PubMed] [Google Scholar]
- Rombouts SA, Barkhof F, Witter MP, Scheltens P. Unbiased whole-brain analysis of gray matter loss in Alzheimer's disease. Neurosci Lett. 2000:285(3):231–233. [DOI] [PubMed] [Google Scholar]
- Serra L, Cercignani M, Lenzi D, Perri R, Fadda L, Caltagirone C, Macaluso E, Bozzali M. Grey and white matter changes at different stages of Alzheimer's disease. J Alzheimers Dis. 2010:19(1):147–159. [DOI] [PubMed] [Google Scholar]
- Shiino A, Watanabe T, Maeda K, Kotani E, Akiguchi I, Matsuda M. Four subgroups of Alzheimer's disease based on patterns of atrophy using VBM and a unique pattern for early onset disease. NeuroImage. 2006:33(1):17–26. [DOI] [PubMed] [Google Scholar]
- Spasov S, Passamonti L, Duggento A, Liò P, Toschi N. A parameter-efficient deep learning approach to predict conversion from mild cognitive impairment to Alzheimer's disease. NeuroImage. 2019:189:276–287. [DOI] [PubMed] [Google Scholar]
- Suk HI, Lee SW, Shen D. Hierarchical feature representation and multimodal fusion with deep learning for AD/MCI diagnosis. NeuroImage. 2014:101:569–582. [DOI] [PMC free article] [PubMed] [Google Scholar]
- Tessitore A, Santangelo G, De Micco R, Vitale C, Giordano A, Raimo S, Corbo D, Amboni M, Barone P, Tedeschi G. Cortical thickness changes in patients with Parkinson's disease and impulse control disorders. Parkinsonism Relat Disord. 2016:24:119–125. [DOI] [PubMed] [Google Scholar]
- Wang Y, Xu C, Park JH, Lee S, Stern Y, Yoo S, Kim JH, Kim HS, Cha J. Diagnosis and prognosis of Alzheimer's disease using brain morphometry and white matter connectomes. Neuroimage Clin. 2019:23:101859. [DOI] [PMC free article] [PubMed] [Google Scholar]
- Weiner MW, Aisen PS, Jack CR Jr, Jagust WJ, Trojanowski JQ, Shaw L, Saykin AJ, Morris JC, Cairns N, Beckett LA, et al. The Alzheimer's disease neuroimaging initiative: progress report and future plans. Alzheimers Dement. 2010:6(3):202, e7–211. [DOI] [PMC free article] [PubMed] [Google Scholar]
- Whitwell JL, Weigand SD, Shiung MM, Boeve BF, Ferman TJ, Smith GE, Knopman DS, Petersen RC, Benarroch EE, Josephs KA, et al. Focal atrophy in dementia with Lewy bodies on MRI: a distinct pattern from Alzheimer's disease. Brain. 2007:130(Pt 3):708–719. [DOI] [PMC free article] [PubMed] [Google Scholar]
- Wyman BT, Harvey DJ, Crawford K, Bernstein MA, Carmichael O, Cole PE, Crane PK, DeCarli C, Fox NC, Gunter JL, et al. Standardization of analysis sets for reporting results from ADNI MRI data. Alzheimers Dement. 2013:9(3):332–337. [DOI] [PMC free article] [PubMed] [Google Scholar]
- Zhang X, Zhang F, Huang D, Wu L, Ma L, Liu H, Zhao Y, Yu S, Shi J. Contribution of gray and white matter abnormalities to cognitive impairment in multiple sclerosis. Int J Mol Sci. 2016:18(1):E46. [DOI] [PMC free article] [PubMed] [Google Scholar]
- Zhao K, Ding Y, Han Y, Fan Y, Alexander-Bloch AF, Han T, Jin D, Liu B, Lu J, Song C, et al. Independent and reproducible hippocampal radiomic biomarkers for multisite Alzheimer’s disease: diagnosis, longitudinal progress and biological basis. Sci Bull (Beijing). 2020:65:1103–1113. [DOI] [PubMed] [Google Scholar]
Associated Data
This section collects any data citations, data availability statements, or supplementary materials included in this article.