

Abstract
Objective
We aimed to determine the out-of-pocket (OOP) costs for medical care of injured patients and the proportion of patients encountering catastrophic costs.
Design
Prospective cohort study
Setting
Emergency department (ED) of a tertiary-level hospital in Dar es Salaam, Tanzania.
Participants
Injured adult patients seen at the ED of Muhimbili National Hospital from August 2019 to March 2020.
Methods
During alternating 12-hour shifts, consecutive trauma patients were approached in the ED after stabilisation. A case report form was used to collect social-demographics and patient clinical profile. Total charges billed for ED and in-hospital care and OOP payments were obtained from the hospital billing system. Patients were interviewed by phone to determine the measures they took to pay their bills.
Primary outcome measure
The primary outcome was the proportion of patients with catastrophic health expenditure (CHE), using the WHO definition of OOP expenditures ≥40% of monthly income.
Results
We enrolled 355 trauma patients of whom 51 (14.4%) were insured. The median age was 32 years (IQR 25–40), 238 (83.2%) were male, 162 (56.6%) were married and 87.8% had ≥2 household dependents. The majority 224 (78.3%) had informal employment with a median monthly income of US$86. Overall, 286 (80.6%) had OOP expenses for their care. 95.1% of all patients had an Injury Severity Score <16 among whom OOP payments were US$176.98 (IQR 62.33–311.97). Chest injury and spinal injury incurred the highest OOP payments of US$282.63 (84.71–369.33) and 277.71 (191.02–874.47), respectively. Overall, 85.3% had a CHE. 203 patients (70.9%) were interviewed after discharge. In this group, 13.8% borrowed money from family, and 12.3% sold personal items of value to pay for their hospital bills.
Conclusion
OOP costs place a significant economic burden on individuals and families. Measures to reduce injury and financial risk are needed in Tanzania.
Keywords: trauma management, health economics, trauma management, accident & emergency medicine
STRENGTHS AND LIMITATIONS OF THIS STUDY.
The study is the first in Tanzania to evaluate the financial burden of trauma on its victims based on their monthly incomes, as well as the losses sustained by hospitals in caring for individuals with trauma. Over 70% of patients were reached in follow-up to determine the proportion requiring distress financing.
The study focused on direct medical care costs for patients and did not account for non-medical care costs (such as OOP payments on food, transport and communication costs), economic loss or costs estimated related to disability.
We also did not interview the family members to enquire about the impact of out-of-pocket payments on the family and rather considered it at an individual level.
Data were collected during 12-hour shifts on alternate days and evenings when the research assistant was scheduled to be in the emergency medicine department. Therefore, some eligible patients may have been missed, although patients arriving in both day and evening were represented.
A few patients (5 out of the 286) were still hospitalised for a duration exceeding the study period, and hospital charges obtained from this group may contribute to an underestimation of overall cost. However, since the median was used in cost computation, it may not alter the overall cost.
Introduction
Injuries are a global burden that result in high morbidity and mortality. The greatest burden of traumatic injuries is in low-income and middle-income countries.1 2 However, the economic burden is also considerable. The cost of care is coupled with the loss of productivity from those disabled or even killed as a result of injuries.3 4 Treatment of injuries can incur massive medical care costs.5–7
In Sub-Saharan Africa (SSA), 45% to 50% of the population is impoverished.8 Tanzania is among the SSA countries battling poverty, with 49.1% of its population living below the international poverty line of US$1.90 per day. US$1 is equivalent to 2315/- Tanzania shillings and can buy 1 litre of fresh milk or ½ litre of packeted milk.9–11 Distress financing and catastrophic health expenditure (CHE) from large out-of-pocket (OOP) healthcare costs for injuries may be a source of worsening poverty for individuals and their families.3
Tanzanian healthcare is a fee-for-service system, but relies heavily on national government financing12 13 to provide assistance in the form of cost-sharing schemes such as part-payment for the elderly, children under 5 years of age, pregnant patients, and patients with chronic infectious diseases such as tuberculosis, leprosy and HIV/AIDS. Despite the government’s assistance, most individuals still pay some amount for healthcare, except for those with health insurance. Different forms of prepaid public insurance coverage exist: the National Health Insurance Fund (NHIF) covers 6.6% of the Tanzanian population14 15 and is compulsory for all those in the public sector.16 The Community Health Fund (CHF), a voluntary community-based public social insurance fund, covers 7.3% of Tanzanians14 16 and is targeted towards those with low incomes and working in the informal sector.17 CHF covers healthcare services, including non-communicable diseases and trauma.18 19 Other prepayment schemes cover less than 1% of the population. Thus, less than 20% of the population is covered by insurance, which means that over 80% of Tanzanian citizens pay OOP at the point of use of healthcare.14 16
To the best of our knowledge, few studies on OOP in Africa have been conducted; a study in a private outpatient orthopaedic clinic in Tanzania found 73.7% of patients had incurred catastrophic expenses.20 However, the OOP expenditures of emergency and admitted patients at government hospitals have not been studied. Understanding the burden that healthcare costs for trauma place on victims and their families is a first step towards determining how funding for healthcare might be improved. We therefore conducted a study to determine the socioeconomic status, injury, hospital charges and OOP payments of victims of trauma seen at a public hospital in Tanzania and the proportion of patients who incur catastrophic costs as a result of injury.
Methods
Study design
This was a prospective observational cohort study of injured adult patients presenting to the emergency medicine department (EMD) of Muhimbili National Hospital (MNH) between the months of August 2019 and March 2020. The protocol was approved by the IRB of Muhimbili University Of Health and Associated Sciences.
Study setting
Patients were enrolled at the EMD of MNH, a public tertiary-level hospital located in Dar es Salaam, on the eastern coast of Tanzania. The EMD at MNH receives approximately 860 injured patients per month with an insured to uninsured ratio of 1:6; some patients are brought directly to the MNH while a large number are referred from lower-level facilities. The EMD has a trauma registry that prospectively collects all details of these injuries, dispositions and outcomes. Injured trauma patients needing admission for neurosurgical, orthopaedic or traumatology interventions are transferred to Muhimbili Orthopedic Institute (MOI), which is a level I trauma centre on the same campus as MNH.
Each service area at MNH bills separately, and individuals have to pay immediately after services are rendered. Some services require an advance payment. Every service delivery area has its own collection point, and these are managed through bank agents.
Different payment methods exist for the acquisition of services at MNH. Self-paying patients have different billing categories at MNH: cost sharing, public or private sponsorship/intramural private practice of MNH (IPPM) (figure 1). Cost sharing and public patients receive certain discounts on fees depending on their financial situation. Cost-sharing individuals have low incomes and pay user fees pre-determined by the facility. Public patients are a special group that have very limited ability to pay for care. They are exempted from most user fees after passing a socioeconomic assessment tool conducted by a social worker. However, in our setting these patients are not completely exempted and contribute user fees at the lowest payable amount. Patients with private self-sponsorship (IPPM) are billed at full price, which is a substantially higher level and are not allowed cost sharing.
Figure 1.
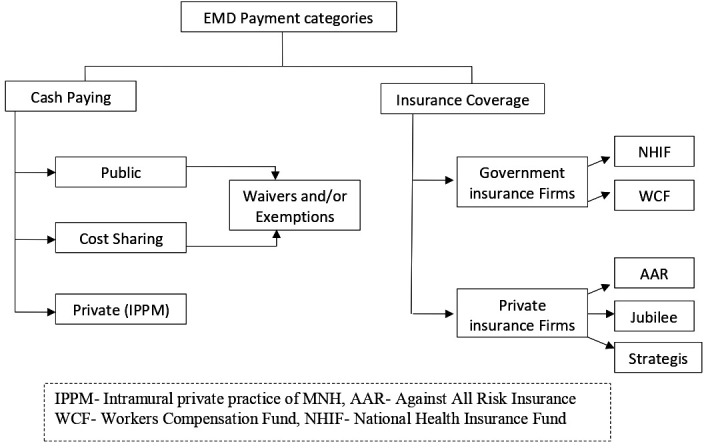
Schematic representation of Muhimbili National Hospital (MNH) emergency medicine department (EMD) payment categories.
Special waivers and exemptions may be provided to any of these patients if they are unable to pay for their medical bills. Waivers and exemptions are given after a series of assessments to ascertain the patient’s poverty level. At MNH, the process is started by the social worker office, sent to the director of nursing services, then to the executive director, and then to the finance department, which processes the waivers or exemptions. Patients who do not qualify for these exemptions are expected to pay their bills whenever they find some money. Patients who fail to pay their hospital bills cannot be seen in any of the outpatient departments on a return visit or admitted to the hospital, except to the emergency department, until they make an attempt to pay their previous bill (source: Accounts Unit, MNH).
Patients who have insurance show their active membership cards at the billing office where the details and membership status of the insurance plan are verified. Clinical services provided are billed to insurance companies. The hospital claims are sent to the insurance companies (preferably within 14 days) for processing reimbursements; items provided during care but not covered by the insurance, or exceeding coverage limits, are added to the bills to be paid by individuals as OOP payments.
Study participants
All consenting adults aged 18 years and older presenting to the MNH EMD with injuries from any cause were eligible for the study. We excluded all patients who were discharged against medical advice and those who had cardiac arrest without return of spontaneous circulation.
Study protocol
The EMD operates 24 hours a day. To obtain a representative sample, research assistants (RAs) were scheduled on alternate day and night shifts (12 hours each) both on week days and weekend days, days, and approached each potentially eligible patient consecutively. The RA explained the purpose of the study and requested written consent from the patient or their next of kin once EMD stabilisation was complete. After patients were enrolled, the RA used a structured case report form to collect information from the patient or next of kin, the treating physician, and/or data found in the electronic medical record (Wellsoft) on demographic and socioeconomic characteristics, payment modalities, injury characteristics and mechanism of injury. The type of injury was classified using the international statistical classification of diseases and related health problems (ICD-10). The RA used the Abbreviated Injury Score (AIS) tool to collect the trauma severity details and recorded them on the data collection form. The Injury Severity Score (ISS) was calculated from the AIS by the researcher and transferred to an electronic REDCap database.
All enrolled patients had their charges and payments determined at the end of their hospital stay using billing records. ED charges and charges for in-patient care (if admitted) were collected from the institutional head accounts unit and included payments made for consultation charges, investigations (laboratory and radiological), medication, surgery and other specialised procedures, accommodation charges and other auxiliary services (that included physiotherapy or any other supportive care provided prior to discharge). Patients whose in-patient length of stay went beyond the end of the recruitment period were followed for up to 2 months, with 30 May as the last date of hospital bills considered.
As most patients would have been asked to pay their bill at the time of hospital discharge, a follow-up phone call was made immediately after discharge to all enrolled patients to assess the burden of their healthcare costs. Patients were asked if they financed healthcare payments through borrowing or selling of personal item of value or household assets, i.e. distress financing.
We used WHO’s definition of Catastrophic Healthcare Expenditure (CHE) which is defined as healthcare spending that exceeds 40% of an individual’s monthly income. (Other authors have used different definitions to estimate CHE, with some using OOP costs exceeding 10% of annual household income, others exceeding 30% of annual consumption expenditure21 22 or 75% of monthly income.20) For each individual, we recorded their monthly income and calculated 40% of that monthly income. We then determined whether OOP payments that they were required to pay exceeded 40% of that individual’s monthly income, which meant that individual had incurred CHE. We calculated CHE for each patient to determine the proportion of all patients with CHE, and then grouped patients by type of employment (formal vs informal employment) and by quartile of monthly income, that is, those receiving ≤$43, >$43 to ≤$130, >$130 to ≤$216, and >$216 to determine the proportion of patients within those categories that incurred CHE.
Outcomes
The primary outcome was the proportion of patients with CHE. Secondary outcomes were actual OOP costs for medical care of injured patients for EMD and hospital inpatient care, differences in OOP expenditures among insured and uninsured patients, OOP expenditures according to injury severity and injury type, and the proportion of patients who required distress financing. Injury severity was judged by ISS, using the standard distinction of ≥16 for severe injury. For the costs associated with injury type, patients with multiple injuries were categorised according to the most severe injury but included all charges. We also obtained the median charges, payments and outstanding debts for all who made partial payments and determined if patients with ISS <16 were more likely to be able to pay in full.
Data analysis
Sample size estimate was based on determining the prevalence of CHE with 95% confidence and a SE of 5%. Using the CHE prevalence of 30% found in a study by Prinja in India, we required a minimum sample size of 355 patients.22 Data from the CRF were entered into REDCap (V.9.1.21, Vanderbilt University, Nashville, TN, USA) and analysed with the IBM SPSS statistical software. Descriptive statistics were computed with continuous variables presented as median (IQR). Categorical variables were expressed as frequencies and percentages with 95% CIs.
Patient and public involvement
Understanding OOP costs for medical care of injured patients and the proportion of patients encountering catastrophic costs provides policy-makers and public with much needed evidence to inform healthcare financing. Patients and the public were not involved in the design of the study. The results of our study will be disseminated through open-access publications.
Results
Patient population
A total of 2146 adult trauma patients were seen at the EMD between August 2019 and March 2020. We approached 380 patients, of whom 355 (93.4%) consented to take part in the study (figure 2). Out of the 355 patients enrolled, 85.6% were uninsured. Of these, 6.3% had public financing and did not pay anything OOP, whereas 93.7% (286 patients) paid some amount OOP. In the insured group, one patient (1.9%) paid an OOP charge for a pharmaceutical item (anti-venom) that was excluded from the health insurance scheme, amounting to US$124.20.
Figure 2.

Flowchart of patient recruitment at the emergency medicine department. OOP, out of pocket.
Of the 286 patients who paid some amount OOP, the majority (83.2%) were men, with a median age of 32 years (IQR 25–40 years) (table 1). Most were married and had primary education only. The median monthly income for all the OOP payers was US$77.75 (IQR 52.92–129.58). Of those who had informal employment the median monthly income was US$86.39 (IQR: 51.84–129.59) (US$1=TZS 2315/-). Those with formal employment had a monthly income of US$136.07 (IQR 95.03–222.46). The majority of participants were the main breadwinners in the households with 87.8% having ≥2 household dependents, and over half of these dependents were adults. The majority of the patients were non-insured (92.0%); 44.2% (95% C.I 38.2 to 50.0) were able to pay their entire bill and 55.8% (95% C.I 49.6 to 61.4) paid partially.
Table 1.
Demographic and socioeconomic characteristics of all out-of-pocket (OOP) payers (N=286)
| Variable n=286 | Frequency | Percent % |
| Sex | ||
| Male | 238 | 83.2 |
| Age | ||
| *Median age 32 years (IQR 25–40) | ||
| Marital status | ||
| Single | 109 | 38.1 |
| Married | 162 | 56.6 |
| Education level | ||
| No education | 27 | 9.4 |
| Primary level | 195 | 68.2 |
| Secondary level | 56 | 19.6 |
| University level | 8 | 2.8 |
| Employment status | ||
| Formal employment | 32 | 11.2 |
| Informal employment | 224 | 78.3 |
| Unemployed | 29 | 10.1 |
| Monthly Income TZS (US$) | ||
| ≤100 000 (US$43.2) | 34 | 13.5 |
| >100 000 to ≤300 000 (US$43–130) | 140 | 55.4 |
| >300 000 to ≤500 000 (US$130–216) | 62 | 24.6 |
| >500 000 (US$216) | 16 | 6.3 |
| Median monthly income formal employment: US$136.07 (IQR: US$95.03–222.46) Median monthly income informal employment: US$86.39 (IQR: US$51.84–129.59) | ||
| Head of household (breadwinner) *Missing 7: had not reported | ||
| Men | 218 | 78.1 |
| Woman | 32 | 11.5 |
| Both | 29 | 10.4 |
| No of household dependents *Missing 12: had no household dependents | ||
| No dependents | 23 | 8 |
| ≥2 dependents | 251 | 87.8 |
| Payment modality | ||
| Non-insured | 285 | 99.7 |
| (a) Public | 263 | 92.0 |
| (b) Cost sharing | 22 | 7.7 |
| Insured | 1 | 0.3 |
| Injury Severity Score (ISS) | ||
| ISS <16 | 272 | 95.1 |
| ISS ≥16 | 14 | 4.9 |
| Length of stay (LOS) median 8 days (IQR 3–28 days) | ||
| ≤7 days | 138 | 48.3% |
| >7 days | 148 | 51.7% |
The average length of stay was 20 days (27.7 SD), median 8 days (IQR 3–28 days) (table 1). Road traffic crash was the leading mechanism of injury (67.5%) followed by falls (17.1%) (online supplemental table 1).
bmjopen-2022-063297supp001.pdf (97.1KB, pdf)
OOP charges and payments by injury type and severity
Few patients (5 out of the 286) were still hospitalised beyond the study follow-up period. The mean length of follow-up was 20 days. The majority of OOP payers had an ISS of <16 (table 1). At the EMD, the median charge was higher in those that had an ISS of ≥16 US$19.35 (IQR 6.26–76.11) compared with those with ISS <16 US$14.64 (4.32–48.60) (online supplemental table 2). Patients with chest injury had the highest EMD charge followed by head injury and abdominal injury. The hospital care charges at end of hospitalisation were highest in those with burn injuries, followed by spinal cord injuries and head injuries (online supplemental table 2).
EMD and hospital OOP payments were more than twice as high for those with ISS ≥16 as well as those with longer lengths of stay (table 2).
Table 2.
OOP payments by injury characteristics, ISS and LOS among OOP payers in US$ (N=286)
| Variable | Frequency | At EMD | In-Hospital | Overall |
| Median (IQR) | Median (IQR) | Median (IQR) | ||
| Type of injury | N | in US$ | ||
| Limb fracture | 152 | 4.88 (4.32–14.56) | 210.54 (135.12–320.35) | 201.99 (89.72–307.43) |
| Wound | 26 | 17.32 (5.49–25.18) | 88.90 (36.89–174.56) | 83.63 (17.19–166.78) |
| Burn | 10 | 30.11 (15.12–34.95) | 172.79 (135.33–475.16) | 169.50 (16.03–353.78) |
| Head injury | 92 | 25.79 (6.26–84.06) | 196.98 (62.63–388.94) | 199.14 (105.23–402.03) |
| Spinal injury | 12 | 9.07 (4.32–26.57) | 262.33 (134.64–790.06) | 277.71 (191.02–874.47) |
| Pelvic injury | 9 | 6.39 (4.32–131.84) | 208.38 (45.23–468.64) | 171.53 (48.38–403.20) |
| Abdominal injury* | 6 | 35.55 (15.29–77.41) | 140.99 (90.02–320.73) | 197.58 (48.81–355.42) |
| Chest injury† | 5 | 17.93 (11.10–48.77) | 203.02 (75.72–367.17) | 282.63 (84.71–369.33) |
| Others‡ | 11 | 22.55 (5.01–84.02) | 143.80 (44.28–281.21) | 64.32 (12.96–282.63) |
| ISS | ||||
| <16 | 272 | 7.43 (4.32–26.65) | 202.16 (101.86–330.50) | 176.98 (62.33–311.97) |
| ≥16 | 14 | 15.85 (4.32–33.43) | 422.89 (184.41–628.60) | 417.97 (58.83–535.25) |
| LOS | ||||
| ≤7 | 138 | – | 134.56 (44.88–233.78) | 116.93 (20.86–221.60) |
| >7 | 148 | – | 281.99 (169.29–466.87) | 257.41 (154.38–455.68) |
Patients with multiple injuries were counted in multiple injury types. Costs according to injury type were classified using the most severe injury types and included all costs. US$1=TZS 2315/-.
*Abdominal visceral injury.
†Rib fractures and lung contusion.
‡Include eye injury, dental injuries, fascial bone fractures and animal bite.
ISS, Injury Severity Score; LOS, length of stay; OOP, out of pocket.
Catastrophic health expenditures and distress financing and debt
Among participants who had any OOP (N=286), 40% of monthly income was US$78 (IQR 52.92–129.58) and the median OOP was US$86.4 (IQR 54.00–129.59). Calculating monthly income and OOP for each patient individually, we determined that 85.3% suffered a CHE (table 3). The proportion of patients with a CHE was higher among those with informal employment versus formal employment and among those with a monthly income ≤US$130.
Table 3.
OOP payments exceeding 40% of monthly income (CHE) (N=286)
| Monthly income (TZS) | Frequency | OOP >40% of monthly income (95% CI) |
| All patients | 244/286 | 85.3% (80.7 to 89.2) |
| Employment | ||
| Formal employment | 25/32 | 78.1% (60.0 to 90.7) |
| Informal employment | 189/224 | 84.4% (78.9 to 88.9) |
| Monthly income quartile | ||
| ≤100 000 (US$43) | 30/34 | 87.9% (72.5 to 96.7) |
| >100 000 to ≤300 000 (US$43–130) | 119/140 | 85.0% (78.0 to 90.5) |
| >300 000 to ≤500 000 (US$130–216) | 49/62 | 79.0% (66.8 to 88.3) |
| >500 000 (US$216) | 12/16 | 75.0% (47.6 to 92.7) |
| Injury Severity Score (ISS) | ||
| ISS <16 | 233/272 | 85.7% (80.9 to 89.6) |
| ISS ≥16 | 11/14 | 78.6% (49.2 to 95.3) |
CHE, catastrophic health expenditure; OOP, out of pocket.
Of those with OOP, 159 (55.6%) paid their bill partially while 127 (44.4%) paid their bill fully. Of the patients with ISS <16, 149 (54.8%) (95% CI 48.7 to 60.8) paid partially and 123 (45.2%) (95% CI 39.2 to 51.3) paid in full, while of those with ISS ≥16, 10 (71.4%) (95% CI 41.9 to 91.6) paid partially and 4 (28.6%) (95% CI 8.4 to 58.1) paid in full. The median outstanding debt to the hospital was US$129.58 (95% CI 47.72 to 266.79), which was slightly less than half of the total median charge (table 4).
Table 4.
Charge, payments and outstanding debt among partial OOP payers in US$ N=159
| Median charge (IQR) | Median payment (IQR) | Median outstanding debt (IQR) | |
| ED | 19.83 (5.66–70.71) | 7.19 (4.32–25.64) | 16.52 (4.32–50.38) |
| In-hospital | 331.23 (188.26–613.65) | 197.80 (88.12–362.22) | 178.71 (84.79–342.56) |
| Overall | 342.71 (191.58–700.36) | 168.90 (62.25–336.09) | 129.58 (47.72–266.79) |
ED, emergency department; OOP, out of pocket.
We were able to reach and interview 203/286 (70.9%) of all OOP payers to assess distress financing (online supplemental table 3). Among those reached, 76 had some sort of stress financin; 13.8% had their bills paid by family or had to borrow from family, 12.3% had to sell a personal item of value (that included household items, phones and motorcycles) and 2.0% had their bills paid by their employers. More than half did nothing regarding the debt. Distress financing was more common among those who paid in full 51.8% (95% CI 40.7 to 62.7) compared with those who paid partially 48.2% (95% C.I 37.3 to 59.3) (online supplemental table 3).
Among those that were not reachable, 56.6% (95% C.I 45.3 to 67.5) had paid partially (online supplemental table 3). However, among those not reached the proportion of patients who paid only partially was slightly higher than among those reached. The median debt among those who did not respond to our calls was slightly higher than the median debt for the group overall, US$148.70 (IQR 65.40–340.30)
Discussion
The majority of trauma patients brought to our ED were uninsured and paid OOP for some or all of their ED and hospital care charges. Of all trauma victims, 85.3% incurred a CHE, and over one-third of these patients needed to borrow money from family or friends or sell a personal possession. Nevertheless, over half of all patients with CHE still owed money to the hospital. CHE was slightly higher in those with informal employment than in those with formal employment, and it was higher among those with more severe injuries.
The high level of CHE in this study was similar to a study in Ethiopia23 and Tanzania20 but different to a study in India.3 The study in Ethiopia found that 67% of 452 trauma patients incurred CHE.23 The study of outpatient orthopaedic patients in Tanzania found that CHE occurred in 73.7% of 242 outpatients,20 while in India, CHE was 30% among 227 trauma patients.3 High CHE associated with trauma in Tanzania could be due to high OOP costs at the point of care with limited prepayment schemes and poor access to trauma care with long waiting times.23 Comparatively, a study in Tanzania looking at general health expenditure among adults found that the mean OOP payment was US$2.2 (SD 9.5) per month, showing the substantial financial impact of trauma care.24
In SSA in general, factors that contribute to CHE are low socioeconomic status, lack of health insurance, rural residence, old age, chronic illness, hospitalisation, use of a private healthcare provider and use of specialist care.25 These factors are similar in comparable regions such as Iran,26 India27 and Chile.28 These factors may also apply in developed countries; a US study with 16 801 trauma patients estimated a CHE risk of 81.4% for uninsured patients.29
Similar to the prior study in India, we found that low-wage earners or those with informal employment incurred a greater economic burden from OOP costs that result in CHE and distress financing than those with formal employment who had higher incomes.3 30 However, the majority of patients in both occupational groups encountered CHE, suggesting that the costs of trauma care are too great a burden for most Tanzanians.
Only one previous study, conducted in Vietnam, looked at the impact of injury severity on OOP. As in our study, patients with an ISS ≥16 had a higher OOP expenditure compared with those with less severe injuries.6 We also found that, regardless of ISS, those with longer lengths of stay had higher OOP, confirming findings from prior studies.3 7 Notably, patients with chest injuries incurred the highest charges for EMD care, which is likely due to the immediate need for resuscitation items such as chest tubes, and mechanical ventilation, as well as the fact that chest injuries are frequently accompanied by other injuries. However, hospitalisation charges were highest for burns and spinal cord injuries, which warrant longer hospital stays to recover.31 32 In addition, spinal cord injury demands expensive radiological diagnostic tests such as MRI and CT scans as well as complex, time-sensitive surgical procedures for spine stabilisation, ICU stay post-surgery, and rehabilitation care.33
Over 85% of injured patients in our study did not have any form of insurance coverage, despite the government’s efforts to put in place a community health fund (CHF) targeted towards those with low income and informal sector employment.16 18 In Ethiopia, only 7% of the trauma patients were insured.23 However, in the USA, less than 20% of the trauma patients were uninsured.29 Notably, 25.9% of those that had private insurance in the US trauma study had a CHE of 25.9%,29 suggesting that insurance coverage per se may not be sufficient and will depend on the type of insurance and benefits provided.
Over half of patients had paid only a portion of their bills at the time of discharge, with the median debt coming close to half of the initial charge. Emergency services are essential life-saving emergency procedures and need to be performed regardless of one’s ability to pay. Once in the hospital, clinicians will also provide care at the existing medical standard, with considerations of bill payment secondary in their decisions. Thus, patients are billed for OOP costs that they can only partially pay and thus find themselves in substantial debt.34 This in turn creates a threat to the sustainability of healthcare delivery as hospitals must forgo revenues from individuals who end up needing payment exemption or cannot pay the full bill.
Our study found that the majority of the patients had a road traffic accident as their mechanism of injury. As per a study done in South Asia,35 the economic burden of road traffic accidents was mainly due to OOP payments. Preventing serious injuries is one way to reduce OOP spending on healthcare. This can be achieved by havingt road users taking the required safety courses to maintain a driving license, training them to to observe road traffic rules and enforcement of the rules by police, as well as making road improvements. t36 A better healthcare payment model, such as more affordable prepayment schemes and universal health coverage, is another way to combat OOP spending, as is increasing the number of trauma centres to avoid the cost of transfer and potential duplication of tests.21 23
Study strengths (methodological strengths)
The hospital-based recruitment of injured patients at a tertiary-level hospital in Tanzania with a level I trauma centre and different types of injuries with varying severity and payment modalities has provided a wide perspective on the OOP payments associated with these injuries. The ability to obtain patient information on income and follow-up of patients to hospital discharge ensured all medical care expenditures (OOP payments) were captured and CHE could be calculated, as well as remaining debt. The use of an electronic revenue collection system has allowed for an accurate picture of the actual charges and payments.
Study limitations
This was a single-centre study using convenience sampling and may not be fully representative of all patients seen in our facility or generalisable to the entire population. Attempts were made to decrease the risk of selection bias by having RAs approach enrolling patients on scheduled days that alternated between day and night shifts (12 hours each); however, they may have missed patients during the times they were not present. However, we know that the proportions of insured and uninsured patients in our study are similar to those of Tanzania as a whole, suggesting that the population is representative. The study did not include OOP costs for indirect medical care expenses such as those used for food and transport, care before the MNH visit or subsequent clinic visits after discharge, nor economic loss or costs related to disability. Inability to contact all patients regarding distress financing is likely to have underestimated the proportion requiring these actions, as those not reached were less likely to have paid in full and had a higher outstanding debt.
Conclusion
The majority of injured patients presenting to the ED of a national referral hospital in Tanzania incur catastrophic healthcare expenditures. Patients with CHE are more likely to have lower incomes, informal employment, more severe injuries and a longer length of stay. The need for distress financing is common. The government, health insurance providers and other stakeholders should examine ways of providing affordable, low-barrier pre-payment plans for low-income earners to protect them from CHE and ensure the continued availability of healthcare services.
Supplementary Material
Acknowledgments
The authors would like to thank all the study participants, Mr Francis Ambrose and research team, Mr Bahati Thobias, Mr Clive L Urima, Mr Hassan A Chawala, Mr Chesco Lackson Mtenga and Mr Joash for all the assistance in making this project a success.
Footnotes
Contributors: MAG is the guarantor for this study, was involved in the study design conceptualisation, data collection, analysis and interpretation, drafted the manuscript and made all necessary changes to the manuscript. HRS and EJW were involved in the study design conceptualisation, review of the data analysis and interpretation, and critical review of the manuscript. RM and AMS were involved in data analysis and interpretation and revision of the manuscript. MAG, GMH, SR, FS, AMS and WM were involved in interpretation and revision of the manuscript. SK and JAM were involved in the study design, data analysis and interpretation, and review of manuscript. All authors take full responsibility of this manuscript.
Funding: The authors have not declared a specific grant for this research from any funding agency in the public, commercial or not-for-profit sectors.
Competing interests: None declared.
Patient and public involvement: Patients and/or the public were not involved in the design, or conduct, or reporting, or dissemination plans of this research.
Provenance and peer review: Not commissioned; externally peer reviewed.
Supplemental material: This content has been supplied by the author(s). It has not been vetted by BMJ Publishing Group Limited (BMJ) and may not have been peer-reviewed. Any opinions or recommendations discussed are solely those of the author(s) and are not endorsed by BMJ. BMJ disclaims all liability and responsibility arising from any reliance placed on the content. Where the content includes any translated material, BMJ does not warrant the accuracy and reliability of the translations (including but not limited to local regulations, clinical guidelines, terminology, drug names and drug dosages), and is not responsible for any error and/or omissions arising from translation and adaptation or otherwise.
Data availability statement
Data are available on reasonable request. The dataset supporting the conclusion of this article is available from the authors on request.
Ethics statements
Patient consent for publication
Obtained.
Ethics approval
This study involves human participants, and ethical clearance was obtained from MUHAS IRB, with reference number DA.287/298/01A. Participants gave informed consent to participate in the study before taking part.
References
- 1.Wesson HKH, Boikhutso N, Bachani AM, et al. The cost of injury and trauma care in low- and middle-income countries: a review of economic evidence. Health Policy Plan 2014;29:795–808. 10.1093/heapol/czt064 [DOI] [PMC free article] [PubMed] [Google Scholar]
- 2.Sawe HR, Mfinanga JA, Mbaya KR, et al. Trauma burden in Tanzania: a one-day survey of all district and regional public hospitals. BMC Emerg Med 2017;17:30. 10.1186/s12873-017-0141-6 [DOI] [PMC free article] [PubMed] [Google Scholar]
- 3.Prinja S, Jagnoor J, Chauhan AS, et al. Economic burden of hospitalization due to injuries in North India: a cohort study. Int J Environ Res Public Health 2016;13:673. 10.3390/ijerph13070673 [DOI] [PMC free article] [PubMed] [Google Scholar]
- 4.WHO . Injuries and violence: the facts 2014 World Health Organization, 2014. Available: https://apps.who.int/iris/bitstream/handle/10665/149798/9789241508018_eng.pdf [Google Scholar]
- 5.Hemmila MR, Jakubus JL, Maggio PM, et al. Real money: complications and hospital costs in trauma patients. Surgery 2008;144:307–16. 10.1016/j.surg.2008.05.003 [DOI] [PMC free article] [PubMed] [Google Scholar]
- 6.Nguyen H, Ivers R, Jan S, et al. Analysis of out-of-pocket costs associated with hospitalised injuries in Vietnam. BMJ Glob Health 2017;2:e000082. 10.1136/bmjgh-2016-000082 [DOI] [PMC free article] [PubMed] [Google Scholar]
- 7.Kumar GA, Dilip TR, Dandona L, et al. Burden of out-of-pocket expenditure for road traffic injuries in urban India. BMC Health Serv Res 2012;12:285. 10.1186/1472-6963-12-285 [DOI] [PMC free article] [PubMed] [Google Scholar]
- 8.Schoch M, Lakner C. The number of poor people continues to rise in sub-Saharan Africa, despite a slow decline in the poverty rate. 2020. Available: https://blogs.worldbank.org/opendata/number-poor-people-continues-rise-sub-saharan-africa-despite-slow-decline-poverty-rate [Accessed 24 May 2021].
- 9.WHO . Out-of-pocket payments, user fees and catastrophic expenditure. Available: http://www.who.int/health_financing/topics/financial-protection/out-of-pocket-payments/en/ [Accessed 5 May 2019].
- 10.World Bank . Tanzania poverty assessment. 2015. Available: http://www.worldbank.org/content/dam/Worldbank/document/Africa/Tanzania/Report/tanzania-poverty-assessment-05.2015.pdf [Accessed 5 May 2019].
- 11.Tanzania . National household budget 2011-2012 overview. Available: http://www.ilo.org/surveydata/index.php/catalog/503/study-description [Accessed 11 May 2011].
- 12.WHO . Mid-level health workers for delivery of essential health services - Tanzania. 2013. Available: https://www.who.int/workforcealliance/knowledge/resources/MLHWCountryCaseStudies_annex5_Tanzania.pdf?ua=1 [Accessed 5 May 2019].
- 13.Boex J, Fuller L, Malik A. Decentralized local health services in Tanzania. urban inst, 2015: 1–34Available. https://www.urban.org/sites/default/files/publication/51206/2000215-Decentralized-Local-Health-Services-in-Tanzania.pdf [Google Scholar]
- 14.USAID . Health financing profile - Tanzania, 2016. Available: https://www.healthpolicyproject.com/pubs/7887/Tanzania_HFP.pdf
- 15.Mtei G, Makawia S, Ally M, et al. Who pays and who benefits from health care? An assessment of equity in health care financing and benefit distribution in Tanzania. Health Policy Plan 2012;27 Suppl 1:i23–34. 10.1093/heapol/czs018 [DOI] [PubMed] [Google Scholar]
- 16.Kumburu PN. National health insurance fund (NHIF) in Tanzania as a tool for improving universal coverage and accessibility to health care services. mzumbe univ, 2015. Available: http://scholar.mzumbe.ac.tz/handle/11192/1028
- 17.USAID . Prospects for sustainable health financing in Tanzania: baseline report, 2015. Available: https://www.healthpolicyproject.com/pubs/788_ProspectsforSustainableHealthFinanciFINAL.pdf
- 18.Lee B, Tarimo K, Dutta A. Tanzania’s improved community health fund: an analysis of scale-up plans and design. health policy plus, 2018. Available: http://www.healthpolicyplus.com/ns/pubs/10259-10469_TanzaniaiCHFScaleUpbrief.pdf
- 19.Macha J, Kuwawenaruwa A, Makawia S, et al. Determinants of community health fund membership in Tanzania: a mixed methods analysis. BMC Health Serv Res 2014;14:538. 10.1186/s12913-014-0538-9 [DOI] [PMC free article] [PubMed] [Google Scholar]
- 20.Davey S, Bulat E, Massawe H, et al. The economic burden of non-fatal musculoskeletal injuries in northeastern Tanzania. Ann Glob Health 2019;85:23. 10.5334/aogh.1355 [DOI] [PMC free article] [PubMed] [Google Scholar]
- 21.Liu H, Zhu H, Wang J, et al. Catastrophic health expenditure incidence and its equity in China: a study on the initial implementation of the medical insurance integration system. BMC Public Health 2019;19:1761. 10.1186/s12889-019-8121-2 [DOI] [PMC free article] [PubMed] [Google Scholar]
- 22.Prinja S, Jagnoor J, Sharma D, et al. Out-of-pocket expenditure and catastrophic health expenditure for hospitalization due to injuries in public sector hospitals in north India. PLoS One 2019;14:e0224721. 10.1371/journal.pone.0224721 [DOI] [PMC free article] [PubMed] [Google Scholar]
- 23.Dhufera HT, Jbaily A, Verguet S, et al. Financial risk of road traffic trauma care in public and private hospitals in Addis Ababa, Ethiopia: a cross-sectional observational study. Injury 2022;53:23–9. 10.1016/j.injury.2021.11.009 [DOI] [PMC free article] [PubMed] [Google Scholar]
- 24.Brinda EM, Andrés AR, Enemark U. Correlates of out-of-pocket and catastrophic health expenditures in Tanzania: results from a national household survey. BMC Int Health Hum Rights 2014;14:5. 10.1186/1472-698X-14-5 [DOI] [PMC free article] [PubMed] [Google Scholar]
- 25.Eze P, Lawani LO, Agu UJ, et al. Factors associated with catastrophic health expenditure in sub-Saharan Africa: a systematic review. PLoS One 2022;17:e0276266. 10.1371/journal.pone.0276266 [DOI] [PMC free article] [PubMed] [Google Scholar]
- 26.Doshmangir L, Yousefi M, Hasanpoor E, et al. Determinants of catastrophic health expenditures in Iran: a systematic review and meta-analysis. Cost Eff Resour Alloc 2020;18:17. 10.1186/s12962-020-00212-0 [DOI] [PMC free article] [PubMed] [Google Scholar]
- 27.Pandey A, Ploubidis GB, Clarke L, et al. Trends in catastrophic health expenditure in India: 1993 to 2014. Bull World Health Organ 2018;96:18–28. 10.2471/BLT.17.191759 [DOI] [PMC free article] [PubMed] [Google Scholar]
- 28.Koch KJ, Cid Pedraza C, Schmid A. Out-of-pocket expenditure and financial protection in the Chilean health care system-a systematic review. Health Policy 2017;121:481–94. 10.1016/j.healthpol.2017.02.013 [DOI] [PubMed] [Google Scholar]
- 29.Scott JW, Shrime MG, Stewart BT, et al. Lifting the burden: state Medicaid expansion reduces financial risk for the injured. J Trauma Acute Care Surg 2020;88:51–8. 10.1097/TA.0000000000002493 [DOI] [PubMed] [Google Scholar]
- 30.Wagstaff A, Flores G, Hsu J. Progress on catastrophic health spending in 133 countries: a retrospective observational study. [DOI] [PubMed] [Google Scholar]
- 31.Moshi H, Sundelin G, Sahlen K-G, et al. Traumatic spinal cord injury in the north-east Tanzania-describing incidence, etiology and clinical outcomes retrospectively. Glob Health Action 2017;10:1355604. 10.1080/16549716.2017.1355604 [DOI] [PMC free article] [PubMed] [Google Scholar]
- 32.Ghaed Chukamei Z, Mobayen M, Bagheri Toolaroud P, et al. The length of stay and cost of burn patients and the affecting factors. Int J Burns Trauma 2021;11:397–405. [PMC free article] [PubMed] [Google Scholar]
- 33.Boniface R, Museru L, Kiloloma O, et al. Factors associated with road traffic injuries in Tanzania. Pan Afr Med J 2016;23:46. 10.11604/pamj.2016.23.46.7487 [DOI] [PMC free article] [PubMed] [Google Scholar]
- 34.Sylvanus E, Sawe HR, Muhanuzi B, et al. Profile and outcome of patients with emergency complications of renal failure presenting to an urban emergency department of a tertiary hospital in Tanzania. BMC Emerg Med 2019;19:11. 10.1186/s12873-019-0229-2 [DOI] [PMC free article] [PubMed] [Google Scholar]
- 35.Alam K, Mahal A. The economic burden of road traffic injuries on households in South Asia. PLoS One 2016;11:e0164362. 10.1371/journal.pone.0164362 [DOI] [PMC free article] [PubMed] [Google Scholar]
- 36.Bonnet E, Lechat L, Ridde V. What interventions are required to reduce road traffic injuries in Africa? A scoping review of the literature. PLoS One 2018;13:e0208195. 10.1371/journal.pone.0208195 [DOI] [PMC free article] [PubMed] [Google Scholar]
Associated Data
This section collects any data citations, data availability statements, or supplementary materials included in this article.
Supplementary Materials
bmjopen-2022-063297supp001.pdf (97.1KB, pdf)
Data Availability Statement
Data are available on reasonable request. The dataset supporting the conclusion of this article is available from the authors on request.