

Abstract
Subpopulations of neurons and associated neural circuits can be targeted in mice with genetic tools in a highly selective manner for visualization and manipulation. However, there are not well-defined Cre “driver” lines that target the expression of Cre recombinase to thalamocortical (TC) neurons. Here, we characterize three Cre driver lines for the nuclei of the dorsal thalamus: Oligodendrocyte transcription factor 3 (Olig3)-Cre, histidine decarboxylase (HDC)-Cre, and corticotropin-releasing hormone (CRH)-Cre. We examined the postnatal distribution of Cre expression for each of these lines with the Cre-dependent reporter CAG-tdTomato (Ai9). Cre-dependent expression of tdTomato reveals that Olig3-Cre expresses broadly within the thalamus, including TC neurons and interneurons, while HDC-Cre and CRH-Cre each have unique patterns of expression restricted to TC neurons within and across the sensory relay nuclei of the dorsal thalamus. Cre expression is present by the time of natural birth in all three lines, underscoring their utility for developmental studies. To demonstrate the utility of these Cre drivers for studying sensory TC circuitry, we targeted the expression of channelrhodopsin-2 to thalamus from the CAG-COP4*H134R/EYFP (Ai32) allele with either HDC-Cre or CRH-Cre. Optogenetic activation of TC afferents in primary visual cortex was sufficient to measure frequency-dependent depression. Thus, these Cre drivers provide selective Cre-dependent gene expression in thalamus suitable for both anatomical and functional studies.
Keywords: Cre recombinase, dorsal lateral geniculate nucleus, medial geniculate nucleus, thalamocortical, ventrobasal complex
1 |. INTRODUCTION
Anatomical and functional dissection of mammalian neural circuits is now possible with unprecedented precision because of genetically modified mice (Bernstein et al., 2012; DeNardo & Luo, 2017; Luo et al., 2008, 2018; Madisen et al., 2012; Taniguchi et al., 2011; Yizhar et al., 2011). Cre drivers, mouse lines that direct Cre recombinase expression with specific promoters, permit the visualization and manipulation of discrete inputs to the thalamus (Gong et al., 2007; Harris et al., 2014, 2019; Kay et al., 2011; Madisen et al., 2010; Sabbah et al., 2017). For example, Cre drivers target different inputs onto thalamocortical (TC) relay neurons, including afferents carrying sensory information (e.g., Thy1-Cre, Npy1r-Cre), corticothalamic projections (e.g., Efr3a-Cre, Ntsr1-Cre [GN220]), various neuromodulators (e.g., ChAT-Cre), and inhibitory neurons within the thalamus itself (e.g., GAD2-Cre, SST-Cre; Bickford et al., 2015; Campbell et al., 2020; Grant et al., 2016; Huerta-Ocampo et al., 2020; Kim et al., 2015; Martersteck et al., 2017; Silveira et al., 2020; Sokhadze et al., 2018, 2019; Thompson et al., 2016). By comparison, there are no characterized Cre driver lines selective for TC relay neurons. Identifying the temporal and spatial expression pattern of such Cre drivers will define their utility for studying unresolved features of TC circuitry including delineating TC projections from first-order (FO) and higher-order (HO) nuclei, intra-thalamic projections between reticular and extra-reticular nuclei, and inter-thalamic connections between different cell types.
Here, we characterized three Cre drivers that provide selective expression in TC relay nuclei: oligodendrocyte transcription factor 3 (Olig3-Cre), histidine decarboxylase (HDC-Cre), and corticotropin-releasing hormone (CRH-Cre; Gerfen et al., 2013; Vue et al., 2009; Zecharia et al., 2012). Each of these Cre drivers yields Cre-dependent expression in FO TC neurons as well as some HO neurons. The onset of Cre expression for these Cre drivers is sufficient to label TC neurons by birth, a useful characteristic for studying thalamic development. We demonstrate that these lines are compatible with optogenetics and outline the potential utility of these Cre drivers for the study of the thalamus in mouse
2 |. MATERIALS AND METHODS
2.1. |. Subjects
Mouse lines examined in this study are summarized in Table 1: Olig3-Cre (Olig3tm1(cre)Ynka; Gift of Yasushi Nakagawa, University of Minnesota), HDC-Cre (Tg(Hdc-cre)IM1Gsat/Mmucd; Jackson Labs, stock #021198), CRH-Cre (Tg(Crh-cre)KN282Gsat; MMRRC, stock #030850-UCD), (Ai9) (B6.Cg-Gt(ROSA)26Sor tm9(CAG-tdTomato)Hze; Jackson Labs, stock # 007905), and (Ai32) (B6;129S-Gt(ROSA)26Sor tm32(CAG-COP4*H134R/EYFP)Hze; Jackson Labs, stock #012569). Heterozygous Olig3-Cre, HDC-Cre, and CRH-Cre mice were bred with homozygous Ai9 mice to generate Olig3-Cre;Ai9, HDC-Cre;Ai9, and CRH-Cre;Ai9 offspring. Heterozygous HDC-Cre and CRH-Cre mice were bred with homozygous Ai32 mice to generate HDC-Cre;Ai32 and CRH-Cre;Ai32 offspring. Tissue was harvested from mice of either sex at postnatal days (P) 0 to 60. Mice were group-housed and maintained on a 12-h light/dark cycle under standard housing conditions. All procedures and breeding were performed in accordance with the guidelines of the Institutional Animal Care and Use Committees at the University of Louisville.
TABLE 1.
List of mouse lines used
| Mouse line | Allele name and symbol | Allele type and generation | Vendor and Stock | Developed by |
|---|---|---|---|---|
| Olig3-Cre | Oligodendrocyte transcription factor 3 Olig3tm1(cre)Ynka |
Knock-in; targeted, homologous recombination | Gift of Yasushi Nakagawa | Yasushi Nakagawa, University of Minnesota |
| HDC-Cre | Histidine decarboxylase Tg(Hdc-cre)IM1Gsat/Mmucd | Knock-in; targeted, homologous recombination | Jackson Labs stock # 021198 | William Wisden, Imperial College London |
| CRH-Cre | Corticotropin-releasing hormone Tg(Crh-cre)KN282Gsat | Transgenic; bacterial artificial chromosome | MMRRC stock # 030850-UCD | GENSAT Project, The Rockefeller University |
| Ai9 | tdTomato Gt(ROSA)26Sortm9 (CAG-tdTomato)Hze | Floxed; targeted, homologous recombination | Jackson Labs stock # 007905 | Hongkui Zeng, Allen Institute for Brain Science |
| Ai32 | Channelrhodopsin2-enhanced yellow fluorescent protein (eYFP) Gt(ROSA)26Sortm32(CAG-COP4*H134R/EYFP)Hze |
Floxed; targeted, homologous recombination | Jackson Labs stock #012569 | Hongkui Zeng, Allen Institute for Brain Science |
2.2 |. Histology
Mice were deeply anesthetized by isoflurane vapors (4%; ≥P14) or by hypothermia (≤P7), and then transcardially perfused with phosphate-buffered saline (PBS; 0.01M phosphate buffer with 0.9% NaCl), followed by 4% paraformaldehyde (PFA) in 0.1 M PB. Brains were removed, fixed overnight in 4% PFA, and then transferred to PBS. Coronal sections 70 or 100-µm thick across the entire extent of the dorsal thalamus and sensory cortices were cut on a vibratome (Leica VT1000S). Sections were mounted on glass slides using ProLong Gold Antifade Mounting Medium (RRID:SCR_015961). In some cases, nuclear staining was performed by washing sections in 1:2000 Hoechst 33342 (Cell Signaling Technology Cat# 4082, RRID:AB10626776) in PBS for 12 min, then washing PBS and mounting using aforementioned procedures. In some sections, nuclear staining was achieved by using ProLong Gold Antifade Mounting Medium containing DAPI (4′,6-diamidino-2-phenylindole) (RRID:SCR_015961).
To label inhibitory interneurons within the dLGN using immunohistochemistry, sections were blocked with 0.3% Triton X-100 and 10% normal goat serum (NGS) in 0.1M PBS for 1 h, and then incubated overnight (12 h) in rabbit anti-GAD-65/67 polyclonal antibody (1:1000; Sigma-Aldrich Cat# G5163, RRID:AB_477019) with 1% NGS, 0.3% Triton X-100 and PBS. The immunogen for anti-GAD-65/67 antibody is a synthetic peptide corresponding to the C-terminal region of human GAD-67 amino acids 579–594. The sequence is identical in human, rat, mouse, and pig GAD-65, in rat, pig, and cat GAD-67, and is highly conserved in mouse GAD-67 (per the manufacturer). Next, sections were washed in PBS (3 × 10 min) and placed in goat anti-rabbit antibody conjugated to Alexa Fluor (AF) 488 (1:100; Thermo Fisher Scientific Cat# A-11034, RRID:AB 2576217) for 1 h. After a PBS wash, sections were mounted onto glass slides as described above.
2.3 |. Imaging and analysis
Images of tdTomato fluorescence in Olig3-Cre;Ai9, HDC-Cre;Ai9, and CRH-Cre;Ai9 tissue were acquired using an epi-fluorescence dissecting scope (Olympus SZX16), epi-fluorescence microscope (Olympus BX43), or laser-scanning confocal microscope (Olympus FV12000BX61). Images of neuronal tdTomato labeling in dLGN (Figure 1a4,b4,c4) were acquired using a confocal microscope equipped with a 60X objective (1.35 NA) and depict 10-µm-thick Z-stacks (20 optical sections, 0.5-µm step size). Delineation of the thalamic nuclei borders was aided by nuclear staining and by referencing corresponding atlas images (Paxinos & Franklin, 2004)
FIGURE 1.
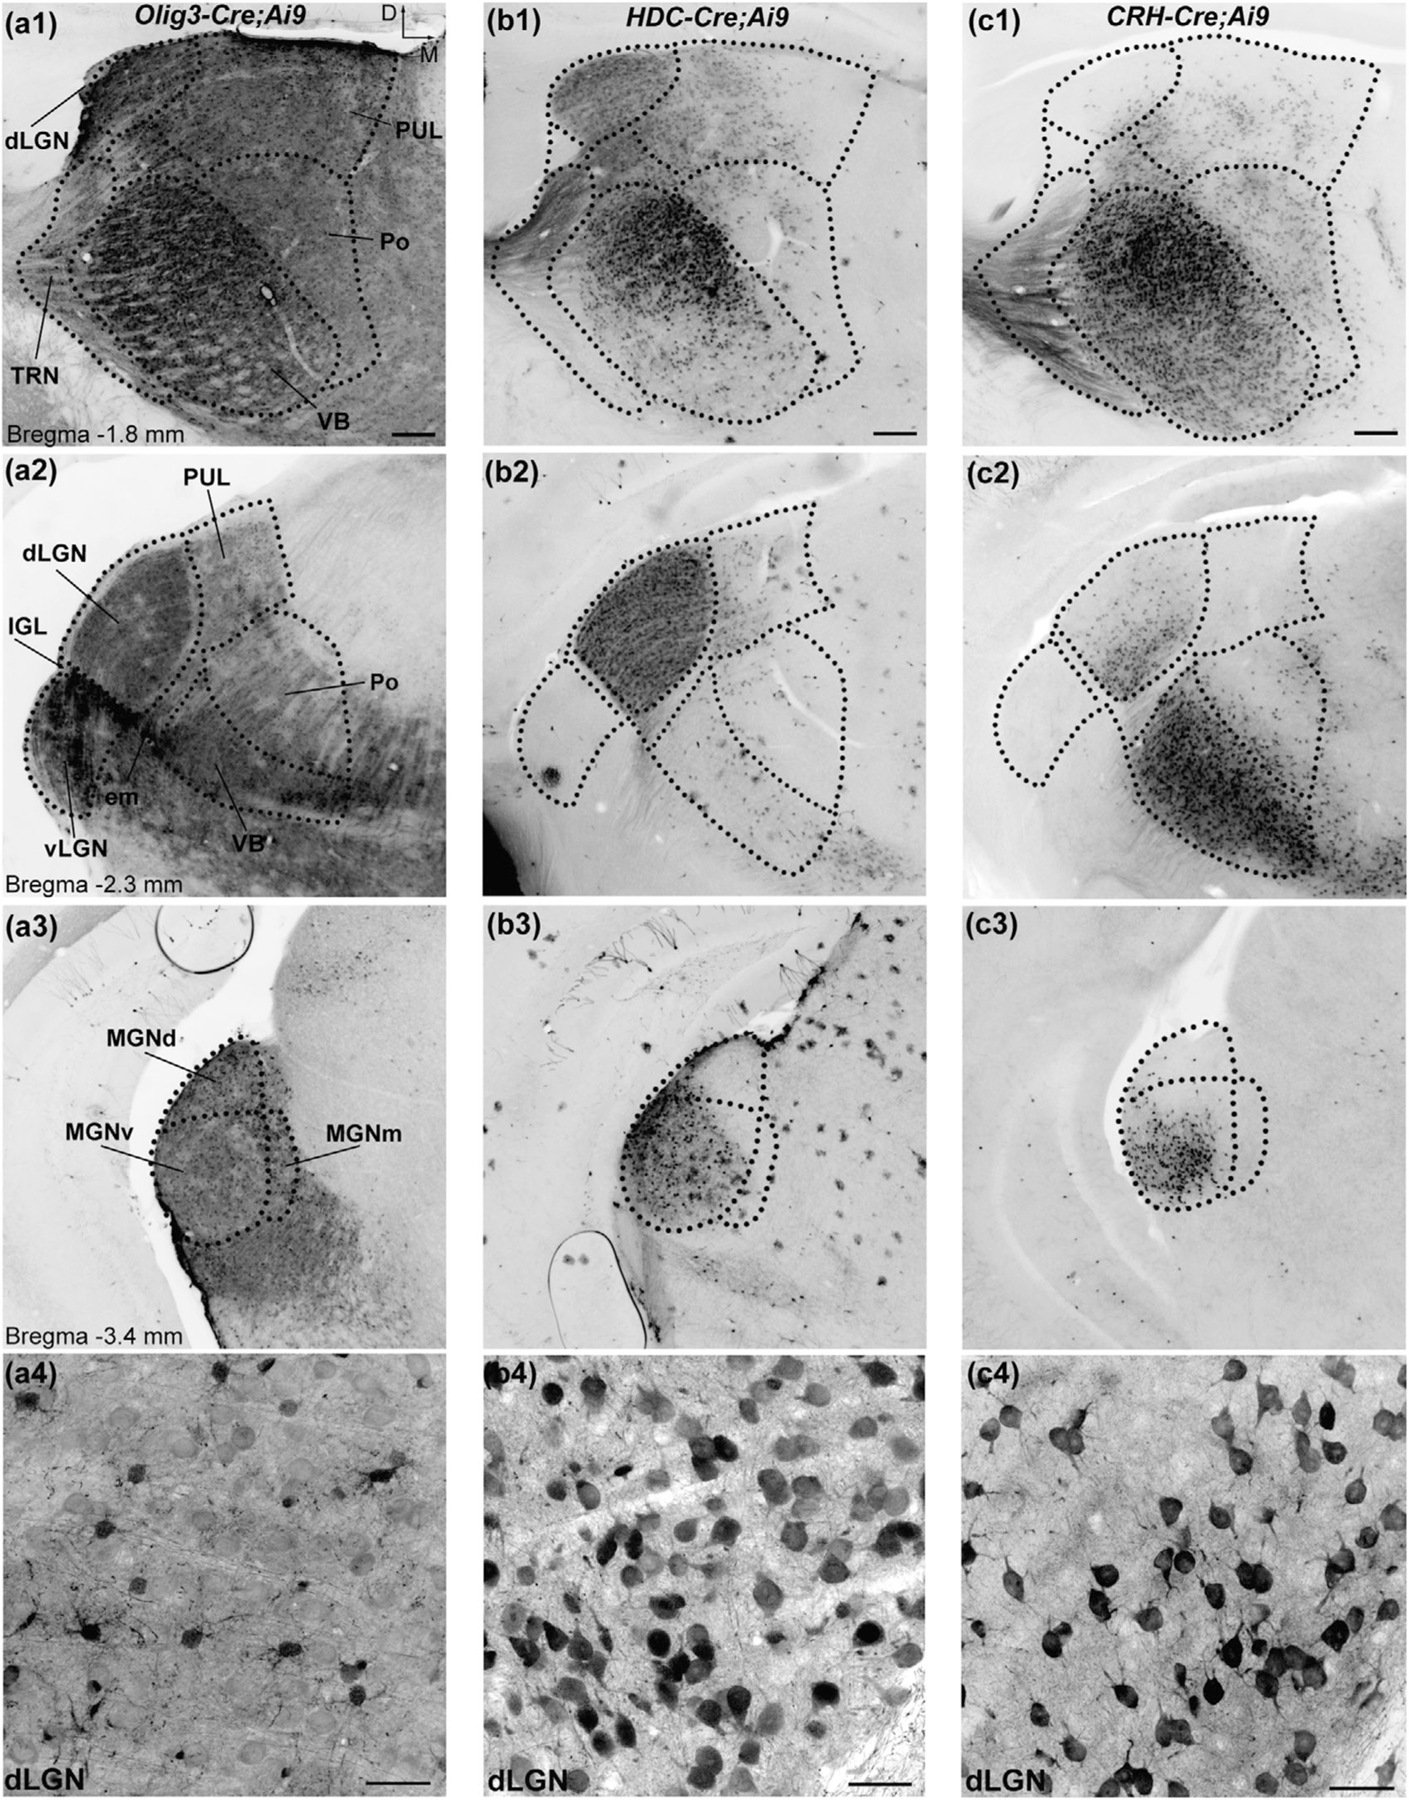
Pattern of tdTomato labeling in the dorsal thalamus of Oligodendrocyte transcription factor 3 (Olig3)-Cre;Ai9, histidine decarboxylase (HDC)-Cre;Ai9, and corticotropin-releasing hormone (CRH)-Cre;Ai9 mice. Coronal sections of the dorsal thalamus in P28 Olig3-Cre;Ai9 (a), HDC-Cre;Ai9 (b), and CRH-Cre;Ai9 (c) mice. (a) In Olig3-Cre;Ai9, somatic tdTomato labeling is across the rostro-caudal extent of the dorsal thalamus (a1–a3). Higher magnification view of somatic labeling in the dorsal lateral geniculate nucleus (dLGN) (a4). Scale bars = 30 µm (a4). (b) In HDC-Cre;Ai9, somatic labeling is present in the ventrobasal complex (VB; b1), the dLGN (b1, b2), and the ventral division of the medial geniculate nucleus (MGNv; b3). Higher magnification view of somatic labeling in the dLGN (b4). Scale bars = 30 µm (b4). (c) In CRH-Cre;Ai9, somatic labeling is present in the VB (c1, c2), dLGN (c2), and MGNv (c3). Higher magnification view of somatic labeling in the dLGN. Scale bars = 30 µm (c4). Dotted lines delineate the boundaries of thalamic nuclei. Scale bars = 200 µm. PUL: pulvinar. IGL: intergeniculate leaflet. TRN: thalamic reticular nucleus. Po: posterior nucleus. em: external medullary lamina of the thalamus. MGNd: dorsal division of the medial geniculate nucleus. MGNm: medial division of the medial geniculate nucleus
To quantify the regional distribution of somatic tdTomato labeling in FO relay nuclei of HDC-Cre;Ai9 and CRH-Cre;Ai9 mice, three locations along the rostro-caudal extent of the dorsal lateral geniculate nucleus (dLGN; −2.0, −2.4, and −2.8 mm from bregma), VB (−1.5, −1.8, and −2.1 mm from bregma), and MGNv (−2.9, −3.2, and −3.4 mm from bregma) were acquired using coronal sections. All images were acquired using a confocal scanning microscope equipped with a 10x objective (0.3 NA). Ten consecutive optical sections were acquired in the Z-plane (5 -µm step size) to generate a Z-stacked image. Background fluorescence was subtracted with Fluoview (Olympus) Background Correction Tool to generate final images. A line was drawn along two perpendicular axes of each nucleus (see Figures 2, 3, and 4) using ImageJ (National Institutes of Health) Plot Profile tool. The output reports pixel intensity values averaged across the width of the line (300 pixels = ∼390 µm) for each pixel (∼0.77 µm) along the length of the line. The plots presented are an average of profiles from three comparable sections.
FIGURE 2.
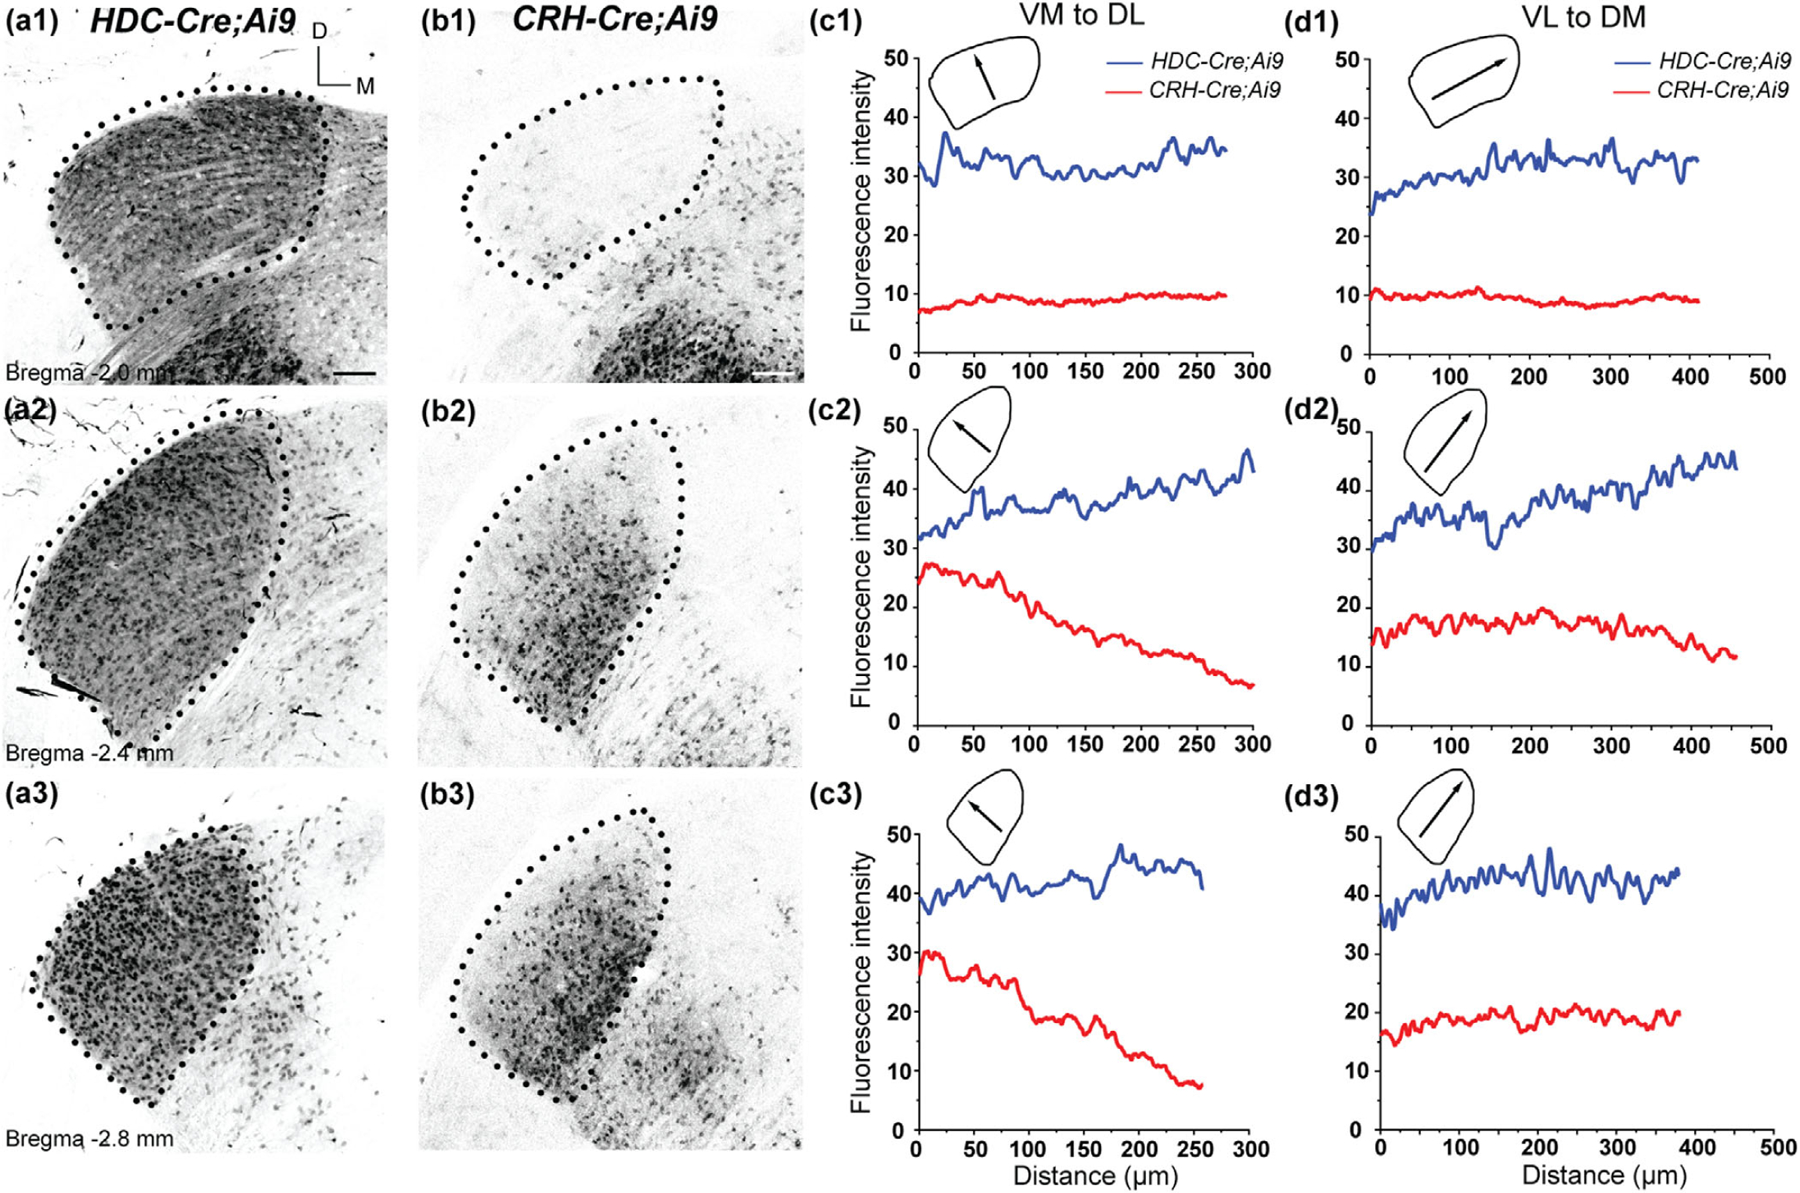
Pattern of tdTomato labeling in the dLGN of HDC-Cre;Ai9 and CRH-Cre;Ai9 mice. (a, b) Coronal sections of the dLGN in P28 HDC-Cre;Ai9 (a) and CRH-Cre;Ai9 (b) mice. In HDC-Cre;Ai9, somatic tdTomato labeling is present throughout the nucleus in the rostral (a1), middle (a2), and caudal (a3) dLGN. In CRH-Cre;Ai9, labeling was largely absent in the rostral dLGN (b1) but present in the ventro-medial regions of the middle (b2) and caudal (b3) dLGN. Dotted lines delineate the boundaries of the dLGN. Scale bar = 100 µm. (c, d) Average fluorescence intensity plotted for orthogonal axes in the dLGN of HDC-Cre;Ai9 (blue) and CRH-Cre;Ai9 (red) mice. Lines were drawn along the ventromedial to dorsolateral (VM-to-DL; c1–c3) and ventrolateral to dorsomedial (VL-to-DM; d1–d3) axes of the dLGN. Schematics depict the direction of the plotted profile line (arrows) relative to the boundaries of the nucleus at each rostro-caudal location
FIGURE 3.
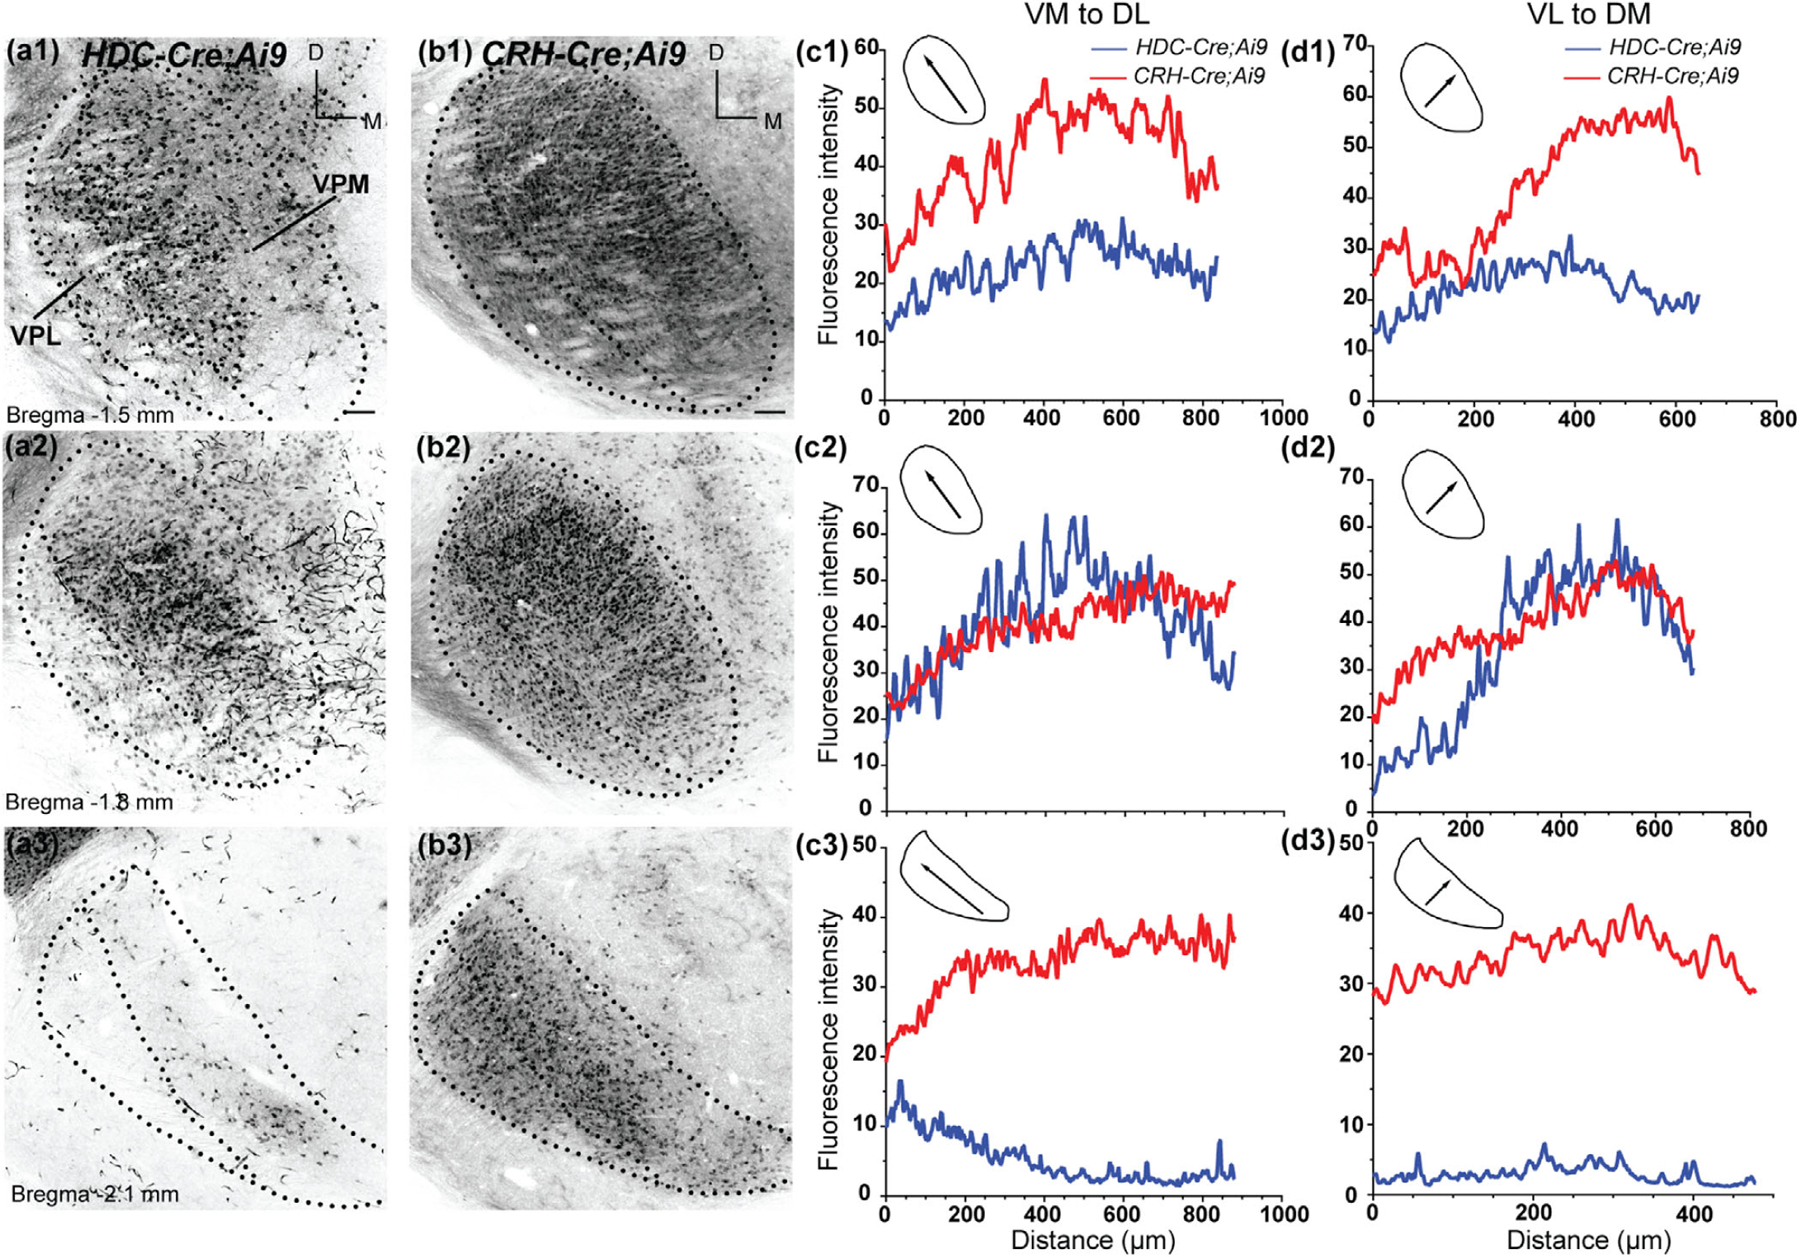
Pattern of tdTomato labeling in the VB of HDC-Cre;Ai9 and CRH-Cre;Ai9 mice. (a-b) Coronal sections of the VB in P28 HDC-Cre;Ai9 (a) and CRH-Cre;Ai9 (b) mice. In HDC-Cre;Ai9, somatic tdTomato labeling is present throughout the rostral (a1), and middle (a2) VB, and restricted to a small region in the ventromedial region of caudal VB (a3). In CRH-Cre;Ai9, labeling was present throughout the rostro-caudal extent of the VB (b1–b3). Scale bar = 100 µm. (c, d) Average fluorescence intensity plotted for orthogonal axes in the VB of HDC-Cre;Ai9 (blue) and CRH-Cre;Ai9 (red) mice. Fluorescence was measured along the VM-to-DL (c1–c3) and VL-to-DM (d1–d3) axes of the VB. Schematics depict the direction of the plotted profile (arrows) relative to the boundaries of the nucleus at each rostro-caudal location
FIGURE 4.
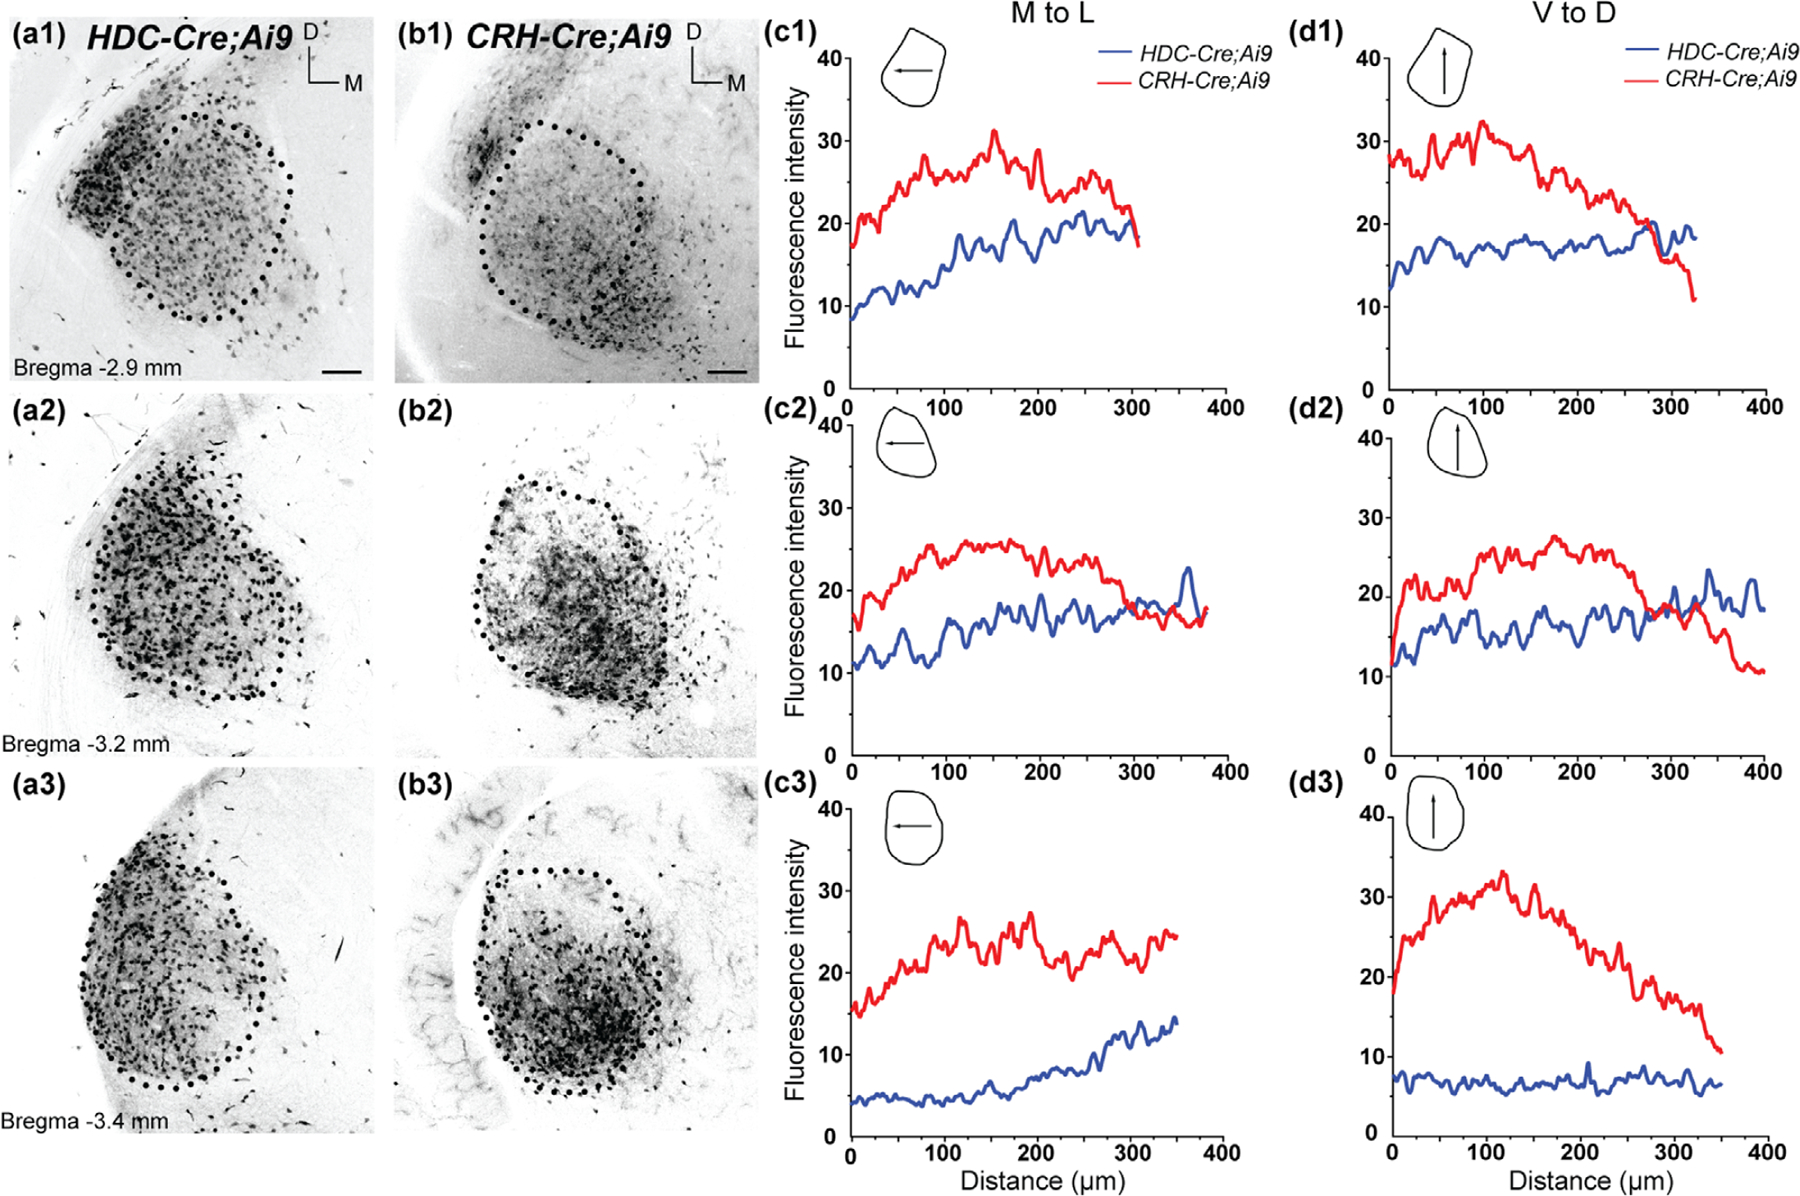
Pattern of tdTomato labeling in the ventral division of the medial geniculate nucleus (MGNv) of HDC-Cre;Ai9 and CRH-Cre;Ai9 mice. (a, b) Example coronal sections of the MGNv in P28 HDC-Cre;Ai9 (a) and CRH-Cre;Ai9 (b) mice. In HDC-Cre;Ai9, and CRH-Cre;Ai9 and somatic tdTomato labeling is present throughout the rostral (a1), middle (a2), and caudal (a3) MGNv. Scale bar = 100 µm. (c, d) Average fluorescence intensity plotted for orthogonal axes in the MGNv of HDC-Cre;Ai9 (blue) and CRH-Cre;Ai9 (red) mice. Fluorescence was measured along the medial to lateral (M-to-L; c1-c3) and ventral to dorsal (V-to-D; d1-d3) axes of the MGNv. Schematics depict the direction of the plotted profile line (arrows) relative to the boundaries of the nucleus at each rostro-caudal location
To acquire confocal images of dLGN inhibitory interneurons labeled with antibody, a 20 × objective (0.75 NA) was used to take images of successive optical sections (2.5-µm steps) in the dLGN. AF-488 and tdTomato fluorescence were imaged with 488-nm and 546-nm lasers using sequential scanning mode. Fluoview 10 software (Olympus) region-of-interest tool was used to manually mark the somata of putative dLGN interneurons and to check for overlapping labeling by AF-488 and tdTomato. Care was taken to avoid double-counting of the same neurons across optical sections in the Z-plane. Due to the limited penetration of the GAD-65/67 antibody, analysis was limited to optical sections taken 30 µm from the surface.
Biocytin-filled neurons were imaged using laser confocal microscopy. A 40x objective was used to take successive images across the Z-plane (0.4-µm step size) using 647-nm laser to detect streptavidin AF-647 fluorescence. All optical sections were collapsed into a Z-stack to generate the final image.
2.4. |. Slice preparation and in vitro recording
For in vitro electrophysiological slice recordings, HDC-Cre;Ai32 and CRH-Cre;Ai32 mice aged P19-P23 were anesthetized deeply with isoflurane vapors (4%) and decapitated. Next, brains were excised and placed into cold oxygenated sucrose solution containing (in mM): sucrose 234, glucose 11, KCl 2.5, CaCl2 0.5, MgSO4 10, NaH2PO4 1.25, NaHCO3 26. Coronal 270-µm-thick sections containing the primary visual cortex or thalamic reticular nucleus were cut with a vibratome (Leica VT1200S). Next, slices were incubated in an oxygenated artificial cerebrospinal fluid (ACSF) containing (in mM): NaCl 126, NaHCO3 26, glucose 10, KCl 2.5, MgCl2 2, CaCl2 2, NaH2PO4 1.25. Slices were first incubated for 30 min at 32◦C and then returned to room temperature. For recordings, slices were transferred to a recording chamber perfused with oxygenated ACSF (3 ml/min) and maintained at 32°C. A microscope equipped with differential interference contrast optics (Olympus) was used to visualize tissue and neurons using 10x and 60x objectives, respectively. Enhanced yellow fluorescent protein (eYFP) fluorescence was visualized using a mercury vapor light source filtered through a CY3 filter cube (Olympus). Borosilicate patch electrodes were created using a two-step vertical puller (Narashige PC-10). The internal electrode solution contained (in mM): K-gluconate 117, KCl 13, MgCl2 1, CaCl2 0.07, EGTA 0.1, HEPES 10, Na2-ATP 2, Na-GTP 0.4. In some cases, biocytin (0.1–0.2% w/v; Molecular Probes) was added to the internal solution to fill the cell for subsequent morphological reconstruction. The final tip resistance of patch electrodes was 8–12 mΩ. Whole-cell recordings were made using Multiclamp 700B amplifier (Molecular Devices), filtered at 3–10 kHz, and digitized using Digidata 1440A (Molecular Devices). Pipette capacitance, membrane resistance, and whole-cell capacitance were constantly monitored during recordings. Photoactivation of TC axonal terminals expressing Channelrhodopsin-2 (ChR2)-eYFP was accomplished using a light-emitting diode (Prizmatix), which delivered pulses of blue light (1 ms.) through a 60x water immersion objective. After completion of recordings, slices containing biocytin-filled neurons were fixed in 4% PFA and incubated overnight in 1:100 streptavidin AF-647 (Jackson ImmunoResearch Labs Cat# 016–600-084, RRID:AB2341101) in PBS. The next day, slices were washed in PBS and mounted on glass slides using the aforementioned procedures.
3 |. RESULTS
To visualize the pattern of Cre expression within the thalamus, Olig3-Cre, HDC-Cre, and CRH-Cre mice were crossed to a reporter line (Ai9) that provides Cre-dependent expression of the red fluorescent protein tdTomato (Madisen et al, 2010). Coronal sections of the dorsal thalamus of P30 mice heterozygous for Ai9 and Olig3-Cre, HDC-Cre, or CRH-Cre reveal the expression in the thalamic nuclei (Figure 1). The expression pattern differed between these Cre drivers as did the regional distribution of cells expressing tdTomato within each thalamic nucleus.
Olig3-Cre yielded tdTomato expression broadly throughout the entire thalamus, including the dorsal, anterior, midline, and lateral divisions (Figure 1a1–a3). Somatic tdTomato labeling was present throughout the FO nuclei of the dorsal thalamus including the dLGN (vision), ventral medial geniculate nucleus (MGNv; audition), and ventrobasal complex (VB; somatosensation). Tdtomato labeling was also evident in HO thalamic nuclei including pulvinar (PUL), dorsal and medial divisions of MGN (MGNd and MGNm), and the posterior nucleus (Po). In addition, the thalamic reticular nucleus (TRN; Figure 1a1) contained labeled cells as did the ventral lateral geniculate nucleus (vLGN; Figure 1a2). Oligodendrocytes also expressed tdTomato and were broadly distributed within the neuropil of the thalamus (data not shown).
HDC-Cre restricted tdTomato expression predominantly to the FO nuclei of the thalamus, including dLGN, MGNv, and VB (Figure 1b1–b3). Sparse and scattered neuronal tdTomato labeling was also seen in HO nuclei such as the PUL and Po. While no somatic labeling was observed in the TRN, labeled TC axons could be seen coursing through the nucleus en route to the neocortex (Figure 1b1). In addition to thalamic neurons, HDC-Cre also yielded tdTomato expression in some astrocytes. These cells were sparsely distributed and present throughout the thalamus and cortex. The choroid plexus also expressed tdTomato, appearing as a bright band of fluorescence along the walls of the ventricles (shown in subsequent figures).
CRH-Cre primarily targeted FO thalamic nuclei, though a small number of cells labeled with tdTomato were also present in HO nuclei such as PUL and Po (Figure 1c1–c3). In the TRN, only axonal labeling was observed. While the same FO thalamic nuclei were targeted by HDC-Cre and CRH-Cre, the two lines displayed conspicuous differences in the distribution of labeled neurons within the dLGN and VB (Figure 1b1 vs. c1, b2 vs. c2).
In HDC-Cre;Ai9, the dLGN was uniformly labeled with neurons throughout the entire extent of the nucleus (Figure 1b1–b2). In CRH-Cre;Ai9, the rostral dLGN was largely devoid of labeled neurons, while in more caudal areas labeled neurons were found in the ventromedial regions (Figure 1c1–c2). Conversely, in HDC-Cre, the caudal regions of the VB complex exhibited almost no cellular labeling while CRH-Cre labeled neurons with tdTomato throughout much of the nucleus (Figure 1b2 vs. c2).
We examined the regional distribution of tdTomato fluorescence in the dLGN, MGNv, and VB across the dorso-ventral, medio-lateral, and rostro-caudal axes. We plotted the fluorescence intensity profiles averaged across three sections along two perpendicular axes at three rostro-caudal locations for each FO relay nucleus (Figures 2, 3, and 4). In the dLGN of HDC-Cre;Ai9, the distribution of fluorescence intensity displayed little variation along the ventromedial to dorsomedial
(VM-to-DL) and ventrolateral to dorsomedial) VL-to-DM axes across the caudo-rostral extent of the nucleus (Figure 2a1–a3,c1–c3,d1–d3). In CRH-Cre;Ai9, rostral dLGN exhibited fluorescence barely above background levels (Figure 2b1,c1,d1). In the middle and caudal dLGN, fluorescence intensity was stable across the VL-to-DM axis but revealed a decreasing gradient of fluorescence in the VM-to-DL axis (Figure 2b2–b3,c2–c3,d2–d3). There was a discernable absence of labeling in the dorsal aspect of dLGN that runs parallel to the optic tract, a region that corresponds to the dorsolateral shell subdivision (Cruz-Martin et al., 2014; Grubb & Thompson, 2003; Reese, 1988). In the ventral posteriolateral (VPL) and ventral posteriomedial (VPM) nuclei that constitute VB, HDC-Cre;Ai9, somatic tdTomato labeling was present in the rostral and middle regions of the VB, with relatively higher fluorescence levels in the dorsolateral and dorsomedial regions (Figure 3a1–a2,c1–c2,d1–d3). However, the caudal VB contained only a small number of neurons that occupied a small area within the ventro-medial region of VPM (Figure 3a3,c3,d3). Similar to the pattern seen in HDC-Cre;Ai9, CRH-Cre;Ai9-labeled neurons in the rostral and middle VB, with higher fluorescence in the dorsolateral and dorsomedial areas (Figure 3b1,b2,c1,c2,d1,d2). Unlike HDC-Cre;Ai9, CRH-Cre extensively labeled the entirety of the caudal VB (Figure 3b3,c3,d3).
Expression patterns in the rostral and middle regions of MGNv were largely similar between HDC-Cre;Ai9 and CRH-Cre;Ai9 (Figure 4). The fluorescence intensity profiles were consistent across the medial to lateral and dorsal to ventral axes (Figure 4a1,a2,b1,b2,c1,c2,d1,d2). However, subtle differences were noted in the caudal MGNv, where HDC-Cre;Ai9 labeled more neurons in the lateral aspect, while CRH-Cre;Ai9 labeled more neurons in the ventral aspect (Figure 4a3,b3,c3,d3).
Unlike VB and MGNv, the mouse dLGN contains a substantial population of intrinsic GABAergic interneurons (Charalambakis et al., 2019; Evangelio et al., 2018; Golding et al., 2014; Jaubert-Miazza et al., 2005; Seabrook et al., 2013; Su et al., 2020). CRH-Cre does not target dLGN interneurons (Monavarfeshani et al., 2018). We examined whether Olig3-Cre or HDC-Cre label these interneurons. We stained dLGN interneurons using an antibody for glutamic acid decarboxylase-65/67 (GAD-65/67) in Olig3-Cre;Ai9 (Figure 5a1,a2) and HDC-Cre;Ai9 mice (Figure 5b1,b2). None of the dLGN interneurons identified by GAD-65/67 antibody expressed tdTomato in either Olig3-Cre;Ai9 (n = 0/87 cells) or HDC-Cre;Ai9 (n = 0/152 cells). Thus, CRH-Cre, Olig3-Cre, and HDC-Cre label excitatory TC relay neurons in the dLGN.
FIGURE 5.
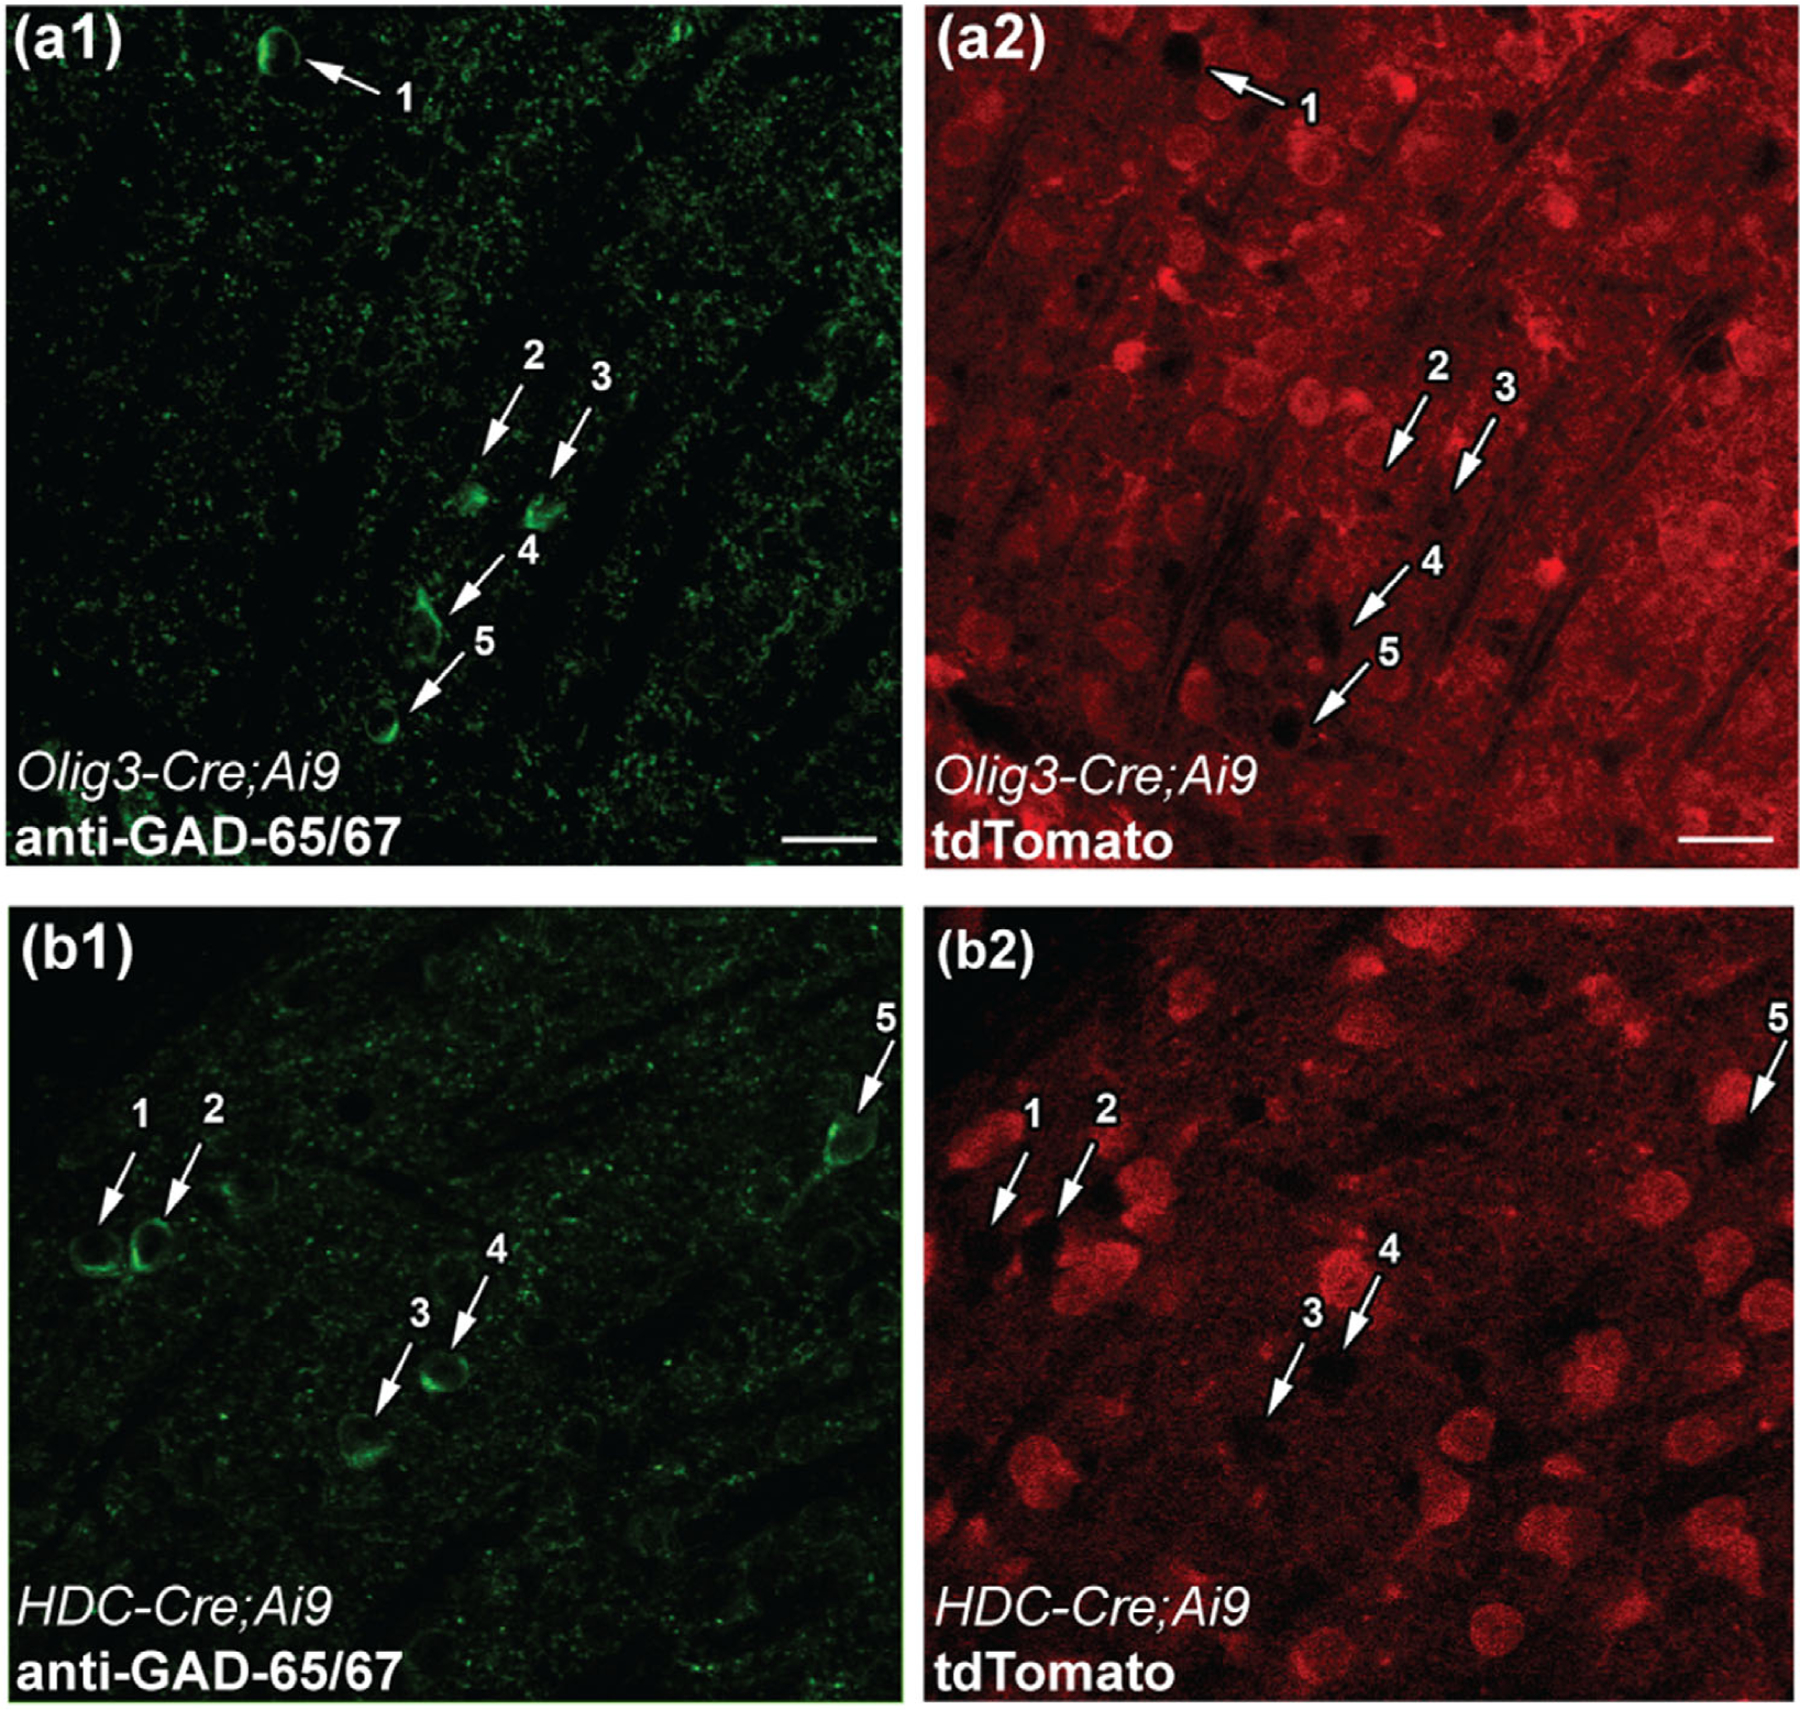
Identification of intrinsic interneurons in the dLGN of Olig3-Cre;Ai9 and HDC-Cre;Ai9 mice. (a, b) Examples of dLGN interneurons stained with an antibody against GAD-65/67 and corresponding tdTomato labeling in Olig3-Cre;Ai9 (a1, a2) and HDC-Cre;Ai9 (b1, b2) mice. Arrows indicate the somata of putative dLGN interneurons stained with GAD-65/67 antibody (a1, b1), and the absence of tdTomato labeling in the same cells (a2, b2). Scale bars = 10 µm
Overall, Cre-dependent expression of tdTomato was limited to the thalamus (and hypothalamus) for all three Cre drivers. We did not observe somatic tdTomato expression in any pretectal nuclei, including the anterior pretectal nucleus, olivary pretectal nucleus, post pretectal nucleus, or medial pretectal nucleus (data not shown). In addition, we did not detect tdTomato expression in the zona incerta or subthalamic nucleus of the prethalamus, with the exception of the dorsal zona incerta of the Olig3-Cre (data not shown).
To determine the onset of Cre activity in Olig3-Cre, HDC-Cre, and CRH-Cre, we examined tdTomato expression at early postnatal ages. TC cells of FO nuclei expressed tdTomato at the time of natural birth (P0) for all three Cre drivers (Figure 6a1,b1,c1). These expression patterns remained consistent across the first 2 weeks (P7 and P14) of postnatal life and into adulthood (Figure 6a2,a3,b2,b3,c2,c3).
FIGURE 6.
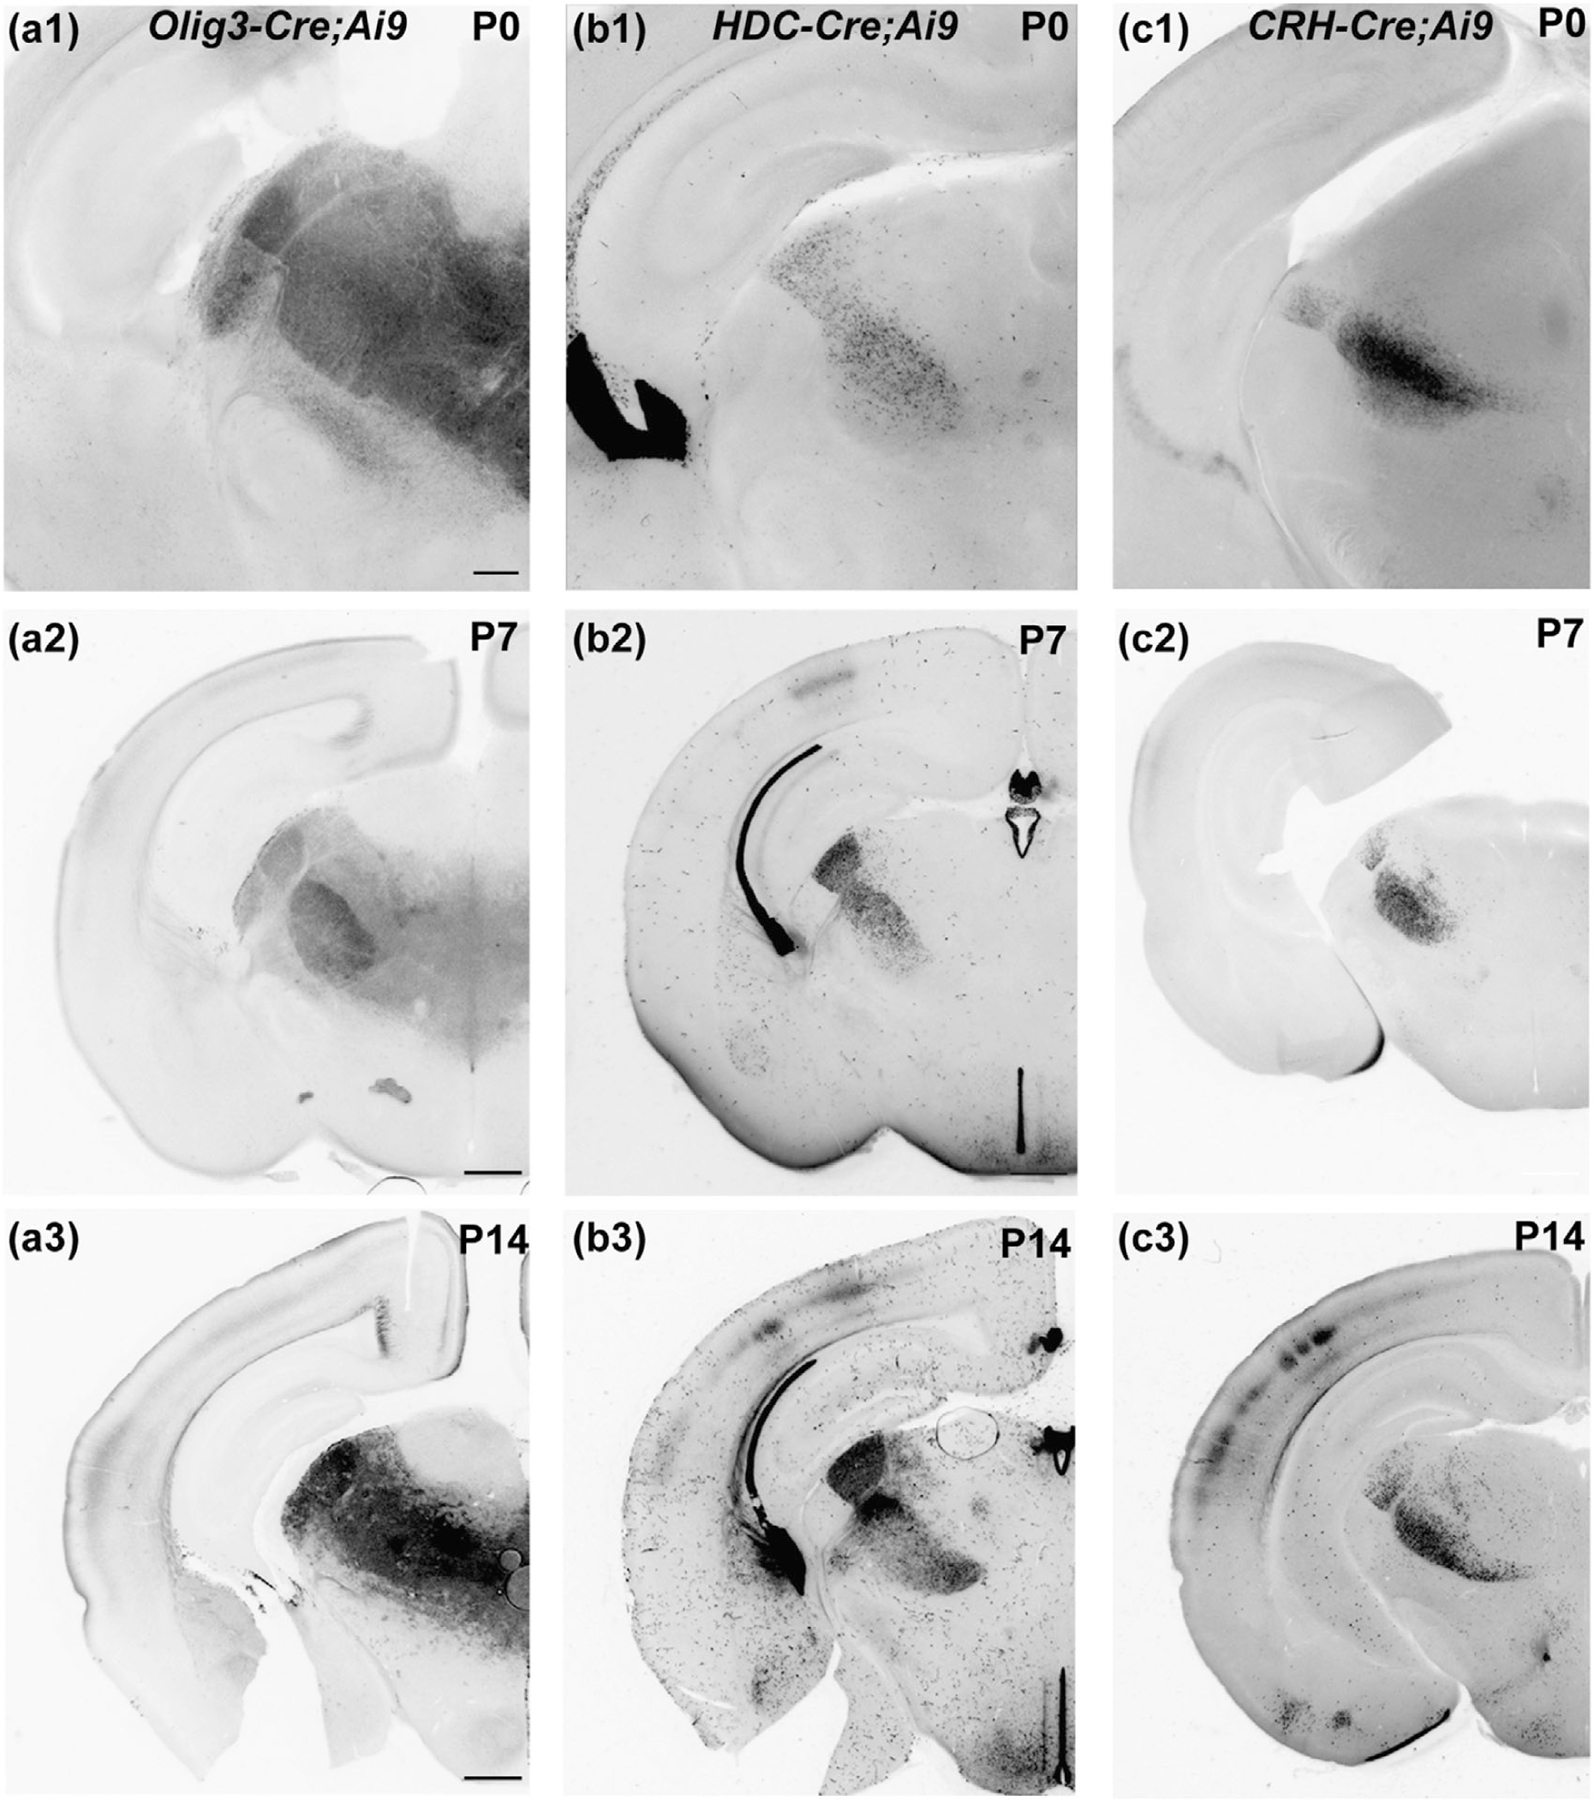
Pattern of tdTomato expression in the dorsal thalamus of Olig3-Cre;Ai9, HDC-Cre;Ai9, and CRH-Cre;Ai9 mice during the first 3 postnatal weeks of development. (a–c) Examples coronal sections of the dorsal thalamus in Olig3-Cre;Ai9 (a), HDC-Cre;Ai9 (b), and CRH-Cre;Ai9 (c) mice. Scale in (a1), (b1), and (c1) = 200 µm. Scale in (a2, a3), (b2, b3), and (c2, c3) = 500 µm
We also examined the pattern of cortical innervation by axons of TC neurons in adult Olig3-Cre, HDC-Cre, and CRH-Cre mice revealed by tdTomato expression. TC axons were evident in the white matter and formed a dense band of arborizations in one or more layers of the primary somatosensory (S1), auditory (A1), and visual (V1) cortices (Figure 7) for all three Cre drivers. Innervation of the barrel field (Layer 4 (L4)) and deeper cortical layers (L5 and L6) by TC axons expressing tdTomato was evident in S1 (Figure 7a1,b1,c1). Similarly, all three lines showed innervation of L4 within A1 and V1 (Figure 7a2,a3,b2,b3,c2,c3). We did not examine thalamic projections to noncortical targets including striatum, amygdala, or cerebellum (Clasca et al., 2012; Smith et al., 2004; Wolff et al., 2015).
FIGURE 7.
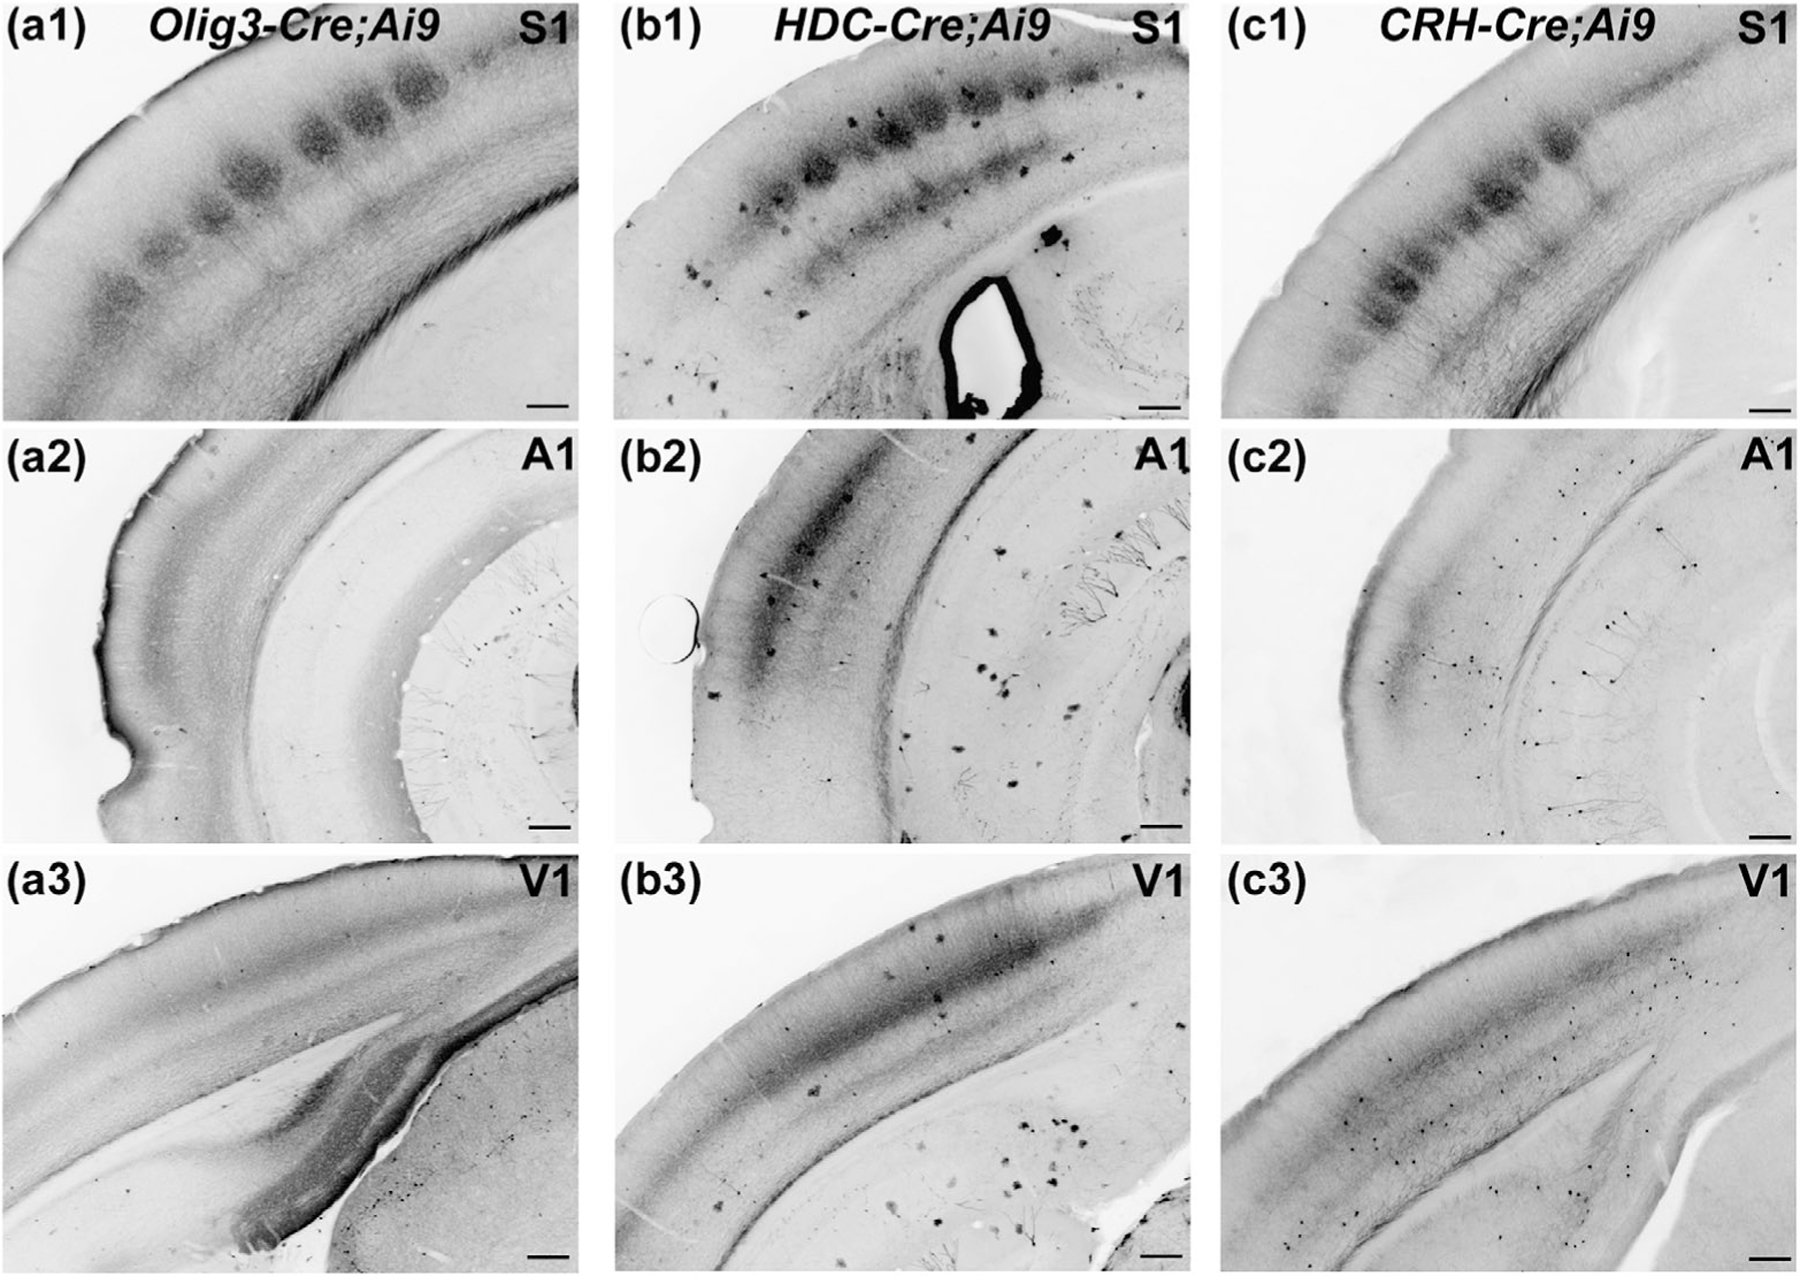
Pattern of axonal tdTomato labeling in the sensory cortices of Olig3-Cre;Ai9, HDC-Cre;Ai9, and CRH-Cre;Ai9 mice. (a–c) Coronal sections of the cortex in Olig3-Cre;Ai9 (a), HDC-Cre;Ai9 (b), and CRH-Cre;Ai9 (c) mice showing axonal tdTomato labeling in primary somatosensory cortex (S1; a1, b1, and c1), auditory cortex (a2, b2, and c2), and visual cortex (V1; a3, b3, and c3). Thalamocortical axons labeled with tdTomato innervated the barrels in S1 (a1, b1, and c1), and Layer 4 of the auditory (a2, b2, and c2) and visual (a3, b3, and c3) cortex. Scale bars = 200 µm
To evaluate the utility of these Cre drivers for functional studies of TC circuits, we performed optogenetic experiments by using in vitro whole-cell patch-clamp recordings in acutely prepared brain slices that contained visual cortex or TRN. We expressed the fusion of ChR2 and eYFP (ChR2-eYFP) in thalamic neurons from the Cre-dependent expression locus Ai32 with HDC-Cre or CRH-Cre. Expression of ChR2-eYFP in TC terminals was sufficient to drive neurotransmitter release upon stimulation of the tissue with blue light (5 mW or less). In L4, neurons of the visual cortex (see biocytin reconstructions in Figure 8a2,b2), a train of blue light pulses (1 ms/10 Hz) evoked large excitatory post-synaptic currents (EPSCs) that were time-locked to the onset of each light pulse (Figure 8a1,b1,c1). Repeated stimulation of TC afferents resulted in successively smaller EPSCs, consistent with synaptic depression typically observed in TC inputs to L4 pyramidal neurons (Gil et al., 1997, 1999; Kloc & Maffei, 2014). We could also use these mice to examine the synaptic responses of TRN neurons, which receive input from TC axon collaterals (see biocytin reconstructions in Figure 8c2). Similar to the response profile observed in L4 of V1, repetitive blue light stimulation of TC collaterals in TRN led to large EPSCs in TRN neurons that reliably followed a 10 Hz stimulus train with each successive response showing a progressive decrease in amplitude (Figure 8c1).
FIGURE 8.
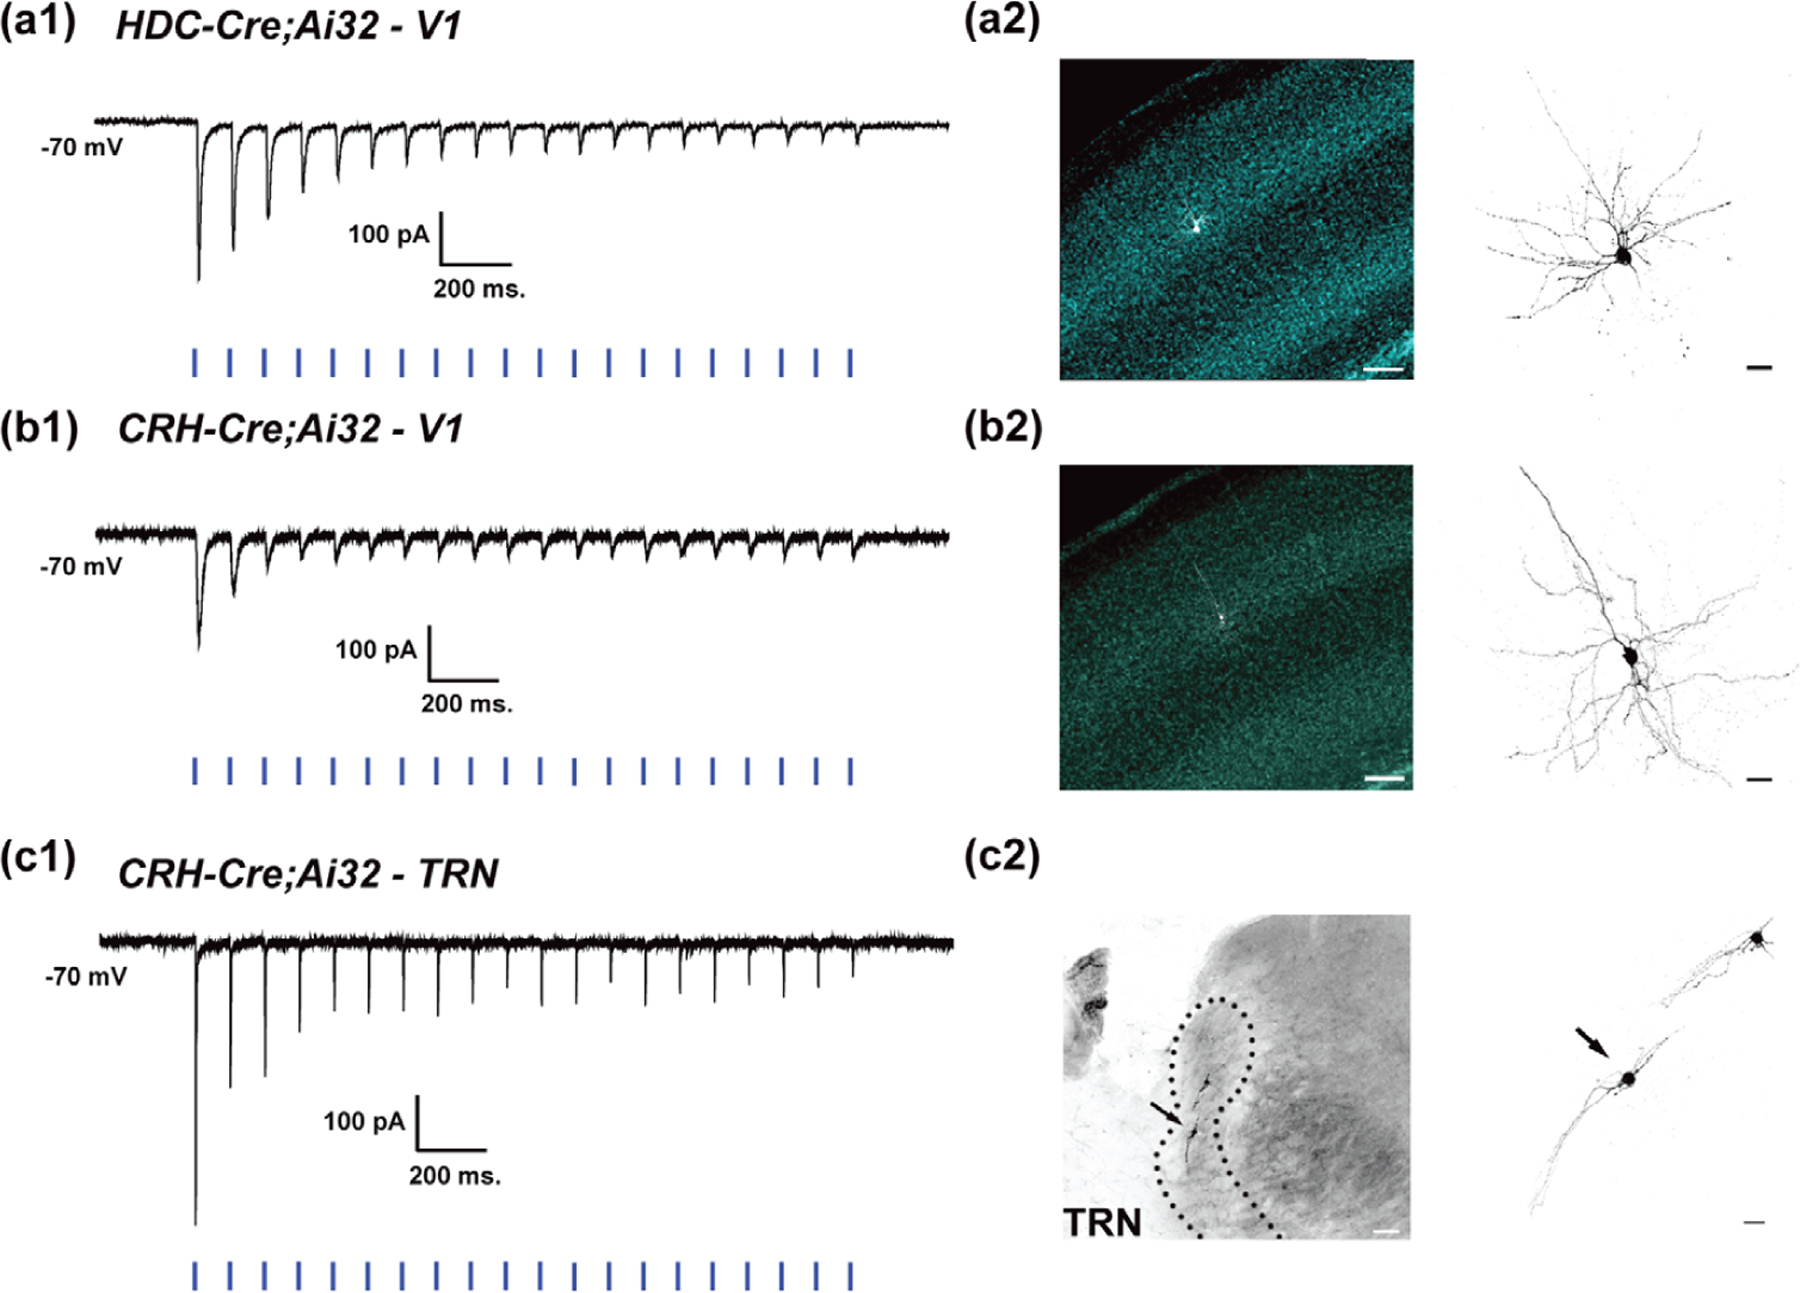
Light-evoked post-synaptic responses in HDC-Cre;Ai32 (V1) and CRH-Cre;Ai32 (V1 and TRN) mice. (a1–c1) Examples of whole-cell in vitro electrophysiological recordings from neurons in V1 of P19 HDC-Cre;Ai32 and CRH-Cre;Ai32 mice (a and b), and TRN of P29 CRH-Cre;Ai32 mice (c). In voltage clamp (VH = −70 mV), repetitive stimulation with brief pulses of blue light (10 Hz/1 ms) leads to trains of excitatory post-synaptic currents with successively smaller amplitudes in V1 of HDC-Cre;Ai32 (a1) and CRH-Cre;Ai32 (b1) mice and TRN of CRH-Cre;Ai32 mice (c1). (a2–b2) Reconstructions of V1 neurons filled with biocytin during recordings shown in a1 and b1. Left: Low magnification images depicting the locations of filled neurons in sections stained for Hoescht 33,342. Scale bars = 100 µm. Right: High magnification images of the reconstructed neurons. Scale bars = 20 µm. (c2) Reconstruction of TRN neurons filled with biocytin. Left: Low magnification image depicting the location of the TRN neurons. Scale bar = 50 µm. Right: High magnification image of the reconstructed TRN neuron morphologies. Arrow indicates the neuron associated with recording shown in (c1). Scale bar = 20 µm
4 |. DISCUSSION
The Cre driver lines Olig3-Cre, HDC-Cre, and CRH-Cre yield reporter expression in overlapping expression patterns in the thalamus (Table 2). Olig3-Cre had the most widespread expression, targeting FO and HO relay nuclei of the dorsal thalamus, as well as other divisions of the thalamus such as the medial dorsal nucleus. In contrast, HDC-Cre and CRH-Cre displayed more restricted patterns of expression, largely targeting FO relay nuclei of the dorsal thalamus, with limited expression in TC neurons of HO nuclei.
TABLE 2.
Pattern of somatic tdTomato expression in thalamic nuclei of Olig3-Cre;Ai9, HDC-Cre;Ai9, and CRH-Cre;Ai9 mice
| First-order relays | Olig3-Cre;Ai9 | HDC-Cre;Ai9 | CRH-Cre;Ai9 |
|---|---|---|---|
| Dorsal lateral geniculate nucleus | Whole nucleus | Whole nucleus | Caudal, middle, ventromedial |
| Ventral division of the medial geniculate nucleus | Whole nucleus | Rostral, middle | Whole nucleus |
| Ventrobasal complex | Whole nucleus | Rostral, middle | Whole nucleus |
| Higher-order relays | |||
| Pulvinar | Whole nucleus | Caudal, lateral | Caudal, ventral |
| Posterior nucleus | Whole nucleus | Scattered | Scattered |
| Medial and dorsal divisions of themedial geniculate nucleus | Whole nucleus | No Expression | No expression |
| Non-thalamocortical nuclei | |||
| Thalamic reticular nucleus | Whole nucleus | No expression | No expression |
| Ventral lateral geniculate nucleus | Whole nucleus | No expression | No expression |
These different expression patterns provide an opportunity to explore the contribution of FO and HO TC pathways in the sensory system. For example, Olig3-Cre is suited for examining the total contribution of TC input and comparing it to FO relays isolated with HDC-Cre and CRH-Cre. It is important to note that the CRH-Cre line we examined here is the transgenic KN282 line developed by GENSAT (Gerfen et al., 2013). The expression pattern of this Cre driver is distinct from the “knock-in” CRH-IRES-Cre line that does not display Cre expression in the thalamus (Taniguchi et al., 2011).
The differences in expression profile in dLGN by HDC-Cre and CRH-Cre could also be employed to investigate parallel visual pathways within the dLGN. Previous studies have shown that the rodent dLGN contains two functional subdivisions. The ventromedial “core” contains TC relay neurons with X-like and Y-like morphologies and receives input from retinal ganglion cells (RGCs) that have concentric center-surround organization and little preference for stimulus direction or orientation, whereas the surrounding dorsolateral “shell” contains W-like relay cells and receives input from direction-selective RGCs (Bickford et al., 2015; Cruz-Martin et al., 2014; Dhande & Huberman, 2014; Grubb & Thompson, 2003; Huberman et al., 2009; Reese, 1988; Sun et al., 2006). Indeed, we found that the expression pattern of CRH-Cre appears restricted to the core subdivision and excludes the dorsolateral shell, and thus selectively targets a subset of TC relay cells within the core (Monavarfeshani et al., 2018; Su et al., 2020). Interestingly, TCs in the dLGN shell and core project to different layers of the visual cortex, with the shell innervating the superficial layers and the core the deeper layers suggesting that RGCs projecting to these different layers comprise separate visual pathways (Bickford et al., 2015; Cruz-Martin et al., 2014; Grubb & Thompson, 2003; Kerschensteiner & Guido, 2017). By comparison, the patterns seen in VB and MGNv do not appear to correspond to any known functionally distinct regions.
These lines can also be used to explore trans-thalamic connections, especially between sensory thalamic nuclei and the TRN. Indeed, a study employing Cre-dependent virus and the CRH-Cre line revealed that the mouse TRN contains nonoverlapping sensory modality-specific sectors (Sokhadze et al., 2019). This organization is similar to that of other mammals (Jones, 1975; Montero et al., 1977; Ohara & Lieberman, 1985).
It is important to note for at least two of these Cre driver lines, reporter expression is not limited to TC excitatory neurons in thalamic relay nuclei. The expression occurs in glial cells (e.g., oligodendrocytes in Olig3-Cre and astrocytes in HDC-Cre), as well as other nonneuronal brain tissue (e.g., choroid plexus in HDC-Cre). Moreover, Olig3-Cre yields reporter expression in GABAergic neurons of other thalamic nuclei including the TRN and the vLGN. However, staining for GAD-65/67 revealed that Cre is not expressed by interneurons of dLGN in any of these lines. Another Cre driver, Scnn1a-Tg3-Cre, also targets the dorsal thalamus. Unfortunately, this Cre driver is not as useful for studying TC circuitry because Cre is also expressed in cortical thalamorecipient neurons in L4 of the primary sensory cortices (Madisen et al., 2010; Stephany et al., 2018). We did not evaluate Cre activity outside the brain.
A major advantage of using Cre driver lines is their utility for conducting developmental studies. Combining these Cre drivers with Cre-dependent alleles for fluorescent proteins (e.g., Ai9) and channelrhodopsins (e.g., Ai32) permits visualization and manipulation of thalamic circuitry without the need for histochemical staining or surgical procedures. Cre expression in each of these drivers yields robust tdTomato expression by the time of natural birth. Furthermore, the anatomical pattern of expression remained consistent from early postnatal ages into adulthood. Consequently, these Cre drivers may be advantageous for studying the postnatal formation and refinement of TC, as well as trans-thalamic circuits (Agmon et al., 1993; Erzurumlu & Gaspar, 2012; Gurung & Fritzsch, 2004; Rebsam et al., 2002; Senft & Woolsey, 1991). Since we limited our characterization to only the postnatal period (as early P0), the exact embryonic age at which Cre onset occurs is not clear. Depending on the exact timing of Cre expression onset, these Cre drivers may label subpopulations of nascent thalamic neurons during embryonic dendritic branch development and axonal pathfinding (Angevine, 1970; El-Danaf et al., 2015; Godement et al., 1984; Jaubert-Miazza et al., 2005). Future work will be required to pinpoint the precise point in development when these Cre drivers are active.
Intracranial injection of a virus is a prominent technique to target thalamic neurons for manipulation (Hooks et al., 2013; Roman Roson et al., 2019; Zhou et al., 2018). However, this approach has several limitations that are alleviated by these Cre drivers. First, viral injections often suffer from variability in the location and number of targeted thalamic neurons. This complicates the comparison of experimental results between subjects and studies. Second, the accuracy of injections of virus in young mice is technically challenging and can impede studies requiring visualization of circuits during early postnatal development. In addition, the incubation time required to achieve sufficient expression of the gene products often constrains the minimum age at which experiments can be performed. Cre drivers combined with Cre-dependent alleles for expression of specific gene products provide more consistent expression between mice (Madisen et al., 2012). Furthermore, the Cre drivers provide early onset of Cre activity sufficient to label thalamic neurons with fluorescent proteins as early as P0.
Combining these Cre drivers with Cre-dependent reporter lines to target the thalamus also has limitations. For example, experiments that require a high degree of regional specificity, such as targeting a single nucleus or a single hemisphere, would not be compatible with this genetic approach, as Cre is expressed within multiple thalamic nuclei and outside of the thalamus (e.g., hypothalamus). However, specificity can be enhanced with the delivery of adeno-associated viruses that rely on preceding Cre recombination, similar to the Tet-controllable strains (Daigle et al., 2018; Lee et al., 2017; Sabatini et al., 2021). The advantages of this combination are the high level of targeting specificity afforded by Cre lines and the strong promoters available for viral vectors. Previous work has demonstrated that CRH-Cre mice have sufficient Cre activity during adulthood to allow for Cre-dependent expression of adeno-associated viruses (Sokhadze et al., 2019). In contrast, Cre expression in the thalamus is transient during development for HDC-Cre (Zecharia et al., 2012). However, this Cre activity is sufficient to induce reporter expression sustained in the adult thalamus of HDC-Cre mice.
We demonstrate with electrophysiological recordings that these lines can be combined readily with optogenetics to stimulate the afferents and collaterals of thalamic neurons. Previously, we employed the HDC-Cre;Ai32 mice to examine the consequences of early monocular deprivation on the balance of excitation and inhibition evoked by TC inputs onto pyramidal neurons in L4 of the primary visual cortex (Frantz et al., 2020). Here, we demonstrate that the expression pattern of HDC-Cre is suitable to examine TC synaptic properties in other sensory modalities as well.
In addition to disentangling the anatomical and functional features of TC interactions, these Cre driver lines could prove useful for transcriptomic studies (Dueck et al., 2015). One possibility involves using fluorescence-assisted cell sorting in conjunction with RNA-sequencing to examine transcriptomes of Cre-expressing neurons (Bakken et al., 2018; Tasic et al., 2018). A recent transcriptomic analysis of the vLGN in GAD2-Cre;GFP line revealed that neurons with similar transcriptomic profiles form several functionally distinct laminae in this nucleus (e.g., retinorecipient vs. nonretinorecipient; Sabbagh et al., 2020). Similar analyses could identify genes suitable for generating a next generation of Cre drivers with even greater specificity for thalamic cell types or nuclei (Wells et al., 2016).
Overall, these Cre drivers possess a range of expression patterns in the thalamus, which together with early onset of expression, offer significant advantages in visualization and manipulation of thalamic circuits in a highly selective manner.
ACKNOWLEDGMENTS
We thank Brandon Croslin and Barbara O’Steen for their technical assistance and management of the animal colony. We thank Andrew Huberman for the CRH-Cre transgenic mouse. This work was supported by NEI grants EY12716 (to W.G.) and EY21580 (to A.W.M.)
Funding information
NEI, Grant/Award Numbers: EY12716, EY21580
LIST OF ABBREVIATIONS
- A1
primary auditory cortex
- AF
AlexaFluor
- ChR2
Channelrhodopsin-2
- CRH
corticotrophin releasing hormone
- D
dorsal
- DL
dorsolateral
- dLGN
dorsal lateral geniculate nucleus
- DM
dorsomedial
- EPSC
excitatory post-synaptic current
- eYFP
enhanced yellow fluorescent protein
- FO
first order
- GAD
glutamic acid decarboxylase
- HDC
histidine decarboxylase
- HO
higher order
- IGL
intergeniculate leaflet
- IRES
internal ribosome entry site
- L
layer
- M
medial
- MGNd
dorsal division of the medial geniculate nucleus
- MGNm
medial division of the medial geniculate nucleus
- MGNv
ventral division of the medial geniculate nucleus
- NGS
normal goat serum
- Olig3
oligodendrocyte transcription factor 3
- P
postnatal day
- PBS
phosphate-buffered saline
- PFA
paraformaldehyde
- Po
posterior nucleus
- PUL
pulvinar
- RGC
retinal ganglion cell
- S1
primary somatosensory cortex
- TRN
thalamic reticular nucleus
- TC
thalamocortical
- V1
primary visual cortex
- VB
ventrobasal complex
- vLGN
ventral lateral geniculate nucleus
- VL
ventrolateral
- VM
ventromedial
- VPL
ventral posterolateral nucleus
- VPM
ventral posteromedial nucleus
Footnotes
PEER REVIEW
The peer review history for this article is available at https://publons.com/publon/10.1002/cne.25248
DATA AVAILABILITY STATEMENT
The data that support the findings of this study are openly available in Mendeley Data at https://data.mendeley.com/datasets/n2 × 9vvpj54/
REFERENCES
- Agmon A, Yang LT, O’Dowd DK, & Jones EG (1993). Organized growth of thalamocortical axons from the deep tier of terminations into layer IV of developing mouse barrel cortex. Journal of Neuroscience, 13(12), 5365–5382. [DOI] [PMC free article] [PubMed] [Google Scholar]
- Angevine JB Jr. (1970). Time of neuron origin in the diencephalon of the mouse. An autoradiographic study. Journal of Comparative Neurology, 139(2), 129–187. 10.1002/cne.901390202 [DOI] [PubMed] [Google Scholar]
- Bakken TE, Hodge RD, Miller JA, Yao Z, Nguyen TN, Aevermann B, Barkan E, Bertagnolli D, Casper T, Dee N, Garren E, Goldy J, Graybuck LT, Kroll M, Lasken RS, Lathia K, Parry S, Rimorin C, Scheuermann RH, . . . Tasic B (2018). Single-nucleus and single-cell transcriptomes compared in matched cortical cell types. Plos ONE, 13(12), e0209648. 10.1371/journal.pone.0209648 [DOI] [PMC free article] [PubMed] [Google Scholar]
- Bernstein JG, Garrity PA, & Boyden ES (2012). Optogenetics and thermogenetics: technologies for controlling the activity of targeted cells within intact neural circuits. Current Opinion in Neurobiology, 22(1), 61–71. 10.1016/j.conb.2011.10.023 [DOI] [PMC free article] [PubMed] [Google Scholar]
- Bickford ME, Zhou N, Krahe TE, Govindaiah G, & Guido W (2015). Retinal and tectal “driver-like” inputs converge in the shell of the mouse dorsal lateral geniculate nucleus. Journal of Neuroscience, 35(29), 10523–10534. 10.1523/JNEUROSCI.3375-14.2015 [DOI] [PMC free article] [PubMed] [Google Scholar]
- Campbell PW, Govindaiah G, Masterson SP, Bickford ME, & Guido W (2020). Synaptic properties of the feedback connections from the thalamic reticular nucleus to the dorsal lateral geniculate nucleus. Journal of Neurophysiology, 124(2), 404–417. 10.1152/jn.00757.2019 [DOI] [PMC free article] [PubMed] [Google Scholar]
- Charalambakis NE, Govindaiah G, Campbell PW, & Guido W (2019). Developmental remodeling of thalamic interneurons requires retinal signaling. Journal of Neuroscience, 39(20), 3856–3866. 10.1523/JNEUROSCI.2224-18.2019 [DOI] [PMC free article] [PubMed] [Google Scholar]
- Clasca F, Rubio-Garrido P, & Jabaudon D (2012). Unveiling the diversity of thalamocortical neuron subtypes. European Journal of Neuroscience, 35(10), 1524–1532. 10.1111/j.1460-9568.2012.08033.x [DOI] [PubMed] [Google Scholar]
- Cruz-Martín A, El-Danaf RN, Osakada F, Sriram B, Dhande OS, Nguyen PL, Callaway EM, Ghosh A, & Huberman AD (2014). A dedicated circuit links direction-selective retinal ganglion cells to the primary visual cortex. Nature, 507(7492), 358–361. 10.1038/nature12989 [DOI] [PMC free article] [PubMed] [Google Scholar]
- Daigle TL, Madisen L, Hage TA, Valley MT, Knoblich U, Larsen RS, Takeno MM, Huang L, Gu H, Larsen R, Mills M, Bosma-Moody A, Siverts La’ A, Walker M, Graybuck LT, Yao Z, Fong O, Nguyen TN, Garren E, . . . Zeng H (2018). A suite of transgenic driver and reporter mouse lines with enhanced brain-cell-type targeting and functionality. Cell, 174(2), 465–480 e422. 10.1016/j.cell.2018.06.035 [DOI] [PMC free article] [PubMed] [Google Scholar]
- DeNardo L, & Luo L (2017). Genetic strategies to access activated neurons. Current Opinion in Neurobiology, 45, 121–129. 10.1016/j.conb.2017.05.014 [DOI] [PMC free article] [PubMed] [Google Scholar]
- Dhande OS, & Huberman AD (2014). Retinal ganglion cell maps in the brain: implications for visual processing. Current Opinion in Neurobiology, 24(1), 133–142. 10.1016/j.conb.2013.08.006 [DOI] [PMC free article] [PubMed] [Google Scholar]
- Dueck H, Khaladkar M, Kim TK, Spaethling JM, Francis C, Suresh S, Fisher SA, Seale P, Beck SG, Bartfai T, Kuhn B, Eberwine J, & Kim J (2015). Deep sequencing reveals cell-type-specific patterns of single-cell transcriptome variation. Genome Biology, 16, 122. 10.1186/s13059-015-0683-4 [DOI] [PMC free article] [PubMed] [Google Scholar]
- El-Danaf RN, Krahe TE, Dilger EK, Bickford ME, Fox MA, & Guido W (2015). Developmental remodeling of relay cells in the dorsal lateral geniculate nucleus in the absence of retinal input. Neural Development, 10, 19. 10.1186/s13064-015-0046-6 [DOI] [PMC free article] [PubMed] [Google Scholar]
- Erzurumlu RS, & Gaspar P (2012). Development and critical period plasticity of the barrel cortex. European Journal of Neuroscience, 35(10), 1540–1553. 10.1111/j.1460-9568.2012.08075.x [DOI] [PMC free article] [PubMed] [Google Scholar]
- Evangelio M, Garcia-Amado M, & Clasca F (2018). Thalamocortical projection neuron and interneuron numbers in the visual thalamic nuclei of the adult C57BL/6 mouse. Frontiers in Neuroanatomy, 12, 27. 10.3389/fnana.2018.00027 [DOI] [PMC free article] [PubMed] [Google Scholar]
- Frantz MG, Crouse EC, Sokhadze G, Ikrar T, Stephany C-É, Nguyen C, Xu X, & Mcgee AW (2020). Layer 4 gates plasticity in visual cortex independent of a canonical microcircuit. Current Biology, 30(15), 2962–2973.E5. 10.1016/j.cub.2020.05.067 [DOI] [PMC free article] [PubMed] [Google Scholar]
- Gerfen CR, Paletzki R, & Heintz N (2013). GENSAT BAC cre-recombinase driver lines to study the functional organization of cerebral cortical and basal ganglia circuits. Neuron, 80(6), 1368–1383. 10.1016/j.neuron.2013.10.016 [DOI] [PMC free article] [PubMed] [Google Scholar]
- Gil Z, Connors BW, & Amitai Y (1997). Differential regulation of neocortical synapses by neuromodulators and activity. Neuron, 19(3), 679–686. 10.1016/s0896-6273(00)80380-3 [DOI] [PubMed] [Google Scholar]
- Gil Z, Connors BW, & Amitai Y (1999). Efficacy of thalamocortical and intracortical synaptic connections: quanta, innervation, and reliability. Neuron, 23(2), 385–397. 10.1016/s0896-6273(00)80788-6 [DOI] [PubMed] [Google Scholar]
- Godement P, Salaun J, & Imbert M (1984). Prenatal and postnatal development of retinogeniculate and retinocollicular projections in the mouse. Journal of Comparative Neurology, 230(4), 552–575. 10.1002/cne.902300406 [DOI] [PubMed] [Google Scholar]
- Golding B, Pouchelon G, Bellone C, Murthy S, Di Nardo AA, Govindan S, Ogawa M, Shimogori T, Lüscher C, Dayer A, & Jabaudon D (2014). Retinal input directs the recruitment of inhibitory interneurons into thalamic visual circuits. Neuron, 81(6), 1443. 10.1016/j.neuron.2014.03.005 [DOI] [PubMed] [Google Scholar]
- Gong S, Doughty M, Harbaugh CR, Cummins A, Hatten ME, Heintz N, & Gerfen CR (2007). Targeting Cre recombinase to specific neuron populations with bacterial artificial chromosome constructs. Journal of Neuroscience, 27(37), 9817–9823. 10.1523/JNEUROSCI.2707-07.2007 [DOI] [PMC free article] [PubMed] [Google Scholar]
- Grant E, Hoerder-Suabedissen A, & Molnar Z (2016). The regulation of corticofugal fiber targeting by retinal inputs. Cerebral Cortex, 26(3), 1336–1348. 10.1093/cercor/bhv315 [DOI] [PMC free article] [PubMed] [Google Scholar]
- Grubb MS, & Thompson ID (2003). Quantitative characterization of visual response properties in the mouse dorsal lateral geniculate nucleus. Journal of Neurophysiology, 90(6), 3594–3607. 10.1152/jn.00699.2003 [DOI] [PubMed] [Google Scholar]
- Gurung B, & Fritzsch B (2004). Time course of embryonic midbrain and thalamic auditory connection development in mice as revealed by carbocyanine dye tracing. Journal of Comparative Neurology, 479(3), 309–327. 10.1002/cne.20328 [DOI] [PMC free article] [PubMed] [Google Scholar]
- Harris JA, Hirokawa KE, Sorensen SA, Gu H, Mills M, Ng LL, Bohn P, Mortrud M, Ouellette B, Kidney J, Smith KA, Dang C, Sunkin S, Bernard A, Oh SW, Madisen L, & Zeng H (2014). Anatomical characterization of Cre driver mice for neural circuit mapping and manipulation. Frontiers in Neural Circuits, 8, 76. 10.3389/fncir.2014.00076 [DOI] [PMC free article] [PubMed] [Google Scholar]
- Harris JA, Mihalas S, Hirokawa KE, Whitesell JD, Choi H, Bernard A, Bohn P, Caldejon S, Casal L, Cho A, Feiner A, Feng D, Gaudreault N, Gerfen CR, Graddis N, Groblewski PA, Henry AM, Ho A, Howard R, . . . Zeng H (2019). Hierarchical organization of cortical and thalamic connectivity. Nature, 575(7781), 195–202. 10.1038/s41586-019-1716-z [DOI] [PMC free article] [PubMed] [Google Scholar]
- Hooks BM, Mao T, Gutnisky DA, Yamawaki N, Svoboda K, & Shepherd GM (2013). Organization of cortical and thalamic input to pyramidal neurons in mouse motor cortex. Journal of Neuroscience, 33(2), 748–760. 10.1523/JNEUROSCI.4338-12.2013 [DOI] [PMC free article] [PubMed] [Google Scholar]
- Huberman AD, Wei W, Elstrott J, Stafford BK, Feller MB, & Barres BA (2009). Genetic identification of an On-Off direction-selective retinal ganglion cell subtype reveals a layer-specific subcortical map of posterior motion. Neuron, 62(3), 327–334. 10.1016/j.neuron.2009.04.014 [DOI] [PMC free article] [PubMed] [Google Scholar]
- Huerta-Ocampo I, Hacioglu-Bay H, Dautan D, & Mena-Segovia J (2020). Distribution of midbrain cholinergic axons in the thalamus. eNeuro, 7(1), ENEURO.0454–19.2019. 10.1523/ENEURO.0454-19.2019 [DOI] [PMC free article] [PubMed] [Google Scholar]
- Jaubert-Miazza L, Green E, Lo FS, Bui K, Mills J, & Guido W (2005). Structural and functional composition of the developing retinogeniculate pathway in the mouse. Visual Neuroscience, 22(5), 661–676. 10.1017/S0952523805225154 [DOI] [PubMed] [Google Scholar]
- Jones EG (1975). Some aspects of the organization of the thalamic reticular complex. Journal of Comparative Neurology, 162(3), 285–308. 10.1002/cne.901620302 [DOI] [PubMed] [Google Scholar]
- Kay JN, De La Huerta I, Kim I-J, Zhang Y, Yamagata M, Chu MW, Meister M, & Sanes JR (2011). Retinal ganglion cells with distinct directional preferences differ in molecular identity, structure, and central projections. Journal of Neuroscience, 31(21), 7753–7762. 10.1523/JNEUROSCI.0907-11.2011 [DOI] [PMC free article] [PubMed] [Google Scholar]
- Kerschensteiner D, & Guido W (2017). Organization of the dorsal lateral geniculate nucleus in the mouse. Visual Neuroscience, 34, E008. 10.1017/S0952523817000062 [DOI] [PMC free article] [PubMed] [Google Scholar]
- Kim EJ, Juavinett AL, Kyubwa EM, Jacobs MW, & Callaway EM (2015). Three types of cortical layer 5 neurons that differ in brain-wide connectivity and function. Neuron, 88(6), 1253–1267. 10.1016/j.neuron.2015.11.002 [DOI] [PMC free article] [PubMed] [Google Scholar]
- Kloc M, & Maffei A (2014). Target-specific properties of thalamocortical synapses onto layer 4 of mouse primary visual cortex. Journal of Neuroscience, 34(46), 15455–15465. 10.1523/JNEUROSCI.2595-14.2014 [DOI] [PMC free article] [PubMed] [Google Scholar]
- Lee D, Creed M, Jung K, Stefanelli T, Wendler DJ, Oh WC, Mignocchi NL, Lüscher C, & Kwon H-B (2017). Temporally precise labeling and control of neuromodulatory circuits in the mammalian brain. Nature Methods, 14(5), 495–503. 10.1038/nmeth.4234 [DOI] [PubMed] [Google Scholar]
- Luo L, Callaway EM, & Svoboda K (2008). Genetic dissection of neural circuits. Neuron, 57(5), 634–660. 10.1016/j.neuron.2008.01.002 [DOI] [PMC free article] [PubMed] [Google Scholar]
- Luo L, Callaway EM, & Svoboda K (2018). Genetic dissection of neural circuits: a decade of progress. Neuron, 98(4), 865. 10.1016/j.neuron.2018.05.004 [DOI] [PMC free article] [PubMed] [Google Scholar]
- Madisen L, Mao T, Koch H, Zhuo J-M, Berenyi A, Fujisawa S, Hsu Y-WA, Garcia AJ, Gu X, Zanella S, Kidney J, Gu H, Mao Y, Hooks BM, Boyden ES, Buzsáki G, Ramirez JM, Jones AR, Svoboda K, . . . Zeng H (2012). A toolbox of Cre-dependent optogenetic transgenic mice for light-induced activation and silencing. Nature Neuro-science, 15(5), 793–802. 10.1038/nn.3078 [DOI] [PMC free article] [PubMed] [Google Scholar]
- Madisen L, Zwingman TA, Sunkin SM, Oh SW, Zariwala HA, Gu H, Ng LL, Palmiter RD, Hawrylycz MJ, Jones AR, Lein Ed S, & Zeng H (2010). A robust and high-throughput Cre reporting and characterization system for the whole mouse brain. Nature Neuroscience, 13(1), 133–140. 10.1038/nn.2467 [DOI] [PMC free article] [PubMed] [Google Scholar]
- Martersteck EM, Hirokawa KE, Evarts M, Bernard A, Duan X, Li Y, Ng L, Oh SW, Ouellette B, Royall JJ, Stoecklin M, Wang Q, Zeng H, Sanes JR, & Harris JA (2017). Diverse central projection patterns of retinal ganglion cells. Cell Reports, 18(8), 2058–2072. 10.1016/j.celrep.2017.01.075 [DOI] [PMC free article] [PubMed] [Google Scholar]
- Monavarfeshani A, Stanton G, Van Name J, Su K, Mills WA, Swilling K, Kerr A, Huebschman NA, Su J, & Fox MA (2018). LRRTM1 underlies synaptic convergence in visual thalamus. Elife, 7, e33498. 10.7554/eLife.33498 [DOI] [PMC free article] [PubMed] [Google Scholar]
- Montero VM, Guillery RW, & Woolsey CN (1977). Retinotopic organization within the thalamic reticular nucleus demonstrated by a double label autoradiographic technique. Brain Research, 138(3), 407–421. 10.1016/0006-8993(77)90681-3 [DOI] [PubMed] [Google Scholar]
- Ohara PT, & Lieberman AR (1985). The thalamic reticular nucleus of the adult rat: experimental anatomical studies. Journal of Neurocytology, 14(3), 365–411. 10.1007/BF01217752 [DOI] [PubMed] [Google Scholar]
- Paxinos G, & Franklin KBJ (2004). The mouse brain in stereotaxic coordinates (2nd ed.). Elsevier Academic Press. [Google Scholar]
- Rebsam A, Seif I, & Gaspar P (2002). Refinement of thalamocortical arbors and emergence of barrel domains in the primary somatosensory cortex: a study of normal and monoamine oxidase a knock-out mice. Journal of Neuroscience, 22(19), 8541–8552. [DOI] [PMC free article] [PubMed] [Google Scholar]
- Reese BE (1988). ‘Hidden lamination’ in the dorsal lateral geniculate nucleus: the functional organization of this thalamic region in the rat. Brain Research, 472(2), 119–137. 10.1016/0165-0173(88)90017-3 [DOI] [PubMed] [Google Scholar]
- Roman Roson M, Bauer Y, Kotkat AH, Berens P, Euler T, & Busse L (2019). Mouse dLGN receives functional input from a diverse population of retinal ganglion cells with limited convergence. Neuron, 102(2), 462–476 e468. 10.1016/j.neuron.2019.01.040 [DOI] [PubMed] [Google Scholar]
- Sabatini PV, Wang J, Rupp AC, Affinati AH, Flak JN, Li C, Olson DP, & Myers MG (2021). tTARGIT AAVs mediate the sensitive and flexible manipulation of intersectional neuronal populations in mice. Elife, 10, e66835. 10.7554/eLife.66835 [DOI] [PMC free article] [PubMed] [Google Scholar]
- Sabbagh U, Govindaiah G, Somaiya RD, Ha RV, Wei JC, Guido W, & Fox MA (2020). Diverse GABAergic neurons organize into subtype-specific sublaminae in the ventral lateral geniculate nucleus. Journal of Neurochemistry. Advance online publication. 10.1111/jnc.15101 [DOI] [PMC free article] [PubMed] [Google Scholar]
- Sabbah S, Berg D, Papendorp C, Briggman KL, & Berson DM (2017). A Cre mouse line for probing irradiance- and direction-encoding retinal networks. eNeuro, 4(2), ENEURO.0065–1. 10.1523/ENEURO.0065-17.2017 [DOI] [PMC free article] [PubMed] [Google Scholar]
- Seabrook TA, Krahe TE, Govindaiah G, & Guido W (2013). Interneurons in the mouse visual thalamus maintain a high degree of retinal convergence throughout postnatal development. Neural Development, 8, 24. 10.1186/1749-8104-8-24 [DOI] [PMC free article] [PubMed] [Google Scholar]
- Senft SL, & Woolsey TA (1991). Growth of thalamic afferents into mouse barrel cortex. Cerebral Cortex, 1(4), 308–335. 10.1093/cercor/1.4.308 [DOI] [PubMed] [Google Scholar]
- Silveira MA, Anair JD, Beebe NL, Mirjalili P, Schofield BR, & Roberts MT (2020). Neuropeptide Y expression defines a novel class of GABAergic projection neuron in the inferior colliculus. Journal of Neuroscience, 40(24), 4685–4699. 10.1523/JNEUROSCI.0420-20.2020 [DOI] [PMC free article] [PubMed] [Google Scholar]
- Smith Y, Raju DV, Pare JF, & Sidibe M (2004). The thalamostriatal system: a highly specific network of the basal ganglia circuitry. Trends in Neuroscience (Tins), 27(9), 520–527. 10.1016/j.tins.2004.07.004 [DOI] [PubMed] [Google Scholar]
- Sokhadze G, Campbell PW, & Guido W (2019). Postnatal development of cholinergic input to the thalamic reticular nucleus of the mouse. European Journal of Neuroscience, 49(8), 978–989. 10.1111/ejn.13942 [DOI] [PMC free article] [PubMed] [Google Scholar]
- Sokhadze G, Seabrook TA, & Guido W (2018). The absence of retinal input disrupts the development of cholinergic brainstem projections in the mouse dorsal lateral geniculate nucleus. Neural Development, 13(1), 27. 10.1186/s13064-018-0124-7 [DOI] [PMC free article] [PubMed] [Google Scholar]
- Stephany C-É, Ma X, Dorton HM, Wu J, Solomon AM, Frantz MG, Qiu S, & Mcgee AW (2018). Distinct circuits for recovery of eye dominance and acuity in murine amblyopia. Current Biology, 28(12), 1914–1923.E5. 10.1016/j.cub.2018.04.055 [DOI] [PMC free article] [PubMed] [Google Scholar]
- Su J, Charalambakis NE, Sabbagh U, Somaiya RD, Monavarfeshani A, Guido W, & Fox MA (2020). Retinal inputs signal astrocytes to recruit interneurons into visual thalamus. PNAS, 117(5), 2671–2682. 10.1073/pnas.1913053117 [DOI] [PMC free article] [PubMed] [Google Scholar]
- Sun W, Deng Q, Levick WR, & He S (2006). ON direction-selective ganglion cells in the mouse retina. Journal of Physiology, 576(Pt 1), 197–202. 10.1113/jphysiol.2006.115857 [DOI] [PMC free article] [PubMed] [Google Scholar]
- Taniguchi H, He M, Wu P, Kim S, Paik R, Sugino K, Kvitsani D, Fu Yu, Lu J, Lin Y, Miyoshi G, Shima Y, Fishell G, Nelson SB, & Huang ZJ (2011). A resource of Cre driver lines for genetic targeting of GABAergic neurons in cerebral cortex. Neuron, 71(6), 995–1013. 10.1016/j.neuron.2011.07.026 [DOI] [PMC free article] [PubMed] [Google Scholar]
- Tasic B, Yao Z, Graybuck LT, Smith KA, Nguyen TN, Bertagnolli D, Goldy J, Garren E, Economo MN, Viswanathan S, Penn O, Bakken T, Menon V, Miller J, Fong O, Hirokawa KE, Lathia K, Rimorin C, Tieu M, . . . Zeng H (2018). Shared and distinct transcriptomic cell types across neocortical areas. Nature, 563(7729), 72–78. 10.1038/s41586-018-0654-5 [DOI] [PMC free article] [PubMed] [Google Scholar]
- Thompson AD, Picard N, Min L, Fagiolini M, & Chen C (2016). Cortical feedback regulates feedforward retinogeniculate refinement. Neuron, 91(5), 1021–1033. 10.1016/j.neuron.2016.07.040 [DOI] [PMC free article] [PubMed] [Google Scholar]
- Vue TY, Bluske K, Alishahi A, Yang LL, Koyano-Nakagawa N, Novitch B, & Nakagawa Y (2009). Sonic hedgehog signaling controls thalamic progenitor identity and nuclei specification in mice. Journal of Neuroscience, 29(14), 4484–4497. 10.1523/JNEUROSCI.0656-09.2009 [DOI] [PMC free article] [PubMed] [Google Scholar]
- Wells MF, Wimmer RD, Schmitt LI, Feng G, & Halassa MM (2016). Thalamic reticular impairment underlies attention deficit in Ptchd1Y/− mice. Nature, 532(7597), 58–63. 10.1038/nature17427 [DOI] [PMC free article] [PubMed] [Google Scholar]
- Wolff M, Alcaraz F, Marchand AR, & Coutureau E (2015). Functional heterogeneity of the limbic thalamus: From hippocampal to cortical functions. Neuroscience and Biobehavioral Reviews, 54, 120–130. 10.1016/j.neubiorev.2014.11.011 [DOI] [PubMed] [Google Scholar]
- Yizhar O, Fenno LE, Davidson TJ, Mogri M, & Deisseroth K (2011). Optogenetics in neural systems. Neuron, 71(1), 9–34. 10.1016/j.neuron.2011.06.004 [DOI] [PubMed] [Google Scholar]
- Zecharia AY, Yu X, Gotz T, Ye Z, Carr DR, Wulff P, Bettler B, Vyssotski AL, Brickley SG, Franks NP, & Wisden W (2012). GABAergic inhibition of histaminergic neurons regulates active waking but not the sleep-wake switch or propofol-induced loss of consciousness. Journal of Neuroscience, 32(38), 13062–13075. 10.1523/JNEUROSCI.2931-12.2012 [DOI] [PMC free article] [PubMed] [Google Scholar]
- Zhou N, Masterson SP, Damron JK, Guido W, & Bickford ME (2018). The mouse pulvinar nucleus links the lateral extrastriate cortex, striatum, and amygdala. Journal of Neuroscience, 38(2), 347–362. 10.1523/JNEUROSCI.1279-17.2017 [DOI] [PMC free article] [PubMed] [Google Scholar]
Associated Data
This section collects any data citations, data availability statements, or supplementary materials included in this article.
Data Availability Statement
The data that support the findings of this study are openly available in Mendeley Data at https://data.mendeley.com/datasets/n2 × 9vvpj54/