

Abstract
Background
Subcutaneous and visceral adipose tissues are important body components, but their effects on the mortality in patients with liver cirrhosis remain controversial based on the current evidence.
Methods
We retrospectively identified 372 eligible patients in whom subcutaneous adipose tissue index (SATI) and visceral adipose tissue index (VATI) could be measured by computed tomography images at the third lumbar vertebra. The association of SATI and VATI with the risk of death was evaluated on a continuous scale with restricted cubic spline curves based on Cox proportional hazards models. Cumulative probability of mortality was estimated by Nelson–Aalen cumulative risk curve analyses. Independent predictors of death were evaluated by competing risk analyses after adjusting for age, sex, and model for end‐stage liver disease score.
Results
Majority of patients were male (69.4%) with a mean age of 55.40 ± 10.68 years. SATI had a U‐shaped association with mortality (P for non‐linearity <0.001). Cutoff values of SATI were 19.7 and 51.8 cm2/m2 at the points where hazard ratios were just <1.2. SATI was categorized as low (<19.7 cm2/m2), moderate (19.7–51.8 cm2/m2), and high (>51.8 cm2/m2) level. There was no significant difference in the cumulative probability of mortality between low versus moderate SATI groups (Gray's test, P = 0.052) and high versus moderate SATI groups (Gray's test, P = 0.054). Competing risk analyses demonstrated that low SATI could increase the mortality compared with moderate SATI (subdistribution hazard ratio [sHR] = 1.66, 95% confidence interval [CI]: 0.992–2.78, P = 0.054) and was an independent predictor of death (sHR = 1.86, 95% CI: 1.059–3.28, P = 0.031). Competing risk analyses also demonstrated that high SATI could significantly increase the mortality compared with moderate SATI (sHR = 1.6, 95% CI: 1–2.54, P = 0.049), and was an independent predictor of death (sHR = 2.007, 95% CI: 1.195–3.37, P = 0.0085). VATI had an irregularly shaped association with mortality (P for non‐linearity <0.001). Cutoff values of VATI were 9.8 and 40.2 cm2/m2 at the points where hazard ratios were just <1.2. VATI was categorized as low (<9.8 cm2/m2), moderate (9.8–40.2 cm2/m2), and high (>40.2 cm2/m2) level. There was no significant difference in the cumulative probability of mortality between low versus moderate VATI groups (Gray's test, P = 0.381) and high versus moderate VATI groups (Gray's test, P = 0.787). Competing risk analyses demonstrated that neither low (sHR = 1.27, 95% CI: 0.599–2.7, P = 0.53) nor high VATI (sHR = 0.848, 95% CI: 0.539–1.34, P = 0.48) was an independent predictor of death compared with moderate VATI.
Conclusions
Both excessive deficiency and accumulation of subcutaneous adipose tissues negatively influence the outcomes of cirrhotic patients.
Keywords: Liver cirrhosis, Subcutaneous adipose tissue, Visceral adipose tissue, Prognosis
1. Introduction
Liver cirrhosis, the end stage of various chronic liver diseases, is often accompanied by severe clinical complications, mainly including gastroesophageal variceal bleeding, ascites, hepatic encephalopathy, and renal and cardiac dysfunction, which negatively affect the quality of life and long‐term outcomes. 1 , 2 Globally, the number of patients with liver cirrhosis increased from 71.1 million in 1990 to 122.6 million in 2017, and the proportion of liver cirrhosis‐related deaths among all‐cause deaths also increased from 1.9% in 1990 to 2.4% in 2017. 3 Assessing the risk of death in patients with liver cirrhosis is important for guiding the selection of appropriate interventions.
Visceral and subcutaneous adipose tissues provide energy by generating free fatty acids and regulate fat and glucose metabolism, appetite, inflammation, angiogenesis, and insulin sensitivity by secreting adipokines. 4 They can be quantified by visceral adipose tissue index (VATI) and subcutaneous adipose tissue index (SATI) on computed tomography (CT) scans 5 to represent the body's nutritional and metabolic status. 6 Recently, the association between adipose tissue and outcomes of patients with liver cirrhosis has been widely explored, but remains controversial. Some studies found a significant correlation between VATI and mortality, 7 , 8 , 9 whereas others did not demonstrate any association. 10 On the other hand, one study found that low SATI, defined as SATI <60 cm2/m2, would increase the risk of death in cirrhotic patients awaiting liver transplantation; by contrast, another study showed that subcutaneous adipose tissue accumulation, defined as total adipose tissue index >55 cm2/m2 and SATI > VATI, could increase the mortality in patients with alcoholic cirrhosis. 11 Such contrasting findings among studies may be primarily attributed to the difference in grouping the study population. Prior studies mostly divided the patient population into two groups by only a single cutoff value of adipose tissue index. However, either excessive accumulation or deficiency of adipose tissue may be detrimental to the patients' survival. Indeed, the evidence suggested a U‐shaped association of body mass index 12 and body fat percentage 13 with mortality in the general population. Therefore, it seems reasonable that such a U‐shaped association can also be established between adipose tissue and mortality in liver cirrhosis.
2. Methods
2.1. Ethics
This retrospective study was carried out following the rules of the 1975 Declaration of Helsinki and approved by the Medical Ethical Committee of the General Hospital of Northern Theater Command with an approval number of Y (2022) 013.
2.2. Study population
Potentially eligible patients with liver cirrhosis and without malignancy were selected from our prospectively established database between December 2014 and June 2021. 14 , 15 Exclusion criteria were as follows: (1) patients did not undergo abdominal CT at the time of admission; (2) cross‐sectional CT images at the level of the third lumbar (L3) vertebrae could not be obtained; and (3) height data were unavailable. Patients were regularly followed via telephone, through outpatient visits, and/or by reviewing medical records until death or liver transplantation. The last follow‐up date was December 2021.
2.3. Data collection
Demographic, clinical, and laboratory data at admission were collected, including age, gender, height, co‐morbidities (i.e., diabetes and hypertension), aetiologies of liver cirrhosis (i.e., hepatitis B virus, hepatitis C virus, and alcohol abuse), and decompensated events (i.e., acute gastrointestinal bleeding, hepatic encephalopathy, jaundice, and ascites). Model for end‐stage liver disease (MELD) score 16 and Child–Pugh score 17 were calculated.
2.4. Measurement of SATI and VATI
Adipose tissue was assessed by analysing abdominal CT images at the level of the L3 vertebra. 5 Subcutaneous and visceral adipose tissues are defined as the areas outside and inside the abdominal muscular wall, respectively. These tissue regions were specially identified by using Slice‐O‐Matic V5.0 software (Tomovision, Montreal, Quebec, Canada) with standard thresholds of −190 to −30 Hounsfield Unit (HU) for subcutaneous adipose tissue 18 and −150 to −50 HU for visceral adipose tissue. 19 Adipose tissue areas were automatically calculated by summing tissue pixels and then multiplying by pixel surface area (Figure 1). These tissue areas were normalized by dividing by the square of the height in meters, and then described as SATI and VATI. 10
Figure 1.

Measurement of adipose tissue area using Slice‐O‐Matic software.
2.5. Statistical analyses
Continuous variables were presented as mean ± standard deviation and median (range), and categorical variables were presented as frequency (percentage). Mann–Whitney U test and χ 2 test or Fisher's exact test were used to compare the differences. Pearson correlation tests were used to evaluate the correlation of SATI and VATI with MELD score. The association of SATI and VATI with mortality was evaluated on a continuous scale with restricted cubic spline (RCS) curves based on Cox regression analyses with four knots at the 5th, 35th, 65th, and 95th percentiles. 20 The risk of death at various levels of SATI and VATI was described as hazard ratios (HRs) on the spline curve. Their optimal cutoff values for predicting the mortality were determined by HRs and the shape of the curves. Cumulative incidence function was used to estimate the cumulative probability of mortality. Univariate and multivariate competing risk analyses adjusted for age, sex, and MELD score were performed to identify whether SATI or VATI was an independent predictor of increased mortality, where liver transplantation was a competing event to the onset of death. Subdistribution hazard ratios (sHRs) and their 95% confidence intervals (CIs) were calculated. A two‐tailed P < 0.05 was considered statistically significant. All statistical analyses were performed by using Statistical Package for Social Science (SPSS version 26.0, IBM Corp, Armonk, New York, USA) and R (version 4.1.2, R Foundation for Statistical Computing, Vienna, Austria) with packages rms, survival, and cmprsk.
3. Results
3.1. Patients
A total of 372 patients with liver cirrhosis were included in our study (Figure 2), and their baseline characteristics were shown in Table 1. Majority were male (69.4%). The median age was 55.35 (range: 20.58–88.73 years), and the median MELD score was 10.26 (range: 6.43–30.03). The primary aetiologies of liver cirrhosis included alcohol use disorder (44.9%), chronic hepatitis B (36.3%) and hepatitis C virus infection (8.9%). The median SATI was 36.66 (range: 1.00–146.86 cm2/m2), and the median VATI was 28.81 (range: 0.09–125.78 cm2/m2).
Figure 2.

A flowchart of patient enrolment.
Table 1.
Baseline characteristics of patients with cirrhosis
| Variables | No. pts | Percentage (%) Mean ± SD Median (range) |
|---|---|---|
| Demographics | ||
| Age (years) | 372 |
55.40 ± 10.68 55.35 (20.58–88.73) |
| Gender (male) | 372 | 258 (69.4%) |
| Height (m) | 372 |
1.68 ± 0.07 1.70 (1.50–1.90) |
| BMI (kg/m2) | 372 |
23.36 ± 3.35 23.21 (14.82–37.37) |
| Co‐morbidities | ||
| Diabetes | 372 | 61 (16.4%) |
| Hypertension | 372 | 63 (16.9%) |
| Aetiologies of liver cirrhosis | ||
| Chronic HBV infection | 372 | 135 (36.3%) |
| Chronic HCV infection | 372 | 33 (8.9%) |
| Alcohol use disorder | 372 | 167 (44.9%) |
| Decompensated events | ||
| AGIB | 372 | 116 (31.2%) |
| HE | 372 | 8 (2.2%) |
| Jaundice | 372 | 55 (14.8%) |
| Ascites | 372 | 221 (59.4%) |
| Laboratory tests | ||
| WBC (109/L) | 372 |
4.25 ± 3.04 3.5 (0.7–23.1) |
| Hb (g/L) | 372 |
95.51 ± 29.0 94.0 (28–178) |
| PLT (109/L) | 372 |
98.83 ± 71.15 79.5 (18–646) |
| TBIL (μmol/L) | 372 |
29.43 ± 29.05 20.45 (4.9–216.5) |
| ALB (g/L) | 370 |
32.52 ± 6.55 32.40 (14.2–65.1) |
| ALT (U/L) | 372 |
37.57 ± 82.94 23.98 (4.23–1465.5) |
| ALP (U/L) | 372 |
112.57 ± 86.20 90.73 (28.83–983.93) |
| SCr (μmol/L) | 368 |
65.96 ± 21.50 63.46 (14.80–267.63) |
| Na (mmol/L) | 370 |
138.32 ± 3.37 138.0 (118.0–159.0) |
| INR | 368 |
1.33 ± 0.27 1.26 (0.91–2.77) |
| Child–Pugh score | 367 |
7.21 ± 1.84 7 (5–13) |
| MELD score | 366 |
11.45 ± 4.13 10.26 (6.43–30.03) |
| Body composition variables | ||
| VATI (cm2/m2) | 372 |
32.59 ± 21.19 28.81 (0.09–125.78) |
| SATI (cm2/m2) | 372 |
40.24 ± 24.71 36.66 (1.00–146.86) |
Abbreviations: No. pts, numbers of patients; BMI, body mass index; HBV, hepatitis B virus; HCV, hepatitis C virus; AGIB, acute gastrointestinal bleeding; HE, hepatic encephalopathy; WBC, white blood cell; Hb, haemoglobin; PLT, platelet; TBIL, total bilirubin; ALB, albumin; ALT, alanine aminotransferase; ALP, alkaline phosphatase; SCr, serum creatinine; Na, sodium; INR, international normalized ratio; MELD, model for end‐stage liver disease; VATI, visceral adipose tissue index; SATI, subcutaneous adipose tissue index.
During a median follow‐up period of 2.99 (range: 0.03–6.85 years), 94 (25.3%) patients died and 5 (1.3%) underwent liver transplantation. Of the 94 patients who died, 65 (69.1%) died of liver diseases related events, 16 (17.0%) non‐liver diseases related events, and 13 (13.8%) unknown causes.
3.2. SATI and mortality
Pearson correlation tests suggested a significant correlation between SATI and MELD score, but the correlation was weak (P = 0.012, R = −0.132) (Figure 3A). A strong U‐shaped association between SATI and the risk of death was identified after adjusting for age, sex, and MELD score (P for non‐linearity <0.001) (Figure 4A). Accordingly, we selected two cutoff values of 19.7 and 51.8 cm2/m2 at the points where HRs were just <1.2. Thus, these patients with cirrhosis were divided into low (SATI < 19.7 cm2/m2), moderate (19.7 ≤ SATI ≤ 51.8 cm2/m2), and high (SATI > 51.8 cm2/m2) SATI groups, with the mortality of 31.5% (23/73), 21.7% (43/198), and 27.7% (28/101), respectively.
Figure 3.

Correlation analyses of SATI and VATI with MELD score.
Figure 4.
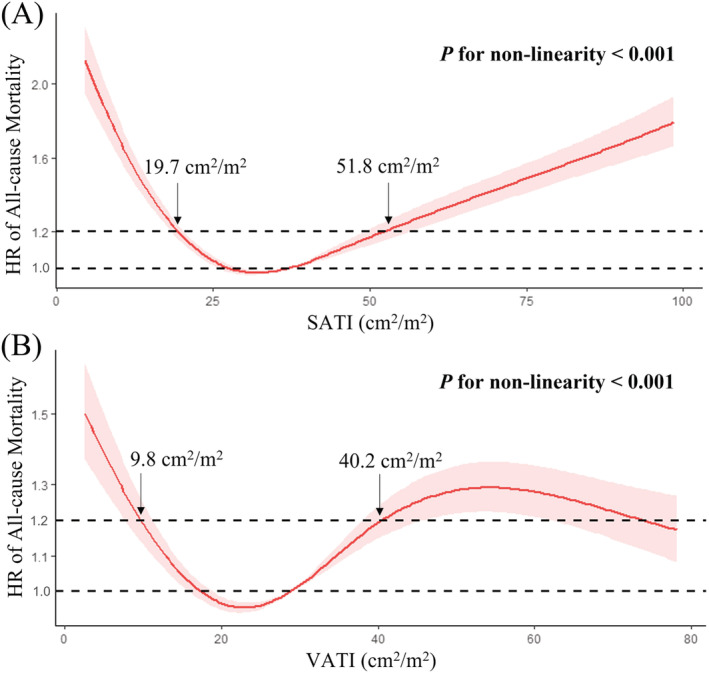
Analyses of restricted cubic spline curves based on Cox proportional hazards models. (A) A U‐shaped association between SATI and the risk of death (P for non‐linearity <0.001). (B) An irregularly shaped association between VATI and the risk of death (P for non‐linearity <0.001).
Nelson–Aalen cumulative risk curve analysis demonstrated that the cumulative probability of mortality was higher in low SATI group than in moderate SATI group, but the difference between them was not statistically significant (Gray's test, P = 0.052) (Figure 5A). Univariate competing risk analysis demonstrated that low SATI was associated with increased mortality compared with moderate SATI (sHR = 1.66, 95% CI: 0.992–2.78, P = 0.054), but their association was not statistically significant. Notably, multivariate competing risk analysis adjusted for age, sex, and MELD score demonstrated that low SATI was an independent predictor of increased mortality (sHR = 1.86, 95% CI: 1.059–3.28, P = 0.031) (Table 2).
Figure 5.

Nelson–Aalen cumulative risk curve analyses showing the effects of SATI and VATI on the long‐term mortality of patients with cirrhosis. There was no significant difference in the cumulative probability of mortality between (A) low versus moderate SATI groups (Gray's test, P = 0.052), (B) high versus moderate SATI groups (Gray's test, P = 0.054), (C) low versus moderate VATI groups (Gray's test, P = 0.381), and (D) high versus moderate VATI groups (Gray's test, P = 0.787).
Table 2.
Competing risk analyses regarding effects of SATI and VATI on long‐term mortality in patients with cirrhosis
| Variables (cm2/m2) | Mortality | Univariate analyses | Multivariate analyses a | ||||
|---|---|---|---|---|---|---|---|
| sHR | 95% CI | P value | sHR | 95% CI | P value | ||
| SATI level | |||||||
| SATI < 19.7 vs. 19.7 ≤ SATI ≤ 51.8 | 31.5% (23/73) vs. 21.7% (43/198) | 1.66 | 0.992–2.78 | 0.054 | 1.86 | 1.059–3.28 | 0.031 |
| SATI > 51.8 vs. 19.7 ≤ SATI ≤ 51.8 | 27.7% (28/101) vs. 21.7% (43/198) | 1.6 | 1–2.54 | 0.049 | 2.007 | 1.195–3.37 | 0.0085 |
| VATI level | |||||||
| VATI < 9.8 vs. 9.8 ≤ VATI ≤ 40.2 | 27.3% (12/44) vs. 25.6% (53/207) | 1.33 | 0.679–2.58 | 0.41 | 1.27 | 0.599–2.7 | 0.530 |
| VATI > 40.2 vs. 9.8 ≤ VATI ≤ 40.2 | 24.0% (29/121) vs. 25.6% (53/207) | 1.06 | 0.677–1.67 | 0.79 | 0.848 | 0.539–1.34 | 0.480 |
Abbreviations: sHR, subdistribution hazard ratio; CI, confidence interval; SATI, subcutaneous adipose tissue index; VATI, visceral adipose tissue index.
Multivariate analyses by adjusting for age, sex, and MELD score.
Nelson–Aalen cumulative risk curve analysis demonstrated that the cumulative probability of mortality was higher in high SATI group than in moderate SATI group, but the difference between them was not statistically significant (Gray's test, P = 0.054) (Figure 5B). Univariate competing risk analysis demonstrated that high SATI was significantly associated with increased mortality compared with moderate SATI (sHR = 1.6, 95% CI: 1–2.54, P = 0.049), and multivariate competing risk analysis adjusted for age, sex, and MELD score demonstrated that high SATI was an independent predictor of increased mortality (sHR = 2.007, 95% CI: 1.195–3.37, P = 0.0085) (Table 2).
3.3. VATI and mortality
Pearson correlation tests did not demonstrate any significant correlation between VATI and MELD score (P = 0.09, R = −0.089) (Figure 3B). An irregularly shaped association between VATI and the risk of death was identified after adjusting for age, sex, and MELD score (P for non‐linearity <0.001) (Figure 4B). Accordingly, we selected two cutoff values of 9.8 and 40.2 cm2/m2 at the points where HRs were just <1.2. Thus, these cirrhotic patients were divided into low (VATI < 9.8 cm2/m2), moderate (9.8 ≤ VATI ≤ 40.2 cm2/m2), and high (VATI > 40.2 cm2/m2) VATI groups, with the mortality of 27.3% (12/44), 25.6% (53/207), and 24.0% (29/121), respectively.
Nelson–Aalen cumulative risk curve analysis demonstrated no significant difference in the cumulative probability of mortality between low and moderate VATI groups (Gray's test, P = 0.381) (Figure 5C). Univariate competing risk analysis also demonstrated that low VATI was not significantly associated with increased mortality compared with moderate VATI (sHR = 1.33, 95% CI: 0.679–2.58, P = 0.41), and multivariate competing risk analysis adjusted for age, sex, and MELD score further confirmed that low VATI was not a significant predictor of increased mortality (sHR = 1.27, 95% CI: 0.599–2.7, P = 0.53) (Table 2).
Nelson–Aalen cumulative risk curve analysis demonstrated no significant difference in the cumulative probability of mortality between high and moderate VATI groups (Gray's test, P = 0.787) (Figure 5D). Univariate competing risk analysis also demonstrated that high VATI was not significantly associated with increased mortality compared with moderate VATI (sHR = 1.06, 95% CI: 0.677–1.67, P = 0.79), and multivariate competing risk analysis adjusted for age, sex, and MELD score further confirmed that high VATI was not a significant predictor of increased mortality (sHR = 0.848, 95% CI: 0.539–1.34, P = 0.48) (Table 2).
4. Discussion
Our study identified a nonlinear U‐shaped association between SATI and mortality in patients with liver cirrhosis. Briefly, compared with the moderate SATI group (19.7 ≤ SATI ≤ 51.8 cm2/m2), the low (SATI < 19.7 cm2/m2) and high SATI groups (SATI > 51.8 cm2/m2) had a higher risk of death.
Dietary intake is often insufficient in patients with cirrhosis, which may be attributed to their loss of appetite caused by leptin 21 and tumour necrosis factor alpha 22 upregulation, limited gastric distensibility secondary to ascites, 23 and dietary restriction related to hepatic encephalopathy. 24 In addition, the absorption of nutrients is impaired in cirrhosis, which is attributed to their bile acid deficiency and small intestinal mucosal and villous atrophy secondary to bacterial overgrowth. 25 Therefore, energy supply from exogenous substrates cannot meet energy demands in some patients with liver cirrhosis. 26 In this case, it has to be partly dependent on adipose tissue stored in the body. Among those with cirrhosis and low SATI, subcutaneous adipose tissue is deficient, thereby compromising energy supply and patients' outcomes.
It was reported that the SATI was significantly lower in patients with hepatic venous pressure gradient (HVPG) >16 mmHg than those with HVPG <10 mmHg (65 ± 33 vs. 91 ± 47 cm2/m2, P = 0.028). 27 As known, an increase in HVPG can lead to the occurrence of ascites, variceal bleeding, and hepatic encephalopathy, and increase the risk of death. 28 Therefore, we may infer that low SATI should be associated with high risk of portal hypertension related complications, thereby deteriorating the patients' outcomes.
Excessive accumulation of subcutaneous adipose tissue can lead to chronic inflammation and fibrosis 29 , 30 , 31 , 32 , 33 , 34 (Figure 6). Chronic inflammation contributes to insulin resistance and metabolic disorders in the body. 35 Fibrosis restricts the expansion of adipocytes and promotes the deposition of excessive adipose tissue in other organs, including the liver, resulting in lipotoxicity. 36 These changes promote hepatic steatosis, which further activates Kupffer cells in the liver and induces the infiltration of other inflammatory cells, such as T lymphocytes and neutrophils. Subsequently, these inflammatory cells further activate hepatic stellate cells that are involved in the development of liver fibrosis and cirrhosis. 37 Accordingly, in cirrhosis with high SATI, subcutaneous obesity further exacerbates the severity of liver disease and worsens the clinical outcomes. However, it is worth mentioning that the causal association between subcutaneous adipose tissue accumulation and mortality is only an inference based on previous literature. Certainly, we should also consider that subcutaneous adipose tissue accumulation may be only a secondary phenotype as well as poor outcome in liver cirrhosis. It is known that women have more subcutaneous fat than men, 38 and the disturbances of sex hormones and feminization are observed in patients with advanced liver cirrhosis. 39 Furthermore, low testosterone levels are independently associated with a higher risk of death. 40 Regardless, prospective studies are needed to confirm the potential mechanisms.
Figure 6.

Potential mechanisms of chronic inflammation and fibrosis caused by excessive accumulation of subcutaneous adipose tissue. Adipocytes upregulate inflammatory gene hypoxia‐inducible factor‐1alpha (HIF‐1α) due to the expansion of adipose tissue and the increase of secondary oxygen consumption, and secrete a large amount of collagen due to the adipocytes hypertrophy. Immune cells highly secrete inflammatory factors, including tumour necrosis factor‐alpha (TNF‐α), interleukin 6(IL‐6), 1beta (1β), and interferon‐gamma (IFN‐γ), with a large number of M1‐type macrophages infiltration due to activation of innate immune system. Adipose stem cells highly secrete inflammatory factors, including TNF‐α, IL‐1, 6, 8, and monocyte chemoattractant protein 1 (MCP‐1) due to changes in adipose tissue microenvironment, and differentiate into myofibroblasts which secreting a large amount of collagen.
Abbreviations: TNF‐α, tumour necrosis factor‐alpha; MCP‐1, monocyte chemoattractant protein 1; HIF‐1α, hypoxia‐inducible factor‐1alpha; IL, interleukin; IFN‐γ, interferon‐gamma.
Unlike SATI, VATI was not associated with long‐term prognosis in patients with liver cirrhosis. This might be related to the difference in terms of their contents and functions. Subcutaneous adipose tissue dominates the total adipose tissue. 27 Similarly, in our patients, the median SATI was higher than the median VATI (36.66 cm2/m2 vs. 28.81 cm2/m2). Subcutaneous adipose tissue can secrete leptin and systematically regulate insulin sensitivity and glucose and lipid metabolism, 41 whereas visceral adipose tissue is metabolically inferior to subcutaneous adipose tissue. 42 Additionally, in mouse models, the transplantation of the donor's subcutaneous adipose tissue into the recipient's visceral region significantly improved the recipient's metabolic performance, whereas the transplantation of the donor's visceral adipose tissue into the recipient's visceral region had little effect. 43
A major advantage in our study design is that RCS curves based on Cox proportional hazards models were used to establish a U‐shaped association between SATI and mortality. In addition, competing risk analyses were employed, in which liver transplantation was considered as a competing risk event, and the risk of death could be evaluated more appropriately as compared with traditional survival analyses.
Our study had some limitations. First, nutritional interventions during follow up were not recorded, which might be beneficial for survival. Second, CT images of the L3 vertebrae and height data were missing in some patients, probably producing a selection bias. Third, considering the difference in the quantity of adipose tissue among regions and ethnicities, the cutoff values of SATI derived from our study cannot be extrapolated and need to be further standardized. Fourth, we were unable to separately analyse the effects of superficial and deep subcutaneous adipose tissues on the mortality of patients with subcutaneous obesity. The former preferentially expresses metabolic genes and shows marked adipocyte hypertrophy, whereas the latter overexpresses inflammatory genes and displays obvious inflammatory infiltration. 44
In conclusion, a modest amount of subcutaneous adipose tissue may be beneficial for long‐term survival in cirrhotic patients, whereas its excessive deficiency or accumulation may be harmful. Early identification and timely intervention of these harms may improve long‐term outcomes in patients with cirrhosis.
Conflict of interest
None declared.
Funding
This work was partially supported by the Young and Middle‐aged Scientific and Technological Innovation Talents Support Plan Project of Shenyang (RC210011).
Acknowledgements
The authors thank the participants of the study, including Han Deng, Ran Wang, Jing Li, Yingying Li, Xiangbo Xu, Zhaohui Bai, Qianqian Li, Kexin Zheng, Le Wang, Fangfang Yi, Yanyan Wu, Li Luo, Yue Yin, Shixue Xu, Mengyuan Peng, Min Ding, Weiwei Wang, Xueying Wang, Yiyan Zhang, and Xiaojie Zheng of our study team, for their efforts in setting up and updating our single‐centre prospectively established database.
Zhu M., Li H., Yin Y., Ding M., Philips C. A., Romeiro F. G., and Qi X. (2023) U‐shaped relationship between subcutaneous adipose tissue index and mortality in liver cirrhosis, Journal of Cachexia, Sarcopenia and Muscle, 14, 508–516, 10.1002/jcsm.13154
Menghua Zhu, Hongyu Li, Yue Yin, and Min Ding contributed equally to this work.
References
- 1. D'Amico G, Morabito A, D'Amico M, Pasta L, Malizia G, Rebora P, et al. Clinical states of cirrhosis and competing risks. J Hepatol 2018;68:563–576. [DOI] [PubMed] [Google Scholar]
- 2. Ebadi M, Bhanji RA. Review article: prognostic significance of body composition abnormalities in patients with cirrhosis. Aliment Pharmacol Ther 2020;52:600–618. [DOI] [PubMed] [Google Scholar]
- 3. The global, regional, and national burden of cirrhosis by cause in 195 countries and territories, 1990‐2017: a systematic analysis for the Global Burden of Disease Study 2017. Lancet Gastroenterol Hepatol 2020;5:245–266. [DOI] [PMC free article] [PubMed] [Google Scholar]
- 4. Ali AT, Hochfeld WE, Myburgh R, Pepper MS. Adipocyte and adipogenesis. Eur J Cell Biol 2013;92:229–236. [DOI] [PubMed] [Google Scholar]
- 5. Shen W, Punyanitya M, Wang Z, Gallagher D, St‐Onge MP, Albu J, et al. Total body skeletal muscle and adipose tissue volumes: estimation from a single abdominal cross‐sectional image. J Appl Physiol 2004;97:2333–2338. [DOI] [PubMed] [Google Scholar]
- 6. Ebadi M, Bhanji RA, Tandon P, Mazurak V, Baracos VE, Montano‐Loza AJ. Review article: prognostic significance of body composition abnormalities in patients with cirrhosis. Aliment Pharmacol Ther 2020;52:600–618. [DOI] [PubMed] [Google Scholar]
- 7. Fujiwara N, Nakagawa H, Kudo Y, Tateishi R, Taguri M, Watadani T, et al. Sarcopenia, intramuscular fat deposition, and visceral adiposity independently predict the outcomes of hepatocellular carcinoma. J Hepatol 2015;63:131–140. [DOI] [PubMed] [Google Scholar]
- 8. Kimura N, Tsuchiya A, Oda C, Kimura A, Hosaka K, Tominaga K, et al. Visceral Adipose Tissue Index and Hepatocellular Carcinoma Are Independent Predictors of Outcome in Patients with Cirrhosis Having Endoscopic Treatment for Esophageal Varices. Dig Dis 2021;39:58–65. [DOI] [PubMed] [Google Scholar]
- 9. Terjimanian MN, Harbaugh CM, Hussain A, Olugbade KO Jr, Waits SA, Wang SC, et al. Abdominal adiposity, body composition and survival after liver transplantation. Clin Transplant 2016;30:289–294. [DOI] [PMC free article] [PubMed] [Google Scholar]
- 10. Ebadi M, Tandon P, Moctezuma‐Velazquez C, Ghosh S, Baracos VE, Mazurak VC, et al. Low subcutaneous adiposity associates with higher mortality in female patients with cirrhosis. J Hepatol 2018;69:608–616. [DOI] [PubMed] [Google Scholar]
- 11. Sakamaki A, Yokoyama K, Koyama K, Morita S, Abe H, Kamimura K, et al. Obesity and accumulation of subcutaneous adipose tissue are poor prognostic factors in patients with alcoholic liver cirrhosis. PLoS ONE 2020;15:e0242582. [DOI] [PMC free article] [PubMed] [Google Scholar]
- 12. Aune D, Sen A, Prasad M, Norat T, Janszky I, Tonstad S, et al. BMI and all cause mortality: systematic review and non‐linear dose‐response meta‐analysis of 230 cohort studies with 3.74 million deaths among 30.3 million participants. BMJ 2016;353:i2156. [DOI] [PMC free article] [PubMed] [Google Scholar]
- 13. Dong B, Peng Y, Wang Z, Adegbija O, Hu J, Ma J, et al. Joint association between body fat and its distribution with all‐cause mortality: A data linkage cohort study based on NHANES (1988‐2011). PLoS ONE 2018;13:e0193368. [DOI] [PMC free article] [PubMed] [Google Scholar]
- 14. Yin Y, Li Y, Shao L, Yuan S, Liu B, Lin S, et al. Effect of Body Mass Index on the Prognosis of Liver Cirrhosis. Front Nutr 2021;8:700132. [DOI] [PMC free article] [PubMed] [Google Scholar]
- 15. Yi F, Guo X, Wang L, Xu X, An Y, Tang Y, et al. Impact of spontaneous splenorenal shunt on liver volume and long‐term survival of liver cirrhosis. J Gastroenterol Hepatol 2021;36:1694–1702. [DOI] [PubMed] [Google Scholar]
- 16. Kamath PS, Kim WR. The model for end‐stage liver disease (MELD). Hepatology 2007;45:797–805. [DOI] [PubMed] [Google Scholar]
- 17. Pugh RN, Murray‐Lyon IM, Dawson JL, Pietroni MC, Williams R. Transection of the oesophagus for bleeding oesophageal varices. Br J Surg 1973;60:646–649. [DOI] [PubMed] [Google Scholar]
- 18. Mitsiopoulos N, Baumgartner RN, Heymsfield SB, Lyons W, Gallagher D, Ross R. Cadaver validation of skeletal muscle measurement by magnetic resonance imaging and computerized tomography. J Appl Physiol 1998;85:115–122. [DOI] [PubMed] [Google Scholar]
- 19. Miller KD, Jones E, Yanovski JA, Shankar R, Feuerstein I, Falloon J. Visceral abdominal‐fat accumulation associated with use of indinavir. Lancet 1998;351:871–875. [DOI] [PubMed] [Google Scholar]
- 20. Wei Y, Zhou JH, Zhang ZW, Tan QY, Zhang MY, Li J, et al. Application of restricted cube spline in cox regression model. Zhonghua yu fang yi xue za zhi 2020;54:1169–1173. [DOI] [PubMed] [Google Scholar]
- 21. Kalaitzakis E, Bosaeus I, Ohman L, Björnsson E. Altered postprandial glucose, insulin, leptin, and ghrelin in liver cirrhosis: correlations with energy intake and resting energy expenditure. Am J Clin Nutr 2007;85:808–815. [DOI] [PubMed] [Google Scholar]
- 22. Grossberg AJ, Scarlett JM, Marks DL. Hypothalamic mechanisms in cachexia. Physiol Behav 2010;100:478–489. [DOI] [PMC free article] [PubMed] [Google Scholar]
- 23. Aqel BA, Scolapio JS, Dickson RC, Burton DD, Bouras EP. Contribution of ascites to impaired gastric function and nutritional intake in patients with cirrhosis and ascites. Clin Gastroenterol Hepatol 2005;3:1095–1100. [DOI] [PubMed] [Google Scholar]
- 24. Cheung K, Lee SS, Raman M. Prevalence and mechanisms of malnutrition in patients with advanced liver disease, and nutrition management strategies. Clin Gastroenterol Hepatol 2012;10:117–125. [DOI] [PubMed] [Google Scholar]
- 25. Juakiem W, Torres DM, Harrison SA. Nutrition in cirrhosis and chronic liver disease. Clin Liver Dis 2014;18:179–190. [DOI] [PubMed] [Google Scholar]
- 26. Müller MJ, Böttcher J, Selberg O. Energy expenditure and substrate metabolism in liver cirrhosis. Int J Obes Relat Metab Disord 1993;17:S102–S106, discussion S15. [PubMed] [Google Scholar]
- 27. Rodrigues SG, Brabandt B, Stirnimann G, Maurer MH, Berzigotti A. Adipopenia correlates with higher portal pressure in patients with cirrhosis. Liver Int 2019;39:1672–1681. [DOI] [PubMed] [Google Scholar]
- 28. Berzigotti A. Advances and challenges in cirrhosis and portal hypertension. BMC Med 2017;15:200. [DOI] [PMC free article] [PubMed] [Google Scholar]
- 29. Liu F, He J, Wang H, Zhu D, Bi Y. Adipose morphology: a critical factor in regulation of human metabolic diseases and adipose tissue dysfunction. Obes Surg 2020;30:5086–5100. [DOI] [PMC free article] [PubMed] [Google Scholar]
- 30. Lee YS, Kim JW, Osborne O, Oh DY, Sasik R, Schenk S, et al. Increased adipocyte O2 consumption triggers HIF‐1α, causing inflammation and insulin resistance in obesity. Cell 2014;157:1339–1352. [DOI] [PMC free article] [PubMed] [Google Scholar]
- 31. Martins V, Gonzalez De Los Santos F, Wu Z, Capelozzi V, Phan SH, Liu T. FIZZ1‐induced myofibroblast transdifferentiation from adipocytes and its potential role in dermal fibrosis and lipoatrophy. Am J Pathol 2015;185:2768–2776. [DOI] [PMC free article] [PubMed] [Google Scholar]
- 32. Oñate B, Vilahur G, Camino‐López S, Díez‐Caballero A, Ballesta‐López C, Ybarra J, et al. Stem cells isolated from adipose tissue of obese patients show changes in their transcriptomic profile that indicate loss in stemcellness and increased commitment to an adipocyte‐like phenotype. BMC Genomics 2013;14:625. [DOI] [PMC free article] [PubMed] [Google Scholar]
- 33. Lumeng CN, Bodzin JL, Saltiel AR. Obesity induces a phenotypic switch in adipose tissue macrophage polarization. J Clin Invest 2007;117:175–184. [DOI] [PMC free article] [PubMed] [Google Scholar]
- 34. Lackey DE, Olefsky JM. Regulation of metabolism by the innate immune system. Nat Rev Endocrinol 2016;12:15–28. [DOI] [PubMed] [Google Scholar]
- 35. Saltiel AR, Olefsky JM. Inflammatory mechanisms linking obesity and metabolic disease. J Clin Invest 2017;127:1–4. [DOI] [PMC free article] [PubMed] [Google Scholar]
- 36. Divoux A, Tordjman J, Lacasa D, Veyrie N, Hugol D, Aissat A, et al. Fibrosis in human adipose tissue: composition, distribution, and link with lipid metabolism and fat mass loss. Diabetes 2010;59:2817–2825. [DOI] [PMC free article] [PubMed] [Google Scholar]
- 37. Koyama Y, Brenner DA. Liver inflammation and fibrosis. J Clin Invest 2017;127:55–64. [DOI] [PMC free article] [PubMed] [Google Scholar]
- 38. Palmer BF, Clegg DJ. The sexual dimorphism of obesity. Mol Cell Endocrinol 2015;402:113–119. [DOI] [PMC free article] [PubMed] [Google Scholar]
- 39. Yoshitsugu M, Ihori M. Endocrine disturbances in liver cirrhosis‐‐focused on sex hormones. Nihon Rinsho Jpn J Clin Med 1997;55:3002–3006. [PubMed] [Google Scholar]
- 40. Paternostro R, Heinisch BB, Reiberger T, Mandorfer M, Bardach C, Lampichler K, et al. Dysbalanced sex hormone status is an independent predictor of decompensation and mortality in patients with liver cirrhosis. Hepatol Res 2019;49:201–211. [DOI] [PMC free article] [PubMed] [Google Scholar]
- 41. Merli M, Durand F. Muscle mass vs. adipose tissue to predict outcome in cirrhosis: Which matters and in which patients? J Hepatol 2018;69:567–569. [DOI] [PubMed] [Google Scholar]
- 42. Tritos NA, Mantzoros CS. Leptin: its role in obesity and beyond. Diabetologia 1997;40:1371–1379. [DOI] [PubMed] [Google Scholar]
- 43. Tran TT, Yamamoto Y, Gesta S, Kahn CR. Beneficial effects of subcutaneous fat transplantation on metabolism. Cell Metab 2008;7:410–420. [DOI] [PMC free article] [PubMed] [Google Scholar]
- 44. Cancello R, Zulian A, Gentilini D, Maestrini S, Della Barba A, Invitti C, et al. Molecular and morphologic characterization of superficial‐ and deep‐subcutaneous adipose tissue subdivisions in human obesity. Obesity 2013;21:2562–2570. [DOI] [PubMed] [Google Scholar]