

Abstract
Background
The cachexia index is a useful predictor for cancer cachexia and prognostic assessment. However, its use is limited because of high testing costs and complicated testing procedures. Thus, in this study, we aimed to develop a hand grip strength (HGS)‐based cancer cachexia index (H‐CXI) as a potential predictor of cancer cachexia and prognosis in patients with cancer.
Methods
Here, 14 682 patients with cancer were studied, including the discovery (6592), internal validation (2820) and external validation (5270) cohorts. The H‐CXI was calculated as [HGS (kg)/height (m)2 × serum albumin (g/L)]/neutrophil‐to‐lymphocyte ratio. The Kaplan–Meier method was used to create survival curves, and the log‐rank test was used to compare time–event relationships between groups. A Cox proportional hazard regression model was used to determine independent risk factors for overall survival (OS). Logistic regression analysis was used to assess the association of the H‐CXI with short‐term outcomes and cancer cachexia.
Results
There was a significant non‐linear relationship between the H‐CXI and OS in all cohorts. Patients with a low H‐CXI had significantly lower OS than those with a high H‐CXI in the discovery cohort (6‐year survival percentage: 55.72% vs. 76.70%, log‐rank P < 0.001), internal validation cohort (6‐year survival percentage: 55.81% vs. 76.70%, log‐rank P < 0.001), external validation cohort (6‐year survival percentage: 56.05% vs. 75.48%, log‐rank P < 0.001) and total cohort (6‐year survival percentage: 55.86% vs. 76.27%, log‐rank P < 0.001). Notably, the prognostic stratification effect of the H‐CXI in patients with advanced‐stage disease was more significant than that in patients with early‐stage disease. The multivariate Cox proportional risk regression model confirmed that a low H‐CXI negatively affected the prognosis of patients with cancer in the discovery cohort [hazard ratio (HR) 0.75, 95% confidence interval (CI) 0.71–0.80, P < 0.001], internal validation cohort (HR 0.79, 95 %CI 0.72–0.86, P < 0.001), external validation cohort (HR 0.84, 95% CI 0.79–0.89, P < 0.001) and total cohort (HR 0.80, 95% CI 0.77–0.83, P < 0.001). Multivariate logistic regression models showed that a low H‐CXI was an independent risk factor predicting adverse short‐term outcomes and cancer cachexia in patients with cancer.
Conclusions
The simple and practical H‐CXI is a promising predictor for cancer cachexia and prognosis in patients with cancer.
Keywords: HGS‐based cachexia index, cachexia, prognosis, cancer
Introduction
A recent cancer epidemiology survey reported that between 2010 and 2019, the number of new cancer cases increased from 18.7 to 23.6 million (a 26.3% increase), and that of cancer deaths increased from 8.29 million to 10 million (a 20.9% increase). The proportion of cancer‐related deaths among all deaths also increased from 15.7% in 2010 to 17.7% in 2019. 1 In 2020, 19.29 million new cancer cases were reported worldwide; of these, 4.57 million were in China, accounting for 23.7% of the global total. Meanwhile, of the 9.96 million cancer deaths worldwide, 3 million were in China, accounting for 30% of the global total. 2 Cancer is a major contributor to the global burden of disease, and its incidence is expected to increase over the next 20 years. 3 , 4 Cachexia is a serious complication of cancer, which exacerbates the toxicity and side effects of treatment, impairs responsiveness to chemoradiotherapy, reduces quality of life and increases mortality. It is reported to be the direct cause of 22–44% of cancer‐related deaths. 5 , 6 , 7 Therefore, it is necessary to identify effective predictors to help predict cancer cachexia and adverse outcomes.
Although cachexia has a complex pathophysiology, the key clinical features of cancer cachexia are malnutrition, systemic inflammation and muscle loss. 8 Recently, Jafri et al. developed the cachexia index (CXI) using the clinical features of cachexia to evaluate the prognosis of patients with non‐small cell lung cancer. 9 The CXI is a useful predictor to assess the risk of cachexia in patients with malignancies such as small cell lung cancer and diffuse large B‐cell lymphoma, and it can be used to predict survival and treatment response. 10 , 11 , 12 The CXI is composed of serum albumin, the neutrophil‐to‐lymphocyte ratio (NLR) and the skeletal muscle index (SMI). Serum albumin is an indicator of the disease seriousness and progression. Hypoalbuminaemia is associated with increased disease severity, a high risk of progression and low survival rates. 13 , 14 The NLR is a simple and effective systemic inflammatory marker to evaluate the prognosis of malignancies. Sarcopenia is an important factor affecting the prognosis of patients with cancer. 15 , 16 Radiographic SMI is also considered an important criterion for sarcopenia assessment. 17 , 18 Consequently, as it combines multiple assessments of nutrition, inflammation and the muscle, the CXI is considered to be a promising predictor for cancer cachexia and prognostic assessment.
However, owing to the complexity and cost of additional radiographic examination to assess the SMI, the applications of the CXI are somewhat limited. Hand grip strength (HGS) is a simple and effective method for measuring muscle strength, which is easy to perform and has low associated costs. Reportedly, HGS can provide important additional prognostic information for malignancies. 19 , 20 Therefore, this study aimed to develop a simple and practical HGS‐based CXI (H‐CXI) to predict the risk of cancer cachexia and to evaluate its short‐term and long‐term potential prognostic utility in patients with cancer.
Materials and methods
Population and study design
In this study, patients with cancer who were hospitalized at 41 Chinese medical institutions between 2012 and 2019 were prospectively assigned to the primary cohort. We randomly divided the primary cohort into the discovery and internal validation cohort at a ratio of 7:3 using computer‐generated random numbers. We also prospectively included inpatients with cancer from the Bethune First Hospital of Jilin University as the external validation cohort. The inclusion criteria of all cohorts were as follows: (a) patients with histopathologically confirmed malignancy, (b) patients with complete serological and anthropometric data and (c) patients over 18 years of age who voluntarily agreed to participate in this study. The exclusion criteria for all cohorts were as follows: (a) patients with clinical evidence of active infection or severe systemic immunodeficiency disease; (b) patients admitted to the intensive care unit at the beginning of recruitment; and (c) patients with a hospital stay of <48 h. If patients were hospitalized more than two times during the investigation, only data from the first survey were included. Patients were followed up annually through face‐to‐face or phone interviews until their death, last contact or last follow‐up. The final follow‐up was conducted on 30 October 2020. This study was carried out in accordance with the principles outlined in the Declaration of Helsinki and was approved by the ethics committees of all participating institutions. Written informed consent was obtained from all participants. All data in this study were analysed without disclosure of personal information.
Clinical and laboratory evaluation
All baseline patient information was collected by a project‐trained researcher during the patient's hospital stay. Demographic data included sex, age, co‐morbidities (hypertension and diabetes), lifestyle (smoking and drinking) and family history. Disease data included tumour type and pathological stage. Anti‐tumour therapy data included surgery, chemotherapy and radiotherapy. Hospitalization data included the length of hospitalization and total hospitalization expenses. Anthropometric data included height, weight, body mass index and HGS. An electronic hand grip dynamometer (Model EH101, Guangdong, China) was used to measure HGS. The protocol for measuring HGS was as follows: The patients held the dynamometer with maximum strength in their dominant hand; the test was repeated three times, and the maximum HGS was recorded. 21 Laboratory evaluation was performed at the clinical laboratories of the participating institutions using fasting blood samples drawn on admission, including evaluation of white blood cells, neutrophils, lymphocytes, platelets, red blood cells, haemoglobin and albumin. Rating scale data, which were assessed and recorded at baseline by trained staff, included the Karnofsky Performance Status questionnaire (KPS), Patient‐Generated Subjective Global Assessment (PG‐SGA), Nutrition Risk Screening 2002 (NRS2002) and European Organization for Research and Treatment of Cancer Quality of Life Questionnaire version 3.0 (EORTC QLQ‐C30).
Calculation of the H‐CXI and outcomes
The H‐CXI was calculated using the following formula: [HGS (kg)/height (m)2 × serum albumin (g/L)]/NLR. The NLR was defined as the ratio of neutrophils to lymphocytes. The main outcomes of this study included overall survival (OS), short‐term outcomes and cancer cachexia. OS was calculated as the time interval from the date of cancer diagnosis until the patient's death from any cause or until the last follow‐up. Short‐term outcomes were defined as all‐cause death within the period of 90 days after the patients received anti‐cancer therapy. Cancer cachexia was diagnosed according to the diagnostic criteria published by Fearon et al. in the 2011 International Expert Consensus on Cancer Cachexia 8 : (a) weight loss of >5% over the past 6 months (in the absence of simple starvation); or (b) BMI < 20 and any degree of weight loss >2%; or (c) skeletal muscle depletion (sarcopenia) and any degree of weight loss >2%. Skeletal muscle depletion was assessed by measuring the mid‐upper‐arm muscle area using anthropometry (men <32 cm2; women <18 cm2).
Statistical analysis
Continuous data with a normal distribution are expressed as means and standard deviations (SD). Continuous data with a non‐normal distribution are expressed as medians and interquartile range (IQR). Categorical data are expressed as numbers and percentages. Independent Student's t‐tests were used to compare two groups of normally distributed continuous variables, whereas non‐parametric tests were used to compare two groups of non‐normally distributed continuous variables. One‐way analysis of variance with post hoc test was employed to compare between‐group differences among multiple groups. Chi‐square or Fisher's exact tests were used for inter‐group comparisons of categorical variables. The standardized log‐rank statistic was employed to determine the optimal sex‐specific cutoff value of the H‐CXI based on survival status. The dose–response relationship between the H‐CXI and survival was evaluated using restricted cubic spline regression with three knots. The Kaplan–Meier method was used to draw survival curves, and the log‐rank test was used to compare the time–event relationships between groups. We determined the independent risk factors for the OS of patients using a Cox proportional hazard regression model. The risks were expressed as hazard ratios (HRs) and 95% confidence intervals (CIs). Sensitivity analysis was conducted using repeated survival analyses, excluding patients who died after 30 and 90 days. Logistic regression analysis was used to assess the association of the H‐CXI with short‐term outcomes and cancer cachexia. The risks were expressed as odds ratios (ORs) and 95% CIs. Statistical analyses were performed using R software (version 3.5.3; http://www.r‐Project.org). All statistical tests were two‐sided. Statistical significance was set at P < 0.05.
Results
Clinicopathologic characteristics of patients
Initially, this research surveyed 22 783 patients. After excluding 8101 patients with lack of clinicopathological information, a total of 14 682 patients were included in this study. In the primary cohort, 9412 patients with cancer met the inclusion criteria and were subsequently randomized into the discovery (6592) and internal validation (2820) cohorts. In the external validation cohort, 5270 patients with cancer were enrolled (Figure 1). The clinicopathological characteristics of the discovery, internal validation and external validation cohorts are shown in Table S1. Among all cohorts, 7962 (54.2%) of the patients were men, and 6720 (46.8%) were women. The mean age was 57.54 (±11.67) years. There were 1781 (12.1%) patients with stage I cancer, 3302 (22.5%) with stage II, 4039 (27.5%) with stage III and 5560 (37.9%) with stage IV. The tumours were most frequently located in the lung [3364 (22.9%)], colorectum [2764 (18.8%)], breast [2067 (14.1%)] and stomach [1664 (11.3%)]. The median follow‐up time was 20.07 (range IQR: 12.17–44.67) months.
Figure 1.
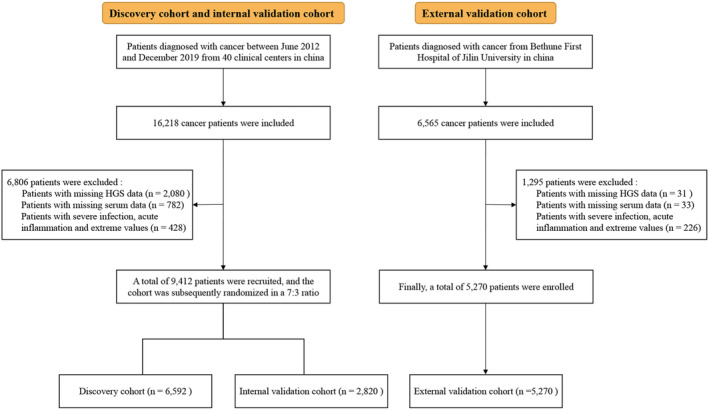
Study design and flow chart.
Relationship between clinicopathological characteristics and the H‐CXI
In the discovery cohort, the median H‐CXI for male was 158.61 (85.26–252.53), and the median H‐CXI of female was 137.93 (73.76–226.08). Standardized log‐rank statistics determined the optimal cut‐off values for the H‐CXI for male and female to be 175 and 113, respectively, in the discovery cohort (Figure S1). Therefore, 3245 patients were classified into the low H‐CXI group, and 3347 patients were classified into the high H‐CXI group. In the internal validation cohort, the low and high H‐CXI groups consisted of 1412 and 1408 patients, respectively. In the external validation cohort, 2635 and 2635 patients were in the low and high H‐CXI groups, respectively. We compared the differences in clinicopathological characteristics between the low and high H‐CXI groups; a low H‐CXI was significantly associated with the male sex, advanced age, co‐morbidities, drinking, smoking, advanced tumour‐node‐metastasis (TNM) stage, high systemic inflammation, malnutrition, adverse short‐term outcomes and all‐cause mortality (Table S2).
Comparison of the survival of low and high H‐CXI groups
During the follow‐up period from 2013 to 2020, 4973 (33.9%) patients died, including 2217 (33.6%) in the discovery cohort, 952 (33.8%) in the internal validation cohort and 1804 (34.2%) in the external validation cohort. We performed a time‐to‐event analysis to assess the potential of the H‐CXI as a predictor for assessing the prognosis of patients with cancer. Patients with a low H‐CXI had significantly lower OS than those with a high H‐CXI in the discovery cohort (6‐year survival percentage: 55.72% vs. 76.70%, log‐rank P < 0.001) (Figure 2A), internal validation cohort (6‐year survival percentage: 55.81% vs. 76.70%, log‐rank P < 0.001) (Figure 2B), external validation cohort (6‐year survival percentage: 56.05% vs. 75.48%, P < 0.001) (Figure 2C) and total cohort (6‐year survival percentage: 55.86% vs. 76.27%, log‐rank P < 0.001) (Figure 2D). We also constructed a sex‐specific Kaplan–Meier curve of the H‐CXI in patients with cancer and found that the H‐CXI could effectively stratify the prognosis of both male (Figure S2A) and female (Figure S2B). Moreover, the H‐CXI could further differentiate patients with adverse outcomes at the same pathological stage. Notably, the prognostic stratification effect of H‐CXI in patients with advanced stage disease was more significant than that in patients with early‐stage disease (Figure S3A–D). The H‐CXI also had good prognostic discriminatory performance in the prognostic assessment of all tumours (all log‐rank P < 0.05; Figure S4).
Figure 2.
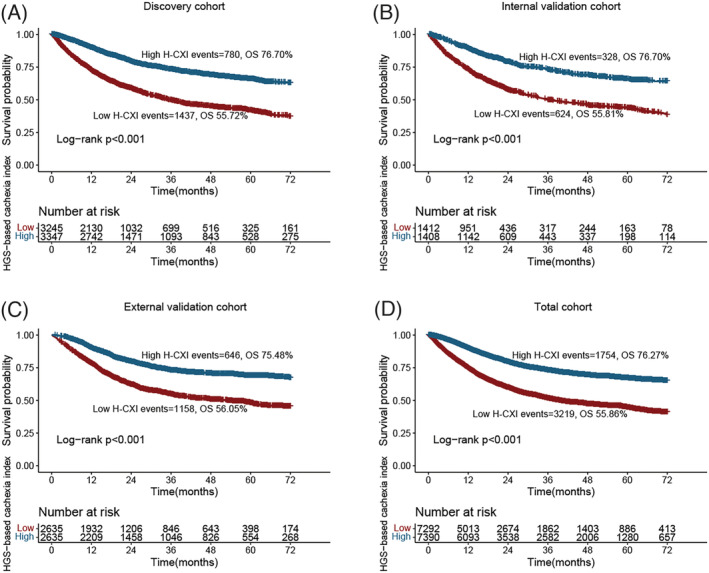
Kaplan–Meier curve of HGS‐based cachexia index in patients with cancer in different cohorts. (A) Discovery cohort. (B) Internal validation cohort. (C) External validation cohort. (D) Total cohort.
Relationship between H‐CXI and survival
There was evidence of a significant non‐linear relationship between the H‐CXI and patient survival in all cohorts (Figure 3A–D). The multivariate Cox proportional risk regression model confirmed that a low H‐CXI was an independent risk factor for the prognosis of patients with cancer under the different adjustment models. For each SD change in the H‐CXI, the HR of prognosis in patients with cancer changed by 25% (HR 0.75, 95% CI 0.71–0.80, P < 0.001) in the discovery cohort, 21% (HR 0.79, 95% CI 0.72–0.86, P < 0.001) in the internal validation cohort, 16% (HR 0.84, 95% CI 0.79–0.89, P < 0.001) in the external validation cohort and 20% (HR 0.80, 95% CI 0.77–0.83, P < 0.001) in the total cohort (Table 1). Notably, we found that the significant positive association between the H‐CXI and survival was persistent in the multivariate survival analysis based on sex (Figure S5 and Table S3). In addition, we performed subgroup analyses based on various clinicopathological characteristics, including age, sex, BMI, hypertension, diabetes, smoking, drinking, family history, pathological stage, surgery, chemotherapy and radiotherapy. The results indicated that the H‐CXI was an independent prognostic factor in most subgroups (Figure S6A–D). Finally, we excluded patients with deaths after 30 and 90 days as a sensitivity analysis and found that short‐term death did not affect the association between the H‐CXI and patient prognosis (Table S4).
Figure 3.
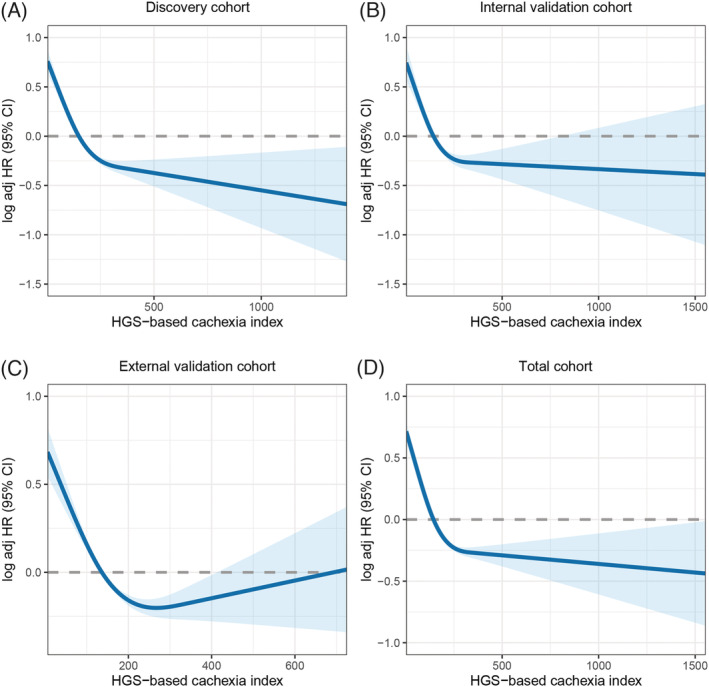
The association between HGS‐based cachexia index and survival in patients with cancer. (A) Discovery cohort. (B) Internal validation cohort. (C) External validation cohort. (D) Total cohort.
Table 1.
Association between HGS‐based cachexia index and survival of patients with cancer at different cohorts
| H‐CXI | Discovery cohort | Internal validation cohort | External validation cohort | All population | ||||
|---|---|---|---|---|---|---|---|---|
| HR (95% CI) | P value | HR (95% CI) | P value | HR (95% CI) | P value | HR (95% CI) | P value | |
| Continuous | ||||||||
| Model a | 0.63(0.59,0.67) | <0.001 | 0.65(0.59,0.71) | <0.001 | 0.77(0.73,0.82) | <0.001 | 0.69(0.66,0.72) | <0.001 |
| Model b | 0.73(0.69,0.77) | <0.001 | 0.78(0.71,0.86) | <0.001 | 0.85(0.81,0.90) | <0.001 | 0.79(0.76,0.82) | <0.001 |
| Model c | 0.75(0.71,0.80) | <0.001 | 0.79(0.72,0.86) | <0.001 | 0.84(0.79,0.89) | <0.001 | 0.80(0.77,0.83) | <0.001 |
| Categorical | ||||||||
| Model a | 0.42(0.39,0.46) | <0.001 | 0.44(0.38,0.50) | <0.001 | 0.48(0.44,0.53) | <0.001 | 0.45(0.42,0.48) | <0.001 |
| Model b | 0.56(0.51,0.61) | <0.001 | 0.61(0.53,0.70) | <0.001 | 0.60(0.54,0.66) | <0.001 | 0.58(0.55,0.62) | <0.001 |
| Model c | 0.61(0.55,0.66) | <0.001 | 0.64(0.56,0.74) | <0.001 | 0.62(0.56,0.69) | <0.001 | 0.62(0.58,0.66) | <0.001 |
Model a: No adjusted. Model b: Adjusted for age, sex, BMI, TNM stage. Model c: Adjusted for age, sex, BMI, TNM stage, tumour type, surgery, radiotherapy, chemotherapy, hypertension, diabetes, smoking, drinking, family history.
Relationship between H‐CXI and short‐term outcomes
In total, 673 (4.6%) patients experienced short‐term outcomes, including 339 (5.1%) in the discovery cohort, 153 (5.4%) in the internal validation cohort and 181 (3.4%) in the external validation cohort. We found that a low H‐CXI was significantly associated with short‐term outcomes (discovery cohort: 8.7% vs. 1.7%; internal validation cohort: 8.6% vs. 2.2%; external validation cohort: 5.8% vs. 1.1%, all P < 0.001). Multivariate logistic regression models showed that a low H‐CXI was an independent predictor for adverse short‐term outcomes in patients with cancer (Table S5). We subsequently performed a sex‐based subgroup multivariate analysis, which still showed that, compared with those of patients with a high H‐CXI, the short‐term outcomes of patients with a low H‐CXI were significantly worse (Table S6).
Relationship between H‐CXI and cancer cachexia
We explored the distribution of the H‐CXI levels in non‐cachexia and cachexia populations with different tumour types. We found that the H‐CXI levels in patients with cachexia were generally lower than those with non‐cachexia regardless of patient subgroup. In addition, the level of H‐CXI was significantly low in patients with hepatobiliary, pancreatic and lung cancers and high in those with breast, urinary and nasopharyngeal cancers (Figure S7). According to the diagnostic criteria for cancer cachexia, 4262 (29.0%) patients experienced cancer cachexia, including 2065 (31.3%) in the discovery cohort, 916 (32.5%) in the internal validation cohort and 1281 (24.3%) in the external validation cohort. Notably, the low H‐CXI group had a higher risk of developing cancer cachexia than the high H‐CXI group (discovery cohort: 39.3% vs. 23.6%; internal validation cohort: 40.2% vs. 24.8; external validation cohort: 31.0% vs. 17.6%). In the multivariate logistic regression models, a low H‐CXI was independently associated with a high risk of cancer cachexia. For every SD increase in H‐CXI, the risk of cancer cachexia in patients with cancer was reduced by more than 10% in all cohorts. In addition, the risk of cachexia was over 40% higher in patients with a low H‐CXI than in those with a high H‐CXI (Table 2). When stratified by sex subgroup, the H‐CXI was observed to be an independent factor affecting cancer cachexia (Table S7).
Table 2.
Logistic regression analysis of HGS‐based cachexia index associated with cachexia
| H‐CXI | Discovery cohort | Internal validation | External validation | All population | ||||
|---|---|---|---|---|---|---|---|---|
| OR (95% CI) | P value | OR (95% CI) | P value | OR (95% CI) | P value | OR (95% CI) | P value | |
| Continuous | ||||||||
| Model a | 0.74 (0.69,0.79) | <0.001 | 0.70 (0.63,0.77) | <0.001 | 0.80 (0.75,0.86) | <0.001 | 0.75 (0.72,0.79) | <0.001 |
| Model b | 0.85 (0.80,0.91) | <0.001 | 0.81 (0.73,0.90) | <0.001 | 0.90 (0.84,0.96) | 0.003 | 0.86 (0.83,0.90) | <0.001 |
| Model c | 0.85 (0.80,0.91) | <0.001 | 0.82 (0.74,0.91) | <0.001 | 0.90 (0.84,0.97) | 0.004 | 0.86 (0.83,0.90) | <0.001 |
| Categorical | ||||||||
| Model a | 0.48 (0.43,0.53) | <0.001 | 0.49 (0.42,0.58) | <0.001 | 0.48 (0.42,0.54) | <0.001 | 0.48 (0.45,0.52) | <0.001 |
| Model b | 0.63 (0.56,0.71) | <0.001 | 0.65 (0.54,0.78) | <0.001 | 0.63 (0.55,0.73) | <0.001 | 0.64 (0.59,0.7) | <0.001 |
| Model c | 0.64 (0.57,0.72) | <0.001 | 0.66 (0.55,0.79) | <0.001 | 0.64 (0.56,0.74) | <0.001 | 0.65 (0.6,0.71) | <0.001 |
Model a: No adjusted. Model b: Adjusted for age, sex, BMI, TNM stage. Model c: Adjusted for age, sex, BMI, TNM stage, tumour type, surgery, radiotherapy, chemotherapy, hypertension, diabetes, smoking, drinking, family history.
Discussion
In this study, for the first time, we developed the H‐CXI using HGS and validated its reliability in assessing prognosis and predicting cancer cachexia in multiple independent cohorts. We found that a low H‐CXI was associated with advanced age, co‐morbidities, advanced TNM stage, high systemic inflammation and malnutrition, suggesting that a decrease in the H‐CXI reflected disease progression. Our multivariate survival analyses showed that the H‐CXI was independently associated with the prognosis of patients with cancer, especially lung cancer and gastrointestinal tumours. Moreover, the H‐CXI is valuable in the risk assessment of short‐term outcomes and cancer cachexia. A low H‐CXI was found to be an independent predictor for short‐term outcomes and cancer cachexia in patients with cancer. Overall, we demonstrated that the H‐CXI is a powerful predictor for assessing adverse outcomes and cancer cachexia in patients with cancer. These findings may be valuable in helping clinicians design effective anti‐tumour therapies and follow‐up strategies. H‐CXI can be used to screen high‐risk patients with cancer cachexia and poor prognosis, such that nutritional intervention, exercise intervention and anti‐inflammatory treatment and intensity of anti‐cancer treatment can be purposefully strengthened as appropriate for these patients. During treatment, monitoring H‐CXI trajectories can also help to understand the efficacy of anti‐cancer therapy in cancer patients.
TNM stage is the most widely used tool for assessing disease progression and prognosis in cancer. However, its predictive reliability and availability have been recently questioned because it only evaluates tumour characteristics and ignores host‐related factors. 22 , 23 We found that the H‐CXI could further differentiate poor prognosis in patients with the same pathological stage, suggesting that the H‐CXI could serve as a useful prognostic stratification complement to the TNM stage. Notably, we found that the H‐CXI was better at assessing prognosis in advanced‐stage patients than in early‐stage patients. We hypothesized that this may be because host‐related factors are still in a correctable state at the early stage of the disease, when host‐related factors have little impact on prognosis. As the disease progresses, the host's state of hyperinflammation, malnutrition and sarcopenia reaches an irreversible state of cachexia; thus, host‐related factors gradually play a leading role in the prognosis of patients with cancer.
It is difficult to assess the severity of cachexia because of the lack of simple and robust biomarkers to identify at‐risk patients. 24 To estimate the extent of cancer cachexia, our study integrated the clinical characteristics of cancer cachexia reflecting muscle strength, systemic inflammation and nutritional status into a composite index, the H‐CXI, and confirmed that the H‐CXI is an effective prognostic tool for cancer. The use of the original CXI is limited because of high testing costs and complicated testing procedures. In addition, radiographic SMI is often measured by hand‐painted measurement bordered muscle mass, which inevitably has a certain amount of subjectivity. To the best of our knowledge, research on this index has been stalled since its development in 2015. Thus, herein, we replaced the complex SMI with the more practical HGS to assess muscle status. Compared with original CXI, the newly currently developed H‐CXI has the advantages of simple operation, low costs and obvious prediction effects, making it more suitable for clinical applications.
H‐CXI integrates the advantages of HGS, serum albumin and NLR and can more comprehensively reflect the muscle and inflammatory pathological conditions of cachexia than a single indicator. HGS is a simple and non‐invasive anthropometric measure measurement of muscle strength, and several guidelines have recommended low HGS as an important indicator for defining sarcopenia and cancer cachexia in clinical practice. 25 , 26 NLR is reported to be a simple and effective indicator of systemic inflammation. The change in serum albumin may be the result of the combined effect of the liver's reordering of protein synthesis in vivo and the redistribution of albumin in and out of blood vessels under condition of high inflammation. 27 Therefore, NLR and serum albumin can comprehensively reflect the inflammatory state of the host.
Our study also had several limitations. First, the patients included in this study were limited to multicenter medical institutions in China. It remains to be seen whether these findings can be extended to patients outside the Chinese population. Second, this was an observational study, and there may be potential confounding factors. However, we comprehensively collected baseline characteristics of patients and adjusted for covariates based on statistical and scientific methods to minimize this possibility. In addition, there were differences in tumour types between the cohorts, which resulted in incomplete uniformity of clinicopathological factors between cohorts; thus, there was a certain selection bias. To overcome these barriers, there is a need to conduct further prospective trials with larger populations and stricter inclusion criteria. Finally, although the usefulness of H‐CXI has been demonstrated in this study, there is currently no evidence that it is superior to CXI due to the lack of SMI data.
Conclusion
This study confirmed that the simple and practical H‐CXI is a promising predictor for cancer cachexia and prognosis of patients with cancer. Additionally, it has wide clinical applications in prognosis and cancer cachexia research.
Conflict of interest
The authors declare that there is no conflict of interest.
Supporting information
Figure S1. Sex‐specific cutoff value of H‐CXI.
Figure S2. Sex‐specific Kaplan–Meier curve of HGS‐based cachexia index in patients with cancer in different cohorts.
Figure S3. Subgroup survival analysis based on different pathological stages.
Figure S4. Subgroup survival analysis of HGS‐based cachexia index of different cancers at total cohort.
Figure S5. Sex‐specific association between HGS‐based cachexia index and survival in patients with cancer.
Figure S6. The association between HGS‐based cachexia index and hazard risk of survival in various subgroups.
Figure S7. HGS‐based cachexia index in different cancers stratified by whether patients with cachexia (ns p‐value >0.05, * p‐value<0.05, **** p‐value<0.001).
Table S1. Characteristics of the different cohorts.
Table S2. Characteristics classified by level of the HGS‐based cachexia index in patients with cancer.
Table S3. Association between the HGS‐based cachexia index and survival of patients with cancer based on sex.
Table S4. Sensitivity analysis of the relationship between HGS‐based cachexia index and survival.
Table S5. Logistic regression analysis of the HGS‐based cachexia index associated with short‐term outcome (90‐day).
Table S6. Sex‐specific logistic regression analysis of the HGS‐based cachexia index associated with short‐term outcomes (90‐day).
Table S7. Sex‐specific logistic regression analysis of HGS‐based cachexia index associated with cachexia.
Acknowledgements
We all appreciate the support from the National Key Research and Development Program to Dr Han‐Ping Shi (No. 2017YFC1309200 and No. 2022YFC2009600) and the Beijing Municipal Science and Technology Commission (SCW2018‐06). We are grateful to all the participants who have been part of the project and to the many members of the study teams at different study centres who enabled this research.
The authors of this manuscript certify that they comply with the ethical guidelines for authorship and publishing in the Journal of Cachexia, Sarcopenia and Muscle. 28 This study followed the Helsinki Declaration. All participants provided written informed consent, and this study was approved by the Institutional Review Board of each hospital (registration number: ChiCTR1800020329).
Xie H., Ruan G., Wei L., Zhang H., Ge Y., Zhang Q., Lin S., Song M., Zhang X., Liu X., Li X., Zhang K., Yang M., Tang M., Song C.‐H., Gan J., and Shi H.‐P. (2023) Hand grip strength‐based cachexia index as a predictor of cancer cachexia and prognosis in patients with cancer, Journal of Cachexia, Sarcopenia and Muscle, 14, 382–390, 10.1002/jcsm.13139
Hailun Xie, Guotian Ruan and Lishuang Wei contributed equally to this work and therefore share first authorship.
References
- 1. Kocarnik JM, Compton K, Dean FE, Fu W, Gaw BL, Harvey JD, et al. Cancer incidence, mortality, years of life lost, years lived with disability, and disability‐adjusted life years for 29 cancer groups from 2010 to 2019: A systematic analysis for the global burden of disease study 2019. JAMAOncologia 2021;8:420–444. [DOI] [PMC free article] [PubMed] [Google Scholar]
- 2. Sung H, Ferlay J, Siegel RL, Laversanne M, Soerjomataram I, Jemal A, Bray F. Global cancer statistics 2020: GLOBOCAN estimates of incidence and mortality worldwide for 36 cancers in 185 countries. CA Cancer J Clin 2021;71:209–249. [DOI] [PubMed] [Google Scholar]
- 3. Foreman KJ, Marquez N, Dolgert A, Fukutaki K, Fullman N, McGaughey M, Pletcher MA, Smith AE, Tang K, Yuan CW, Brown JC, Friedman J, He J, Heuton KR, Holmberg M, Patel DJ, Reidy P, Carter A, Cercy K, Chapin A, Douwes‐Schultz D, Frank T, Goettsch F, Liu PY, Nandakumar V, Reitsma MB, Reuter V, Sadat N, Sorensen RJD, Srinivasan V, Updike RL, York H, Lopez AD, Lozano R, Lim SS, Mokdad AH, Vollset SE, Murray CJL. Forecasting life expectancy, years of life lost, and all‐cause and cause‐specific mortality for 250 causes of death: Reference and alternative scenarios for 2016‐40 for 195 countries and territories. Lancet 2018;392:2052–2090. [DOI] [PMC free article] [PubMed] [Google Scholar]
- 4. Bray F, Jemal A, Grey N, Ferlay J, Forman D. Global cancer transitions according to the human development index (2008‐2030): A population‐based study. Lancet Oncol 2012;13:790–801. [DOI] [PubMed] [Google Scholar]
- 5. von Haehling S, Anker SD. Cachexia as a major underestimated and unmet medical need: Facts and numbers. J Cachexia Sarcopenia Muscle 2010;1:1–5. [DOI] [PMC free article] [PubMed] [Google Scholar]
- 6. da Rocha IMG, Marcadenti A, de Medeiros GOC, Bezerra RA, Rego JFM, Gonzalez MC, et al. Is cachexia associated with chemotherapy toxicities in gastrointestinal cancer patients? A prospective study. J Cachexia Sarcopenia Muscle 2019;10:445–454. [DOI] [PMC free article] [PubMed] [Google Scholar]
- 7. Kasvis P, Vigano M, Vigano A. Health‐related quality of life across cancer cachexia stages. Ann Palliat Med 2019;8:33–42. [DOI] [PubMed] [Google Scholar]
- 8. Fearon K, Strasser F, Anker SD, Bosaeus I, Bruera E, Fainsinger RL, Jatoi A, Loprinzi C, MacDonald N, Mantovani G, Davis M, Muscaritoli M, Ottery F, Radbruch L, Ravasco P, Walsh D, Wilcock A, Kaasa S, Baracos VE. Definition and classification of cancer cachexia: An international consensus. Lancet Oncol 2011;12:489–495. [DOI] [PubMed] [Google Scholar]
- 9. Jafri SH, Previgliano C, Khandelwal K, Shi R. Cachexia index in advanced non‐small‐cell lung cancer patients. Clin Med Insights Oncol 2015;9:87–93. [DOI] [PMC free article] [PubMed] [Google Scholar]
- 10. Go SI, Park MJ, Lee GW. Clinical significance of the cachexia index in patients with small cell lung cancer. BMC Cancer 2021;21:563. [DOI] [PMC free article] [PubMed] [Google Scholar]
- 11. Go SI, Park MJ, Park S, Kang MH, Kim HG, Kang JH, Kim JH, Lee GW. Cachexia index as a potential biomarker for cancer cachexia and a prognostic indicator in diffuse large B‐cell lymphoma. J Cachexia Sarcopenia Muscle 2021;12:2211–2219. [DOI] [PMC free article] [PubMed] [Google Scholar]
- 12. Karmali R, Alrifai T, Fughhi IAM, Ng R, Chukkapalli V, Shah P, Basu S, Nathan S, Szymanski‐Grant K, Gordon LI, Venugopal P, Penedo FJ, Borgia JA. Impact of cachexia on outcomes in aggressive lymphomas. Ann Hematol 2017;96:951–956. [DOI] [PubMed] [Google Scholar]
- 13. Haskins IN, Baginsky M, Amdur RL, Agarwal S. Preoperative hypoalbuminemia is associated with worse outcomes in colon cancer patients. Clin Nutr 2017;36:1333–1338. [DOI] [PubMed] [Google Scholar]
- 14. Hu WH, Eisenstein S, Parry L, Ramamoorthy S. Preoperative malnutrition with mild hypoalbuminemia associated with postoperative mortality and morbidity of colorectal cancer: A propensity score matching study. Nutr J 2019;18:33. [DOI] [PMC free article] [PubMed] [Google Scholar]
- 15. Xie H, Gong Y, Kuang J, Yan L, Ruan G, Tang S, Gao F, Gan J. Computed tomography‐determined sarcopenia is a useful imaging biomarker for predicting postoperative outcomes in elderly colorectal cancer patients. Cancer Res Treat 2020;52:957–972. [DOI] [PMC free article] [PubMed] [Google Scholar]
- 16. Xiao J, Caan BJ, Cespedes Feliciano EM, Meyerhardt JA, Peng PD, Baracos VE, Lee VS, Ely S, Gologorsky RC, Weltzien E, Kroenke CH, Kwan ML, Alexeeff SE, Castillo AL, Prado CM. Association of low muscle mass and low muscle radiodensity with morbidity and mortality for colon cancer surgery. JAMA Surg 2020;155:942–949. [DOI] [PMC free article] [PubMed] [Google Scholar]
- 17. Xie H, Wei L, Liu M, Yuan G, Tang S, Gan J. Preoperative computed tomography‐assessed sarcopenia as a predictor of complications and long‐term prognosis in patients with colorectal cancer: A systematic review and meta‐analysis. Langenbecks Arch Surg 2021;406:1775–1788. [DOI] [PubMed] [Google Scholar]
- 18. Ubachs J, Ziemons J, Minis‐Rutten IJG, Kruitwagen R, Kleijnen J, Lambrechts S, et al. Sarcopenia and ovarian cancer survival: a systematic review and meta‐analysis. J Cachexia Sarcopenia Muscle 2019;10:1165–1174. [DOI] [PMC free article] [PubMed] [Google Scholar]
- 19. Song M, Zhang Q, Tang M, Zhang X, Ruan G, Zhang X, Zhang K, Ge Y, Yang M, Li Q, Li X, Liu X, Li W, Cong M, Wang K, Song C, Shi H. Associations of low hand grip strength with 1 year mortality of cancer cachexia: A multicentre observational study. J Cachexia Sarcopenia Muscle 2021;12:1489–1500. [DOI] [PMC free article] [PubMed] [Google Scholar]
- 20. Zhuang CL, Zhang FM, Li W, Wang KH, Xu HX, Song CH, Guo ZQ, Shi HP. Associations of low handgrip strength with cancer mortality: A multicentre observational study. J Cachexia Sarcopenia Muscle 2020;11:1476–1486. [DOI] [PMC free article] [PubMed] [Google Scholar]
- 21. Watanabe T, Owashi K, Kanauchi Y, Mura N, Takahara M, Ogino T. The short‐term reliability of grip strength measurement and the effects of posture and grip span. J Hand Surg Am 2005;30:603–609. [DOI] [PubMed] [Google Scholar]
- 22. Spolverato G, Bagante F, Weiss M, Alexandrescu S, Marques HP, Aldrighetti L, Maithel SK, Pulitano C, Bauer TW, Shen F, Poultsides GA, Soubrane O, Martel G, Koerkamp BG, Guglielmi A, Itaru E, Pawlik TM. Comparative performances of the 7th and the 8th editions of the American Joint Committee on Cancer staging systems for intrahepatic cholangiocarcinoma. J Surg Oncol 2017;115:696–703. [DOI] [PubMed] [Google Scholar]
- 23. Kang SH, Hwang S, Lee YJ, Kim KH, Ahn CS, Moon DB, Ha TY, Song GW, Jung DH, Lee SG. Prognostic comparison of the 7th and 8th editions of the American Joint Committee on Cancer staging system for intrahepatic cholangiocarcinoma. J Hepatobiliary Pancreat Sci 2018;25:240–248. [DOI] [PubMed] [Google Scholar]
- 24. Argilés JM, López‐Soriano FJ, Toledo M, Betancourt A, Serpe R, Busquets S. The cachexia score (CASCO): A new tool for staging cachectic cancer patients. J Cachexia Sarcopenia Muscle 2011;2:87–93. [DOI] [PMC free article] [PubMed] [Google Scholar]
- 25. Cruz‐Jentoft AJ, Bahat G, Bauer J, Boirie Y, Bruyère O, Cederholm T, Cooper C, Landi F, Rolland Y, Sayer AA, Schneider SM, Sieber CC, Topinkova E, Vandewoude M, Visser M, Zamboni M, Writing Group for the European Working Group on Sarcopenia in Older People 2 (EWGSOP2), and the Extended Group for EWGSOP2 , Bautmans I, Baeyens JP, Cesari M, Cherubini A, Kanis J, Maggio M, Martin F, Michel JP, Pitkala K, Reginster JY, Rizzoli R, Sánchez‐Rodríguez D, Schols J. Sarcopenia: Revised European consensus on definition and diagnosis. Age Ageing 2019;48:16–31. [DOI] [PMC free article] [PubMed] [Google Scholar]
- 26. Vanhoutte G, van de Wiel M, Wouters K, Sels M, Bartolomeeussen L, De Keersmaecker S, et al. Cachexia in cancer: What is in the definition? BMJ Open Gastroenterol 2016;3:e000097. [DOI] [PMC free article] [PubMed] [Google Scholar]
- 27. Evans DC, Corkins MR, Malone A, Miller S, Mogensen KM, Guenter P, Jensen GL, the ASPEN Malnutrition Committee . The use of visceral proteins as nutrition markers: An ASPEN position paper. Nutr Clin Pract 2021;36:22–28. [DOI] [PubMed] [Google Scholar]
- 28. von Haehling S, Morley JE, Coats AJS, Anker SD. Ethical guidelines for publishing in the Journal of Cachexia, Sarcopenia and Muscle: update 2021. J Cachexia Sarcopenia Muscle 2021;12:2259–2261. [DOI] [PMC free article] [PubMed] [Google Scholar]
Associated Data
This section collects any data citations, data availability statements, or supplementary materials included in this article.
Supplementary Materials
Figure S1. Sex‐specific cutoff value of H‐CXI.
Figure S2. Sex‐specific Kaplan–Meier curve of HGS‐based cachexia index in patients with cancer in different cohorts.
Figure S3. Subgroup survival analysis based on different pathological stages.
Figure S4. Subgroup survival analysis of HGS‐based cachexia index of different cancers at total cohort.
Figure S5. Sex‐specific association between HGS‐based cachexia index and survival in patients with cancer.
Figure S6. The association between HGS‐based cachexia index and hazard risk of survival in various subgroups.
Figure S7. HGS‐based cachexia index in different cancers stratified by whether patients with cachexia (ns p‐value >0.05, * p‐value<0.05, **** p‐value<0.001).
Table S1. Characteristics of the different cohorts.
Table S2. Characteristics classified by level of the HGS‐based cachexia index in patients with cancer.
Table S3. Association between the HGS‐based cachexia index and survival of patients with cancer based on sex.
Table S4. Sensitivity analysis of the relationship between HGS‐based cachexia index and survival.
Table S5. Logistic regression analysis of the HGS‐based cachexia index associated with short‐term outcome (90‐day).
Table S6. Sex‐specific logistic regression analysis of the HGS‐based cachexia index associated with short‐term outcomes (90‐day).
Table S7. Sex‐specific logistic regression analysis of HGS‐based cachexia index associated with cachexia.