

Abstract
Background
Low physical activity (PA) increases the prevalence of chronic kidney disease (CKD). This study aimed to investigate the effects of PA and sedentary time (ST) on the changes in renal function and the development of CKD in the middle‐aged Korean population.
Methods
From the Korean Genome and Epidemiology Study Database, 7988 participants in their 40s and 60s were identified and stratified by (1) PA: high‐PA (>24 MET‐h/day), moderate‐PA (9–24 MET‐h/day) and low‐PA (<9 MET‐h/day); and (2) ST: high‐ST (>6 h/day), moderate‐ST (3–6 h/day) and low‐ST (<3 h/day). Incident CKD was defined as estimated glomerular filtration rate (eGFR) < 60 mL/min/1.73 m2 following the Chronic Kidney Disease Epidemiology Collaboration equation.
Results
The mean age of the participants was 52.0 years. The overall incidence of CKD was 16.8 per 1000 person‐years over a median of 12 years. The lower the PA and the higher the ST, the lower the baseline eGFR. Relative to the high‐PA, the coefficients of the annual eGFR decline were −0.12 (95% confidence interval [CI]: −0.26 to 0.001, P = 0.081) and −0.13 (95% CI: −0.27 to 0.01, P = 0.078) in the moderate‐ and low‐PA groups, respectively. Similarly, relative to the low‐ST, the coefficients of annual eGFR decline were −0.07 (59% CI: −0.19 to 0.05, P = 0.236) and −0.14 (95% CI: −0.28 to −0.01, P = 0.039) in the moderate‐ and high‐ST groups, respectively. Incident CKD was higher with lower PA (hazard ratio: high‐PA 1.00, moderate‐PA 1.13 [1.00, 1.28, P = 0.056] and low‐PA 1.25 [1.11, 1.24, P < 0.001]) and higher ST (hazard ratio: low‐ST 1.00, moderate‐ST 1.04 [0.94, 1.16, P = 0.440] and high‐ST 1.19 [1.05, 1.34, P = 0.007]). The high‐PA reduced the risk for the CKD development irrespective of the amount of ST.
Conclusions
Low‐PA and high‐ST are risk factors for the development of CKD in the middle‐aged Korean population. High‐PA recovers high‐ST, inducing a harmful effect on the occurrence of CKD.
Keywords: chronic kidney disease, physical activity, renal function, sedentary time
Introduction
The incidence of chronic kidney disease (CKD) is continuously increasing, and the prevalence of CKD is reported to be approximately 13.4% globally. 1 Not only in Western countries, but the number of CKD patients is also rising in Asian CKD countries, with a prevalence rate of 13.7% in South Korea, 12.9% in Japan and 10.8% in China. 2 Old age, hypertension and diabetes are well‐known high‐risk groups for CKD. Low physical activity (PA) and high sedentary time (ST) are consistently identified as modifiable risk factors for the development of CKD. However, the association between PA and CKD has not been consistently reported due to differences in participant characteristics and measurement of PA or ST.
The metabolic benefits of PA combine to reduce the risks of cardiovascular diseases, such as stroke and coronary artery disease. In contrast, lack of PA leads to obesity and metabolic disorders, including diabetes and dyslipidaemia, which are well‐known causes of CKD. Low‐PA was also found to be associated with a higher occurrence of CKD. 3 , 4 , 5 Epidemiologic studies have shown that modern people spend more than 50% of their time on sedentary behaviours. 6 ST is a critical risk factor for diabetes and is associated with increased cardiovascular and all‐cause mortality. 7 Greater sedentary behaviour was significantly associated with reduced renal function in a cross‐sectional survey. However, it is not clear whether higher PA attenuates the detrimental effect of sedentary behaviour on renal function or vice versa. This study aimed to clarify the extent to which PA and ST affect kidney function and the occurrence of CKD in the middle‐aged Korean general population. We hypothesized that augmented PA would protect against the harmful effects of high‐ST in CKD.
Materials and methods
Study design and participants
This study utilized prospective community‐based cohort data from the Korean Genome and Epidemiology Study (KoGES). 8 Participant enrollment procedures and characteristics of the communities have been reported in detail elsewhere. 8 Our cohort consisted of 10 030 participants residing in Ansan (urban area) and Ansung (rural area), South Korea. All participants were aged between 40 and 69 years in 2001 and participated in bi‐yearly physical assessments up to 2016. This study enrolled subjects between 2001 and 2002 and finished follow‐ups between 2016 and 2018. The median follow‐up period is 12 years; however, some participants were followed up for 14 or 16 years. We excluded participants with estimated glomerular filtration rate (eGFR) < 60 mL/min/1.73 m2 (n = 216), urinary protein ≥ 1+ on urinalysis (n = 218), a history of kidney disease (n = 260), no follow‐up data for eGFR (n = 934), missing values at baseline in eGFR (n = 2), urinary protein (n = 33), blood pressure (BP) (n = 8), body mass index (BMI) (n = 3), C‐reactive protein (n = 1), PA (n = 347) and sedentary behaviour (n = 20). The remaining 7988 participants were included in the study cohort. Figure 1 shows the details of the inclusion and exclusion steps. This study was approved by the Institutional Review Board of Kyung Hee University Hospital at Gangdong (KHNMC 2020‐01‐019‐002), and de‐identified data from the KoGES were obtained under a data sharing agreement with the Division of Genetic Epidemiology and Health Index.
Figure 1.
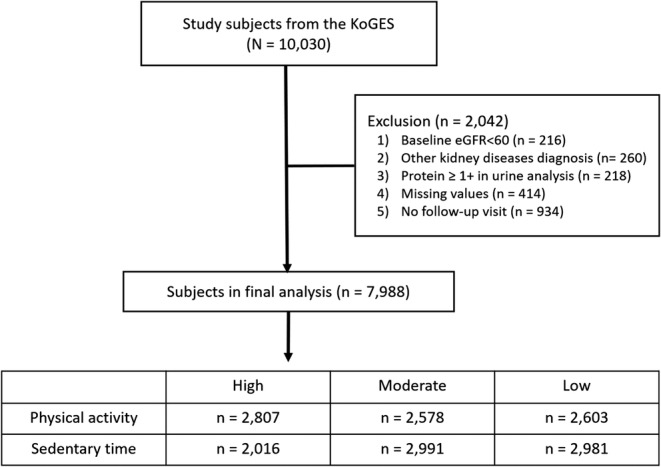
Study design. eGFR, estimated glomerular filtration rate; KoGES, Korean Genome and Epidemiology Study
Data collection and measurements
We extracted the participants' baseline characteristics from the KoGES registry. These include sociodemographic profile (e.g., age and sex), lifestyle profile (e.g., alcohol consumption, tobacco use profile, occupational groups, low/moderate/vigorous levels of PA and sitting/stable behaviours), body measurements (e.g., height, weight and BMI), nutrition examination survey (e.g., energy, sodium and potassium), vital signs (e.g., systolic blood pressure [SBP] and diastolic blood pressure [DBP]), chemistry panels (e.g., haemoglobin A1c, fasting plasma glucose, high‐density lipoprotein, total cholesterol, triglycerides, creatinine, blood urea nitrogen and C‐reactive protein), urinalysis (e.g., urine protein), disease history (e.g., diabetes, hypertension, dyslipidaemia and kidney disease) and drug usage history (e.g., diabetes, hypertension and dyslipidaemia). Data comprising sociodemographic and lifestyle profiles were collected using simple questionnaires with dichotomous response options, ‘Yes’ or ‘No’. A diet assessment was administered using a semi‐quantitative food frequency questionnaire (FFQ). 9 The KoGES collected job information using the following categories: (1) housewife, (2) office job, (3) agriculture, (4) self‐employment, (5) sales, (6) factory workers, (7) specialized job and (8) others. We divided the participants into four groups according to the amount of occupational PA and characteristics. Group 1 (G1) with high‐PA includes (3) and (6). Group 2 (G2) with low‐PA includes (2), (4), (5) and (7). Group 3 (G3) consists of the housewives. Group 4 (G4) includes other unclassified jobs. Blood and urine were collected in the morning after 8‐h fasting. We also extracted the participants' follow‐up observations, including creatinine levels and kidney disease diagnosis.
Data preprocessing
First, the primary outcome of this study was the occurrence of CKD. We defined CKD as the occurrence of eGFR < 60 mL/min/1.73 m2 over a 12‐year follow‐up period using the CKD Epidemiology Collaboration (CKD‐EPI) equation. Next, we determined the amounts of PA and ST, respectively. Participants answered the self‐administered questionnaire (Supporting Information, Table S1 ), which enquired about the time spent per day performing light (e.g., walking), moderate (e.g., brisk walking) and vigorous (e.g., running) activities at work and home. We calculated the amount of PA based on metabolic hours per day (MET‐h/day) using a weighted sum of daily low/moderate/vigorous levels of PA hours multiplied by 2, 4, and 8, respectively. Participants answered the ST questionnaires, which asked about the time spent sitting and lying down per day except sleeping (e.g., driving, sewing and watching television). ST was calculated as the sum of daily sedentary behaviour hours. We categorized the amount of PA and ST into three groups: high‐PA > 24 MET‐h/day, moderate‐PA 9–24 MET‐h/day and low‐PA < 9 MET‐h/day; and high‐ST > 6 h/day, moderate‐ST 3–6 h/day and low‐ST < 3 h/day, respectively. The response options for the PA and ST questionnaires were categorized into nine groups without an open‐ended response. The upper hour limit for both PA and ST data is 5 h (‘Over 5 hours’) in the original questionnaire and thus extreme data cannot be identified. In this study, the PA/ST time of the participants who answered for more than 5 h was calculated as 6 h. We segmented the participants into three groups (high/moderate/low‐PA/ST) according to equal frequency. Second, eGFR was calculated using the CKD‐EPI equation. 10 Annual eGFR decline was calculated as follows: [(eGFR at last follow‐up − eGFR at baseline)/eGFR at baseline]/follow‐up period (years). Finally, we identified the presence of comorbidities. The presence of comorbidities was identified based on the presence of clinical biomarkers, disease history or drug usage history at baseline. Diabetes was defined as haemoglobin A1c ≥ 6.5%, fasting plasma glucose ≥ 126 mg/dL, medical history of diabetes or medication usage. Hypertension was defined as SBP ≥ 140 mmHg, DBP ≥ 90 mmHg, medical history of hypertension or medication usage. 11 Dyslipidaemia was defined as high‐density lipoprotein < 40 mg/dL, total cholesterol ≥ 240 mg/dL, triglycerides ≥ 200 mg/dL, medical history of dyslipidaemia or medication usage. 12 Kidney disease was defined as eGFR < 60 mL/min/1.73 m2 or a medical history of kidney disease. Previous histories of cerebrovascular diseases (cerebrovascular accident [CVA]) and myocardial infarction (MI) were identified via a questionnaire.
Statistical analysis
Descriptive statistics were reported to present the baseline characteristics of the participants. Continuous variables (i.e., age, vital signs and chemistry panels) were examined using the means and standard deviations. Binary and categorical variables (i.e., sex, ternary PA and ST, disease history and drug usage history) were reported using absolute counts and proportions. The differences across the ternary PA and ST groups were examined using analysis of variance (ANOVA) and chi‐squared tests. Multiple linear regression tests were used to measure the coefficient values of baseline eGFR and annual decline of eGFR. Cox proportional hazards models were constructed for multivariate analysis of factors predicting the occurrence of CKD over the follow‐up period, controlling for demographics (e.g., age and sex), lifestyle profiles (e.g., alcohol consumption and tobacco use), occupational groups, nutrition examination survey (e.g., energy, sodium and potassium) and comorbidities (e.g., diabetes, hypertension and dyslipidaemia). We also adjusted for the models using ternary PA and ST. These two models estimated the univariate and multivariate‐adjusted hazard ratios (HRs) and their 95% confidence intervals (CIs). All statistical analyses were performed using R software Version 4.0.3 (R Foundation for Statistical Computing, Vienna, Austria).
Results
The higher physical activity and lower sedentary time were associated with the lower baseline estimated glomerular filtration rate
Table 1 shows the baseline clinical and biochemical characteristics of the participants according to their PA and ST levels. The mean age of the participants was 51.99 ± 8.81. Approximately 37.7% of them had hypertension, and 11.4% were diagnosed with diabetes. The high‐PA group was older, was more hypertensive, had higher BP and included more men compared with the low‐ and moderate‐PA groups. The low‐ST group was older, was more hypertensive, had higher BP and included lesser men than the moderate‐ and high‐ST groups. The KoGES counted the total PA hours, including working hours. Therefore, we divided four groups according to the amount of occupational PA and characteristics (Table 2 ). The participants in G1 identified a higher PA (37.19 MET‐h/day) and lower ST (3.49 h/day) amount, were more hypertensive (45.3%) and male dominant (56.6%). Table 3 presents baseline eGFR across the PA and ST groups. Baseline eGFR was higher as the amount of PA increased, whereas it decreased as the amount of ST increased.
Table 1.
Baseline characteristics of the subgroups according to the physical activity and sedentary time
| Total (n = 7988) | High‐PA (n = 2807) | Moderate‐PA (n = 2578) | Low‐PA (n = 2603) | P‐value | |
|---|---|---|---|---|---|
| PA (MET‐h/day) | 21.989 ± 19.598 | 45.684 ± 12.909 | 14.032 ± 3.526 | 4.317 ± 2.472 | <0.001 |
| ST (h/day) | 4.535 ± 2.603 | 3.443 ± 2.322 | 4.830 ± 2.514 | 5.421 ± 2.561 | <0.001 |
| Age (years) | 51.989 ± 8.805 | 54.845 ± 8.585 | 50.456 ± 8.478 | 50.426 ± 8.589 | <0.001 |
| Male (n,%) | 3827 (47.9%) | 1436 (51.2%) | 1153 (44.7%) | 1238 (47.6%) | <0.001 |
| Education (n, %) | <0.001 | ||||
| < High school | 4455 (55.8%) | 2107 (75.1%) | 1171 (45.4%) | 1177 (45.2%) | |
| ≥ High school | 3533 (44.2%) | 700 (24.9%) | 1407 (54.6%) | 1426 (54.8%) | |
| Smoking status (n, %) | <0.001 | ||||
| Never | 4714 (59.0%) | 1592 (56.7%) | 1611 (62.5%) | 1511 (58.0%) | |
| Former/current | 3274 (41.0%) | 1215 (43.3%) | 967 (37.5%) | 1092 (42.0%) | |
| Alcohol consumption (n, %) | 0.92 | ||||
| Never | 3667 (45.9%) | 1296 (46.2%) | 1176 (45.6%) | 1195 (45.9%) | |
| Former/current | 4321 (54.1%) | 1511 (53.8%) | 1402 (54.4%) | 1408 (54.1%) | |
| Occupational groups | <0.001 | ||||
| G1 | 2646 (33.1%) | 1886 (66.5%) | 464 (18.0%) | 316 (12.1%) | |
| G2 | 1970 (24.7%) | 298 (10.6%) | 768 (29.8%) | 904 (34.7%) | |
| G3 | 2229 (27.9%) | 415 (14.8%) | 924 (35.8%) | 890 (34.2%) | |
| G4 | 1143 (14.3%) | 228 (8.1%) | 422 (16.4%) | 493 (18.9%) | |
| Calorie intake per day (kcal/day) | 1964.371 ± 716.184 | 2023.974 ± 851.148 | 1947.171 ± 634.809 | 1917.130 ± 622.669 | <0.001 |
| Sodium intake per day (mg/day) | 3205.585 ± 1649.737 | 3395.006 ± 1892.117 | 3142.550 ± 1451.797 | 3063.747 ± 1530.751 | <0.001 |
| Potassium intake per day | 2554.713 ± 1227.988 | 2592.638 ± 1412.928 | 2569.972 ± 1088.938 | 2498.705 ± 1138.666 | 0.014 |
| Hypertension (n, %) | 3011 (37.7%) | 1231 (43.9%) | 849 (32.9%) | 931 (35.8%) | <0.001 |
| Diabetes (n, %) | 912 (11.4%) | 327 (11.6%) | 263 (10.2%) | 322 (12.4%) | 0.044 |
| Myocardial infarction (n, %) | 60 (0.8%) | 25 (0.9%) | 19 (0.7%) | 16 (0.6%) | 0.499 |
| Cerebrovascular accident (n, %) | 77 (1.0%) | 22 (0.8%) | 24 (0.9%) | 31 (1.2%) | 0.303 |
| SBP (mmHg) | 124.109 ± 18.468 | 127.618 ± 18.741 | 121.743 ± 17.923 | 122.667 ± 18.142 | <0.001 |
| DBP (mmHg) | 81.581 ± 11.646 | 83.371 ± 11.402 | 80.244 ± 11.528 | 80.976 ± 11.787 | <0.001 |
| BMI (kg/m2) | 24.592 ± 3.125 | 24.263 ± 3.153 | 24.742 ± 3.065 | 24.799 ± 3.125 | <0.001 |
| Creatinine (mg/dL) | 0.833 ± 0.167 | 0.813 ± 0.151 | 0.841 ± 0.173 | 0.846 ± 0.175 | <0.001 |
| eGFR (mL/min/1.73 m2) | 92.937 ± 13.141 | 93.151 ± 12.406 | 92.829 ± 13.531 | 92.815 ± 13.516 | 0.565 |
| Total (n = 7988) | Low‐ST (n = 2981) | Moderate‐ST (n = 2991) | High‐ST (n = 2016) | P‐value | |
|---|---|---|---|---|---|
| PA (MET‐h/day) | 21.989 ± 19.598 | 29.264 ± 20.812 | 20.169 ± 18.690 | 13.931 ± 14.673 | <0.001 |
| ST (h/day) | 4.535 ± 2.603 | 1.826 ± 0.898 | 4.963 ± 0.906 | 7.907 ± 1.391 | <0.001 |
| Age (years) | 51.989 ± 8.805 | 53.578 ± 8.830 | 51.450 ± 8.775 | 50.438 ± 8.437 | <0.001 |
| Male (n,%) | 3827 (47.9%) | 1243 (41.7%) | 1464 48.9% | 1120 (55.6%) | <0.001 |
| Education (n, %) | <0.001 | ||||
| < High school | 4455 (55.8%) | 2067 (69.3%) | 1530 (51.2%) | 858 (42.6%) | |
| ≥ High school | 3533 (44.2%) | 914 (30.7%) | 1461 (48.8%) | 1158 (57.4%) | |
| Smoking status (n, %) | <0.001 | ||||
| Never | 4714 (59.0%) | 1919 (64.4%) | 1763 (58.9%) | 1032 (51.2%) | |
| Former/current | 3274 (41.0%) | 1062 (35.6%) | 1228 (41.1%) | 984 (48.8%) | |
| Alcohol consumption (n, %) | <0.001 | ||||
| Never | 3667 (45.9%) | 1524 (51.1%) | 1370 (45.8%) | 773 (38.3%) | |
| Former/current | 4321 (54.1%) | 1457 (48.9%) | 1621 (54.2%) | 1243 (61.7%) | |
| Occupational groups | <0.001 | ||||
| G1 | 2646 (33.1%) | 1474 (49.4%) | 840 (28.1%) | 332 (16.5%) | |
| G2 | 1970 (24.7%) | 410 (13.8%) | 839 (28.1%) | 721 (35.8%) | |
| G3 | 2229 (27.9%) | 771 (25.9%) | 881 (29.5%) | 577 (28.6%) | |
| G4 | 1143 (14.3%) | 326 (10.9%) | 431 (14.4%) | 386 (19.1%) | |
| Calorie intake per day (kcal/day) | 1964.371 ± 716.184 | 1975.609 ± 809.493 | 1961.506 ± 673.855 | 1952.004 ± 624.379 | 0.501 |
| Sodium intake per day (mg/day) | 3205.585 ± 1649.737 | 3242.307 ± 1829.026 | 3164.111 ± 1538.508 | 3212.817 ± 1524.322 | 0.182 |
| Potassium intake per day | 2554.713 ± 1227.988 | 2566.535 ± 1369.168 | 2543.200 ± 1166.560 | 2554.314 ± 1088.598 | 0.764 |
| Hypertension (n, %) | 3011 (37.7%) | 1189 (39.9%) | 1123 (37.5%) | 699 (34.7%) | <0.001 |
| Diabetes (n, %) | 912 (11.4%) | 337 (11.3%) | 330 (11.0%) | 245 (12.2%) | 0.46 |
| Myocardial infarction (n, %) | 60 (0.8%) | 18 (0.6%) | 19 (0.6%) | 23 (1.1%) | 0.063 |
| Cerebrovascular accident (n, %) | 77 (1.0%) | 20 (0.7%) | 25 (0.8%) | 32 (1.6%) | 0.003 |
| SBP (mmHg) | 124.109 ± 18.468 | 125.772 ± 18.919 | 123.525 ± 18.522 | 122.516 ± 17.505 | <0.001 |
| DBP (mmHg) | 81.581 ± 11.646 | 82.011 ± 11.765 | 81.579 ± 11.556 | 80.947 ± 11.580 | 0.007 |
| BMI (kg/m2) | 24.592 ± 3.125 | 24.410 ± 3.167 | 24.653 ± 3.119 | 24.771 ± 3.059 | <0.001 |
| Creatinine (mg/dL) | 0.833 ± 0.167 | 0.795 ± 0.146 | 0.841 ± 0.167 | 0.877 ± 0.183 | <0.001 |
| eGFR (mL/min/1.73 m2) | 92.937 ± 13.141 | 94.286 ± 12.279 | 92.699 ± 13.385 | 91.298 ± 13.790 | <0.001 |
Note: Data are expressed as the mean ± standard deviation or number of patients (percentage). G1 (Group 1) with high‐PA includes agriculture and factory workers. G2 (Group 2) with low‐PA includes office jobs, self‐employment, sales and specialized job. G3 (Group 3) is composed of housewives. G4 (Group 4) includes other unclassified job. Abbreviations: BMI, body mass index; DBP, diastolic blood pressure; eGFR, estimated glomerular filtration rate by Chronic Kidney Disease Epidemiology Collaboration equation; PA, physical activity; SBP, systolic blood pressure; ST, sedentary time.
Table 2.
Baseline characteristics according to occupational physical activity group
| G1 (n = 2646) | G2 (n = 1970) | G3 (n = 2229) | G4 (n = 1143) | Total (n = 7988) | P‐value | |
|---|---|---|---|---|---|---|
| PA (MET‐h/day) | 37.192 ± 20.051 | 13.206 ± 13.095 | 15.496 ± 14.992 | 14.596 ± 14.672 | 21.989 ± 19.598 | <0.001 |
| ST (h/day) | 3.489 ± 2.391 | 5.481 ± 2.361 | 4.611 ± 2.538 | 5.180 ± 2.728 | 4.53 ± 2.603 | <0.001 |
| PA group | <0.001 | |||||
| High (≥24) | 1866 (70.5%) | 298 (15.1%) | 415 (18.6%) | 228 (19.9%) | 2807 (35.1%) | |
| Moderate (9–24) | 464 (17.5%) | 768 (39.0%) | 924 (41.5%) | 422 (36.9%) | 2578 (32.3%) | |
| Low (<9) | 316 (11.9%) | 904 (45.9%) | 890 (39.9%) | 493 (43.1%) | 2603 (32.6%) | |
| ST group | <0.001 | |||||
| Low (<3) | 1474 (55.7%) | 410 (20.8%) | 771 (34.6%) | 326 (28.5%) | 2981 (37.3%) | |
| Moderate (3–6) | 840 (31.7%) | 839 (42.6%) | 881 (39.5%) | 431 (37.7%) | 2991 (37.4%) | |
| High (≥6) | 332 (12.5%) | 721 (36.6%) | 577 (25.9%) | 386 (33.8%) | 2016 (25.2%) | |
| Age (years) | 55.515 ± 8.780 | 47.003 ± 6.013 | 51.960 ± 8.796 | 52.473 ± 8.860 | 51.989 ± 8.805 | <0.001 |
| Male (n, %) | 1498 (56.6%) | 1492 (75.7%) | 5 (0.2%) | 832 (72.8%) | 3827 (47.9%) | <0.001 |
| Hypertension (n, %) | 1198 (45.3%) | 619 (31.4%) | 763 (34.2%) | 431 (37.7%) | 3011 (37.7%) | <0.001 |
| SBP | 128.130 ± 18.248 | 120.391 ± 16.727 | 122.818 ± 19.411 | 123.724 ± 18.219 | 124.109 ± 18.468 | <0.001 |
| DBP | 83.457 ± 11.121 | 81.185 ± 11.650 | 79.624 ± 11.891 | 81.738 ± 11.680 | 81.581 ± 11.646 | <0.001 |
Note: G1 (Group 1) with high‐PA includes agriculture and factory workers. G2 (Group 2) with low‐PA includes office jobs, self‐employment, sales and specialized job. G3 (Group 3) is composed of housewives. G4 (Group 4) includes other unclassified job. Abbreviations: DBP, diastolic blood pressure; PA, physical activity; SBP, systolic blood pressure; ST, sedentary time.
Table 3.
Baseline estimated glomerular filtration rate according to physical activity and sedentary time
| Model 1 | P‐value | Model 2 | P‐value | Model 3 | P‐value | |
|---|---|---|---|---|---|---|
| PA | ||||||
| High | 0.00 | 0.00 | 0.00 | |||
| Moderate | −2.37 (−2.96, −1.77) | <0.001 | −1.36 (−2.01, −0.71) | <0.001 | −1.34 (−1.99, −0.96) | <0.001 |
| Low | −2.83 (−3.43, −2.24) | <0.001 | −1.65 (−2.31, −0.98) | <0.001 | −1.63 (−2.29, −0.96) | <0.001 |
| ST | ||||||
| Low | 0.00 | 0.00 | 0.00 | |||
| Moderate | −1.51 (−2.07, −0.95) | <0.001 | −0.93 (−1.50, −0.37) | 0.001 | −0.88 (−1.44, −0.32) | <0.001 |
| High | −2.58 (−3.22, −1.95) | <0.001 | −1.72 (−2.37, −1.07) | <0.001 | −1.65 (−2.30, −1.00) | <0.001 |
Note: Model 1 was adjusted for age and sex; Model 2 was adjusted for Model 1 + smoking, alcohol, nutrition (sodium, potassium and calories), body mass index and occupational groups; Model 3 was adjusted for Model 2 + hypertension, dyslipidaemia, diabetes, C‐reactive protein, myocardial infarction and cerebrovascular accident. Abbreviations: PA, physical activity; ST, sedentary time.
Chronic kidney disease occurred more in the low‐physical activity group than in moderate‐to‐high‐physical activity groups
Overall, the mean annual eGFR was reduced by 2.03 mL/min/1.73 m2/year. It was higher as the PA amount decreased, whereas it decreased as ST decreased. Compared with the high‐PA group, eGFR tended to decrease gradually in the moderate‐ and low‐PA groups by 0.12 (−0.26, 0.01, P = 0.081) and 0.13 (−0.27, 0.01, P = 0.078) per year, respectively (Table 4 ). Relative to the low‐ST group, eGFR reduced in the moderate‐ and high‐ST groups further by 0.07 (−0.19, 0.05, P = 0.236) and 0.14 (−0.28, −0.01, P = 0.039) per year, respectively. Overall, the incidence of CKD was 23.6% in the study population. The HR was significantly increased in the low‐ (1.13: 1.00–1.28, P = 0.056) and moderate‐PA groups (1.25: 1.11–1.42, P < 0.001) than in the high‐PA group (1.00) (Table 5 ). Similarly, the HR for CKD incidence increased in the high‐ST group (1.19: 1.05–1.34, P = 0.007) and slightly increased in the moderate‐ST group (1.04: 0.94–1.16, P = 0.440) than in the low‐ST group (1.00).
Table 4.
Annual estimated glomerular filtration rate decline according to physical activity and sedentary time
| Model 1 | P‐value | Model 2 | P‐value | Model 3 | P‐value | |
|---|---|---|---|---|---|---|
| PA | ||||||
| High | 0.00 | 0.00 | 0.00 | |||
| Moderate | −0.18 (−0.31, −0.06) | 0.004 | −0.12 (−0.26, −0.01) | 0.075 | −0.12 (−0.26, −0.01) | 0.081 |
| Low | −0.22 (−0.34, −0.09) | <0.001 | −0.14 (−0.28, −0.00) | 0.046 | −0.13 (−0.27, −0.01) | 0.078 |
| ST | ||||||
| Low | 0.00 | 0.00 | 0.00 | |||
| Moderate | −0.10 (−0.22, 0.01) | 0.081 | −0.07 (−0.19, 0.05) | 0.235 | −0.07 (−0.19, 0.05) | 0.236 |
| High | −0.22 (−0.35, −0.09) | 0.001 | −0.16 (−0.29, −0.02) | 0.026 | −0.14 (−0.28, −0.01) | 0.039 |
Note: Model 1 was adjusted for age and sex; Model 2 was adjusted for Model 1 + smoking, alcohol, nutrition (sodium, potassium and calories), body mass index and occupational groups; Model 3 was adjusted for Model 2 + hypertension, dyslipidaemia, diabetes, C‐reactive protein, myocardial infarction and cerebrovascular accident. Abbreviations: PA, physical activity; ST, sedentary time.
Table 5.
Incident chronic kidney disease occurrence according to physical activity and sedentary time
| Model 1 | P‐value | Model 2 | P‐value | Model 3 | P‐value | |
|---|---|---|---|---|---|---|
| PA | ||||||
| High | 1.00 | 1.00 | 1.00 | |||
| Moderate | 1.21 (1.08, 1.35) | <0.001 | 1.12 (0.99, 1.27) | 0.076 | 1.13 (1.00, 1.28) | 0.056 |
| Low | 1.40 (1.26, 1.55) | <0.001 | 1.28 (1.13, 1.45) | <0.001 | 1.25 (1.11, 1.42) | <0.001 |
| ST | ||||||
| Low | 1.00 | 1.00 | 1.00 | |||
| Moderate | 1.10 (1.00, 1.22) | 0.051 | 1.04 (0.94, 1.16) | 0.441 | 1.04 (0.94, 1.16) | 0.440 |
| High | 1.31 (1.17, 1.46) | <0.001 | 1.21 (1.07, 1.37) | 0.002 | 1.19 (1.05, 1.34) | 0.007 |
Note: Model 1 was adjusted for age and sex; Model 2 was adjusted for Model 1 + smoking, alcohol, nutrition (sodium, potassium and calories), body mass index and occupational groups; Model 3 was adjusted for Model 2 + hypertension, dyslipidaemia, diabetes, C‐reactive protein, myocardial infarction and cerebrovascular accident. Abbreviations: PA, physical activity; ST, sedentary time.
High physical activity attenuates the adverse effect of higher sedentary time‐associated chronic kidney disease occurrence
We wondered if augmented PA could recover the detrimental effect of longer ST on renal function and CKD incidence. The number of participants was as follows: high‐PA and low‐ST, n = 1564; high‐PA and moderate‐ST, n = 915; high‐PA and high‐ST, n = 328; moderate‐PA and low‐ST, n = 802; moderate‐PA and moderate‐ST, n = 1060; moderate‐PA and high‐ST, n = 716; low‐PA and low‐ST, n = 615; low‐PA and moderate‐ST, n = 1016; and low‐PA and high‐ST, n = 972. Relative to the reference group (high‐PA and low‐ST), CKD occurrence significantly increased in the low‐PA group (HR: low‐ST 1.28 [1.06–1.55, P = 0.009], moderate‐ST 1.14 [0.96–1.36, P = 0.138] and high‐ST 1.47 [1.22–1.76, P < 0.001]) (Figure 2 ).
Figure 2.
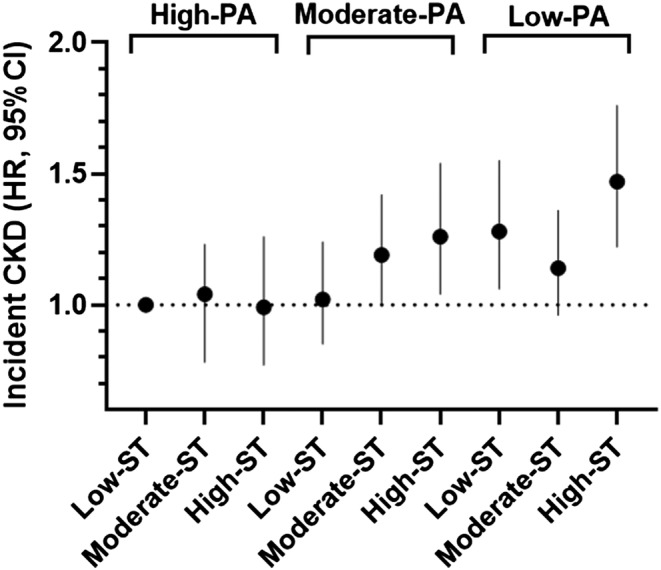
The hazard ratio (HR) of incident chronic kidney disease (CKD) in the sedentary time (ST) groups stratified by physical activity (PA) ternary. The reference category was the group with high‐PA (>24 MET‐h/day) in combination with low‐ST (<3 h/day). CI, confidence interval
Discussion
In this study, higher PA and lower ST were linked to a reduced risk of renal function deterioration. In a cross‐sectional study, low‐PA or high‐ST was associated with CKD and low eGFR. 4 , 13 , 14 However, longitudinal studies have reported inconsistent results. PA contributed to mitigating eGFR decline and prevented CKD occurrence in various groups of participants. 3 , 15 , 16 , 17 Longer duration of sedentary behaviour was associated with lower eGFR and higher incidence of developing CKD in the Japanese population. 15 In addition, spending a longer time watching television was related to a higher CKD occurrence in the UK population. 18 On the other hand, several studies have shown no significant association between high‐PA or low‐ST, and renal outcomes. 19 , 20 , 21 The inconsistent conclusions from previous studies might be in part due to the different methods used to measure PA or ST. Almost all of the previous studies collected information from self‐reported questionnaires, except for two studies that quantified the amount of PA using an accelerometer. 14 , 18 Our study calculated the amount of PA by summing not only leisure PA but also occupational PA. Therefore, the values of MET‐hours per day in this study are definitely higher than those in other studies that included either leisure or habitual PA only. 3 , 16 The average amount of PA in our study is similar to one report using the same method as ours. 22 PA guidelines recommend the regular exercise of 8.3 MET‐h/week. This PA criterion is significantly lower than the PA categories used in this study. The discrepancy might be due to additional hours counted from occupational PA to the PA amount in this study. Caution is needed to interpret our data. Occupational PA was considered not to have beneficial effects on cardiovascular diseases and mortality, rather suggesting a reduction in life expectancies. 23 , 24 Excessive PA due to severe labour can be harmful to keeping healthy. In addition, some physically active tasks increase the mortality rate due to accidents during work time. However, several studies in a meta‐analysis demonstrated that occupational PA had no or less association with mortality. 25 Behavioural and socioeconomic factors should be considered in order to reach a clear conclusion. A recent study showed that occupational PA contributed to increased longevity in men after adjusting for behavioural and socioeconomic confounding factors. 26 In addition, the total amount of PA, regardless of occupational status, was associated with reduced mortality in middle‐aged and older participants. 27 The total PA amount, including occupational PA, and low‐ST were related to a reduced risk of end‐stage renal disease in CKD patients. 22
In our study, three groups of PA/ST demonstrated different characteristics in the sociodemographic and clinical features. When we classified our participants by the occupational PA amount, G1 showed a higher PA amount (37.19 MET‐h/day) than others (G2: 13.21, G3: 15.50, G4: 14.60 MET‐h/day, P < 0.001), was older (55.51) than others (G2: 47.00, G3: 51.96, G4: 52.47, P < 0.001) and tended to be more hypertensive (45.3%) than others (G2: 31.4%, G3: 34.2%, G4: 37.7%, P < 0.001) (Table 2 ). G1 also revealed a lower ST amount (3.49 h/day) than others (G2: 5.48, G3: 4.61, G4: 5.18 h/day, P < 0.001) and sexual unbalance (male %: G1: 56.6, G2: 75.7, G3: 0.2, G4: 72.8, P < 0.001). The PA amount was highest in G1, followed by G3, G4 and G2. The participants included in the high‐PA group are thought to reflect G1 characteristics (more men, higher BP and older), whereas those in the low‐ST group are likely composed of the mixed populations of G1 and G3 (Table 1 ). G3 participants are mostly women (99.8%), and thus, the low‐ST group may have more women.
People spend more than half of their awake time in sedentary activities in modern society. 6 Sedentary behaviours were independently associated with reduced eGFR, and this association was magnified in individuals with advanced age, cardiovascular disease and diabetes. 14 Longer ST is linked to obesity, and the accumulated adipose tissue induces oxidative stress and inflammation; in contrast, PA contributes to mitigating them. 28 Prolonged ST decreases vascular dilatational function, which is improved by walking exercise. 29 Specific STs, such as television‐viewing ST, have a stronger association with CKD occurrence or mortality. 18 , 30 People usually watch television in the evening, which prolongs postprandial ST and has detrimental effects on lipid and glucose metabolism. Unfortunately, this cohort did not collect detailed information on sedentary behaviour. For better clarification, ST for driving or working and ST for watching television should be analysed differently.
We found that CKD risk was not increased in the high‐PA group (>24 MET‐h/day) irrespective of the amount of ST, whereas those spending ST > 3 h/day in the moderate‐PA group (9–24 MET‐h/day) and all in the low‐PA group (<9 MET‐h/day) had a significantly higher incidence of CKD occurrence. In contrast, reduced ST was not effective in preventing CKD incidence (data not shown). The World Health Organization recommends at least 150 min of moderate‐intensity exercise or 75 min of vigorous‐intensity exercise a week to stay healthy. 31 Exercise interventions have the benefit of increasing eGFR and decreasing BP in obese non‐renal participants or non‐dialysis CKD patients. 32 , 33 Behaviour intervention to decrease ST and increase exercise duration was feasible to reduce body fat mass and BMI over a short period in CKD patients. 34 An experimental study suggested that PA stimulated muscle secretome and produced myokines, such as myostatin, insulin‐like growth factor‐1, tumour necrosis factor and interferon‐6, which are involved in the regeneration of the damaged kidney. 35 However, it is difficult for the participants to sustain their corrected behaviours. One study showed that approximately 60–75 min of moderate‐intensity activity per day was eliminated to increase mortality due to high sitting time. 30 It is not clear how much PA can help slow down renal deterioration and attenuate CKD development. In this study, PA over 24 MET‐h/day was associated with a decrease in CKD occurrence. In line with this, one study demonstrated that replacing 1 h of ST with 1 h of PA reduced the odds ratio for CKD occurrence by 3–4% in the Japanese population. 36
This study has several limitations related to the use of the self‐developed questionnaires for the PA measure. First, during 1999–2000, when the KoGES was being developed, there were no validated questionnaires related to PA, such as International Physical Activity Questionnaire. Therefore, the researchers who participated in the cohort development created questionnaires based on previous studies. During the similar time, several studies collected survey data about PA by using self‐developed questionnaires. 3 , 37 Although the self‐developed questionnaires have not been adequately assessed for validity and reliability in other studies, our study showed an inversely proportional correlation between PA and ST, and also a clear relationship between the amount of PA/ST and renal outcomes. Second, the PA and ST on weekdays and weekends might vary widely across individuals depending on their age and lifestyle. Unfortunately, our questionnaires do not measure PA/ST on weekdays and weekends separately. The PA/ST questionnaires measure only aggregate data of hour per day. This measure is at risk for recall bias, leading to less accurate data. However, a study found that the self‐reported ST was similar on weekdays and weekends in a sample of office‐based workers. 38 In addition, the previous studies found that the difference between weekdays and weekends in accelerometer‐measured ST and self‐reported PA appears to be insignificant among older adults. 39 Prior research collectively suggests that the PA/ST amount on weekends shows the similar patterns of those on weekdays in the adult population. Third, we may underestimate the total ST time for those who spent their time for ST over 5 h as we counted their ST as 6 h. Despite these limitations, this study has notable strengths to clarify how PA and ST affect renal outcomes in middle‐aged Korean subjects using a large‐scaled population for an extended duration.
In summary, low‐PA and high‐ST were observed to be associated with a higher eGFR decline and incident CKD in a Korean middle‐aged population without renal diseases. More than 24 MET‐h/day of PA affects the mitigation of high‐ST‐associated CKD occurrence. Maintaining the proper amount of PA per day is suggested to be a critical modifiable factor in maintaining kidney health.
Conflict of interest
The authors declare that the research was conducted in the absence of any commercial or financial relationships that could be construed as a potential conflict of interest.
Funding information
This research was supported by the National Research Foundation of Korea (NRF‐2020R1F1A1048586).
Supporting information
Table S1. The questionnaire used in the KoGES study.
Acknowledgements
The authors certify that they comply with the ethical guidelines for publishing in the Journal of Cachexia, Sarcopenia and Muscle. 40
Oh W., Cho M., Jung S. W., Moon J.‐Y., Lee S.‐H., Hwang Y.‐C., and Kim Y. G. (2023) High physical activity alleviates the adverse effect of higher sedentary time on the incidence of chronic kidney disease, Journal of Cachexia, Sarcopenia and Muscle, 14, 622–631, 10.1002/jcsm.13167
References
- 1. Hill NR, Fatoba ST, Oke JL, Hirst JA, O'Callaghan CA, Lasserson DS, et al. Global prevalence of chronic kidney disease—a systematic review and meta‐analysis. PLoS One 2016;11:e0158765. [DOI] [PMC free article] [PubMed] [Google Scholar]
- 2. Wang J, Zhang L, Tang SC, Kashihara N, Kim YS, Togtokh A, et al. Disease burden and challenges of chronic kidney disease in North and East Asia. Kidney Int 2018;94:22–25. [DOI] [PubMed] [Google Scholar]
- 3. Guo C, Tam T, Bo Y, Chang LY, Lao XQ, Thomas GN. Habitual physical activity, renal function and chronic kidney disease: a cohort study of nearly 200 000 adults. Br J Sports Med 2020;54:1225–1230. [DOI] [PubMed] [Google Scholar]
- 4. Hallan S, de Mutsert R, Carlsen S, Dekker FW, Aasarod K, Holmen J. Obesity, smoking, and physical inactivity as risk factors for CKD: are men more vulnerable? Am J Kidney Dis 2006;47:396–405. [DOI] [PubMed] [Google Scholar]
- 5. Stengel B, Tarver‐Carr ME, Powe NR, Eberhardt MS, Brancati FL. Lifestyle factors, obesity and the risk of chronic kidney disease. Epidemiology 2003;14:479–487. [DOI] [PubMed] [Google Scholar]
- 6. Matthews CE, Chen KY, Freedson PS, Buchowski MS, Beech BM, Pate RR, et al. Amount of time spent in sedentary behaviors in the United States, 2003–2004. Am J Epidemiol 2008;167:875–881. [DOI] [PMC free article] [PubMed] [Google Scholar]
- 7. Biswas A, Oh PI, Faulkner GE, Bajaj RR, Silver MA, Mitchell MS, et al. Sedentary time and its association with risk for disease incidence, mortality, and hospitalization in adults: a systematic review and meta‐analysis. Ann Intern Med 2015;162:123–132. [DOI] [PubMed] [Google Scholar]
- 8. Kim Y, Han BG, KoGES Group . Cohort profile: the Korean Genome and Epidemiology Study (KoGES). Consortium Int J Epidemiol 2017;46:1350. [DOI] [PMC free article] [PubMed] [Google Scholar]
- 9. Ahn Y, Kwon E, Shim JE, Park MK, Joo Y, Kimm K, et al. Validation and reproducibility of food frequency questionnaire for Korean genome epidemiologic study. Eur J Clin Nutr 2007;61:1435–1441. [DOI] [PubMed] [Google Scholar]
- 10. Levey AS, Stevens LA, Schmid CH, Zhang YL, Castro AF 3rd, Feldman HI, et al. A new equation to estimate glomerular filtration rate. Ann Intern Med 2009;150:604–612. [DOI] [PMC free article] [PubMed] [Google Scholar]
- 11. Ibanez B, James S, Agewall S, Antunes MJ, Bucciarelli‐Ducci C, Bueno H, et al. 2017 ESC Guidelines for the management of acute myocardial infarction in patients presenting with ST‐segment elevation: the Task Force for the management of acute myocardial infarction in patients presenting with ST‐segment elevation of the European Society of Cardiology (ESC). Eur Heart J 2018;39:119–177. [DOI] [PubMed] [Google Scholar]
- 12. Expert Panel on Detection E , Treatment of High Blood Cholesterol in A . Executive summary of the third report of the National Cholesterol Education Program (NCEP) expert panel on detection, evaluation, and treatment of high blood cholesterol in adults (adult treatment panel III). JAMA 2001;285:2486–2497. [DOI] [PubMed] [Google Scholar]
- 13. Bharakhada N, Yates T, Davies MJ, Wilmot EG, Edwardson C, Henson J, et al. Association of sitting time and physical activity with CKD: a cross‐sectional study in family practices. Am J Kidney Dis 2012;60:583–590. [DOI] [PubMed] [Google Scholar]
- 14. Glavinovic T, Ferguson T, Komenda P, Rigatto C, Duhamel TA, Tangri N, et al. CKD and sedentary time: results from the Canadian Health Measures Survey. Am J Kidney Dis 2018;72:529–537. [DOI] [PubMed] [Google Scholar]
- 15. Michishita R, Matsuda T, Kawakami S, Tanaka S, Kiyonaga A, Tanaka H, et al. The association between changes in lifestyle behaviors and the incidence of chronic kidney disease (CKD) in middle‐aged and older men. J Epidemiol 2017;27:389–397. [DOI] [PMC free article] [PubMed] [Google Scholar]
- 16. Robinson‐Cohen C, Littman AJ, Duncan GE, Weiss NS, Sachs MC, Ruzinski J, et al. Physical activity and change in estimated GFR among persons with CKD. J Am Soc Nephrol 2014;25:399–406. [DOI] [PMC free article] [PubMed] [Google Scholar]
- 17. Robinson‐Cohen C, Katz R, Mozaffarian D, Dalrymple LS, de Boer I, Sarnak M, et al. Physical activity and rapid decline in kidney function among older adults. Arch Intern Med 2009;169:2116–2123. [DOI] [PMC free article] [PubMed] [Google Scholar]
- 18. Park S, Lee S, Kim Y, Lee Y, Kang MW, Kim K, et al. Causal effects of physical activity or sedentary behaviors on kidney function: an integrated population‐scale observational analysis and Mendelian randomization study. Nephrol Dial Transplant 2021;37:1059–1068. [DOI] [PubMed] [Google Scholar]
- 19. Hannan M, Ricardo AC, Cai J, Franceschini N, Kaplan R, Marquez DX, et al. Sedentary behavior and change in kidney function: the Hispanic Community Health Study/Study of Latinos (HCHS/SOL). Kidney360 2021;2:245–253. [DOI] [PMC free article] [PubMed] [Google Scholar]
- 20. Herber‐Gast GC, Hulsegge G, Hartman L, Verschuren WM, Stehouwer CD, Gansevoort RT, et al. Physical activity is not associated with estimated glomerular filtration rate among young and middle‐aged adults: results from the population‐based longitudinal Doetinchem study. PLoS One. 2015;10:e0133864. [DOI] [PMC free article] [PubMed] [Google Scholar]
- 21. White SL, Dunstan DW, Polkinghorne KR, Atkins RC, Cass A, Chadban SJ. Physical inactivity and chronic kidney disease in Australian adults: the AusDiab study. Nutr Metab Cardiovasc Dis 2011;21:104–112. [DOI] [PubMed] [Google Scholar]
- 22. Pike M, Taylor J, Kabagambe E, Stewart TG, Robinson‐Cohen C, Morse J, et al. The association of exercise and sedentary behaviours with incident end‐stage renal disease: the Southern Community Cohort Study. BMJ Open 2019;9:e030661. [DOI] [PMC free article] [PubMed] [Google Scholar]
- 23. Prince SA, Rasmussen CL, Biswas A, Holtermann A, Aulakh T, Merucci K, et al. The effect of leisure time physical activity and sedentary behaviour on the health of workers with different occupational physical activity demands: a systematic review. Int J Behav Nutr Phys Act 2021;18:100. [DOI] [PMC free article] [PubMed] [Google Scholar]
- 24. Ekelund U, Dalene KE, Tarp J, Lee IM. Physical activity and mortality: what is the dose response and how big is the effect? Br J Sports Med 2020;54:1125–1126. [DOI] [PubMed] [Google Scholar]
- 25. Coenen P, Huysmans MA, Holtermann A, Krause N, van Mechelen W, Straker LM, et al. Do highly physically active workers die early? A systematic review with meta‐analysis of data from 193 696 participants. Br J Sports Med 2018;52:1320–1326. [DOI] [PubMed] [Google Scholar]
- 26. Dalene KE, Tarp J, Selmer RM, Ariansen IKH, Nystad W, Coenen P, et al. Occupational physical activity and longevity in working men and women in Norway: a prospective cohort study. Lancet Public Health 2021;6:e386–e395. [DOI] [PubMed] [Google Scholar]
- 27. Cillekens B, Lang M, van Mechelen W, Verhagen E, Huysmans MA, Holtermann A, et al. How does occupational physical activity influence health? An umbrella review of 23 health outcomes across 158 observational studies. Br J Sports Med 2020;54:1474–1481. [DOI] [PubMed] [Google Scholar]
- 28. Vlassara H, Torreggiani M, Post JB, Zheng F, Uribarri J, Striker GE. Role of oxidants/inflammation in declining renal function in chronic kidney disease and normal aging. Kidney Int Suppl 2009;S3–S11. [DOI] [PubMed] [Google Scholar]
- 29. Restaino RM, Holwerda SW, Credeur DP, Fadel PJ, Padilla J. Impact of prolonged sitting on lower and upper limb micro‐ and macrovascular dilator function. Exp Physiol 2015;100:829–838. [DOI] [PMC free article] [PubMed] [Google Scholar]
- 30. Ekelund U, Steene‐Johannessen J, Brown WJ, Fagerland MW, Owen N, Powell KE, et al. Does physical activity attenuate, or even eliminate, the detrimental association of sitting time with mortality? A harmonised meta‐analysis of data from more than 1 million men and women. Lancet 2016;388:1302–1310. [DOI] [PubMed] [Google Scholar]
- 31. Hallal PC, Andersen LB, Bull FC, Guthold R, Haskell W, Ekelund U, et al. Global physical activity levels: surveillance progress, pitfalls, and prospects. Lancet 2012;380:247–257. [DOI] [PubMed] [Google Scholar]
- 32. Tyson CC, Smith PJ, Sherwood A, Mabe S, Hinderliter AL, Blumenthal JA. Influence of kidney function on blood pressure response to lifestyle modifications: secondary analysis from the Exercise and Nutritional Interventions for Cardiovascular Health (ENCORE) trial. J Clin Hypertens (Greenwich) 2016;18:1260–1267. [DOI] [PMC free article] [PubMed] [Google Scholar]
- 33. Zhang L, Wang Y, Xiong L, Luo Y, Huang Z, Yi B. Exercise therapy improves eGFR, and reduces blood pressure and BMI in non‐dialysis CKD patients: evidence from a meta‐analysis. BMC Nephrol 2019;20:398. [DOI] [PMC free article] [PubMed] [Google Scholar]
- 34. Lyden K, Boucher R, Wei G, Zhou N, Christensen J, Chertow GM, et al. Targeting sedentary behavior in CKD: a pilot and feasibility randomized controlled trial. Clin J Am Soc Nephrol 2021;16:717–726. [DOI] [PMC free article] [PubMed] [Google Scholar]
- 35. Zelle DM, Klaassen G, van Adrichem E, Bakker SJ, Corpeleijn E, Navis G. Physical inactivity: a risk factor and target for intervention in renal care. Nat Rev Nephrol 2017;13:318. [DOI] [PubMed] [Google Scholar]
- 36. Hara M, Nishida Y, Tanaka K, Shimanoe C, Koga K, Furukawa T, et al. Moderate‐to‐vigorous physical activity and sedentary behavior are independently associated with renal function: a cross‐sectional study. J Epidemiol 2021;JE20210155. 10.2188/jea.JE20210155 [DOI] [PMC free article] [PubMed] [Google Scholar]
- 37. Beddhu S, Baird BC, Zitterkoph J, Neilson J, Greene T. Physical activity and mortality in chronic kidney disease (NHANES III). Clin J Am Soc Nephrol 2009;4:1901–1906. [DOI] [PMC free article] [PubMed] [Google Scholar]
- 38. Smith L, Hamer M, Ucci M, Marmot A, Gardner B, Sawyer A, et al. Weekday and weekend patterns of objectively measured sitting, standing, and stepping in a sample of office‐based workers: the Active Buildings study. BMC Public Health 2015;15:9. [DOI] [PMC free article] [PubMed] [Google Scholar]
- 39. Marshall S, Kerr J, Carlson J, Cadmus‐Bertram L, Patterson R, Wasilenko K, et al. Patterns of weekday and weekend sedentary behavior among older adults. J Aging Phys Act 2015;23:534–541. [DOI] [PMC free article] [PubMed] [Google Scholar]
- 40. von Haehling S, Morley JE, Coats AJS, Anker SD. Ethical guidelines for publishing in the Journal of Cachexia, Sarcopenia and Muscle: update 2021. J Cachexia Sarcopenia Muscle 2021;12:2259–2261. [DOI] [PMC free article] [PubMed] [Google Scholar]
Associated Data
This section collects any data citations, data availability statements, or supplementary materials included in this article.
Supplementary Materials
Table S1. The questionnaire used in the KoGES study.