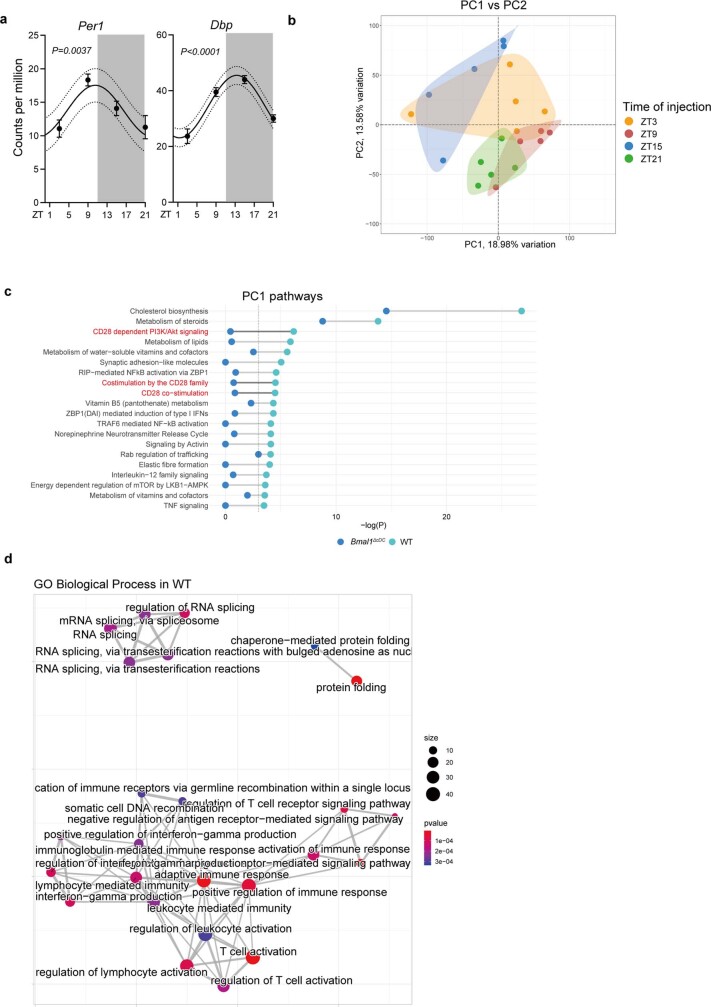
Extended Data Fig. 6. RNA-seq analyses of CD11+ MHCIIhi cells in the dLN.
(a-d) RNA-seq analyses of CD11c+ MHCIIhi cells in the dLN 24h after B16-F10-OVA cell engraftment in control mice (n = 5 mice) or Clec9acre:Bmal1flox mice (n = 3 mice), from 2 independent experiments. (a) Expression (Counts per million (CPM)) of Per1 and Dbp in CD11c+ MHCIIhi cells from control mice, Cosinor analysis. (b) Principal Component (PC) analyses of each sample from sequencing of CD11c+ MHCIIhi DCs in control mice. (c) Significantly enriched pathways from PC1 in control cells with CD28 signalling pathways highlighted in red, shown for control and Clec9acre:Bmal1flox CD11c+ MHCIIhi cells. The vertical dashed line represents the significant p values, hypergeometric test. (d) GO Biological Process interactions in the PC2 gene cluster for control cells. All data are represented as mean ± SEM.

