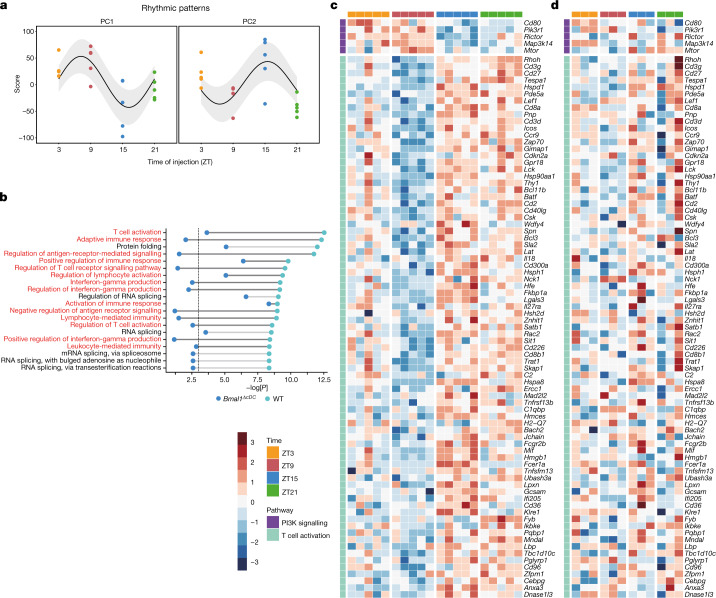
Fig. 3. DCs exhibit circadian gene expression patterns.
a–d, RNA-seq analysis of CD11c+MHCIIhigh cells in the dLN 24 h after engraftment of B16-F10-OVA cells at ZT3, ZT9, ZT15 or ZT21 in control mice (n = 5 mice) or Clec9a-cre:Bmal1flox mice (n = 3 mice). n = 2 independent experiments. a, Principal component (PC) analyses of the two main peaks in gene expression oscillation in control mice. n = 5 mice. Statistical analysis was performed using a cosinor analysis. b, Significantly enriched Gene Ontology pathways from PC2 in the control cells shown in a, with T cell activation pathways highlighted in red, shown for control and Clec9a-cre:Bmal1flox CD11c+MHCIIhigh cells. The vertical dashed line represents the significant P values, which were calculated using hypergeometric tests. c,d, Significantly expressed genes in the CD28-dependent PI3K–AKT signalling pathway (top) or T cell activation pathways (bottom) in control mice (c) and the lack of significance in Clec9a-cre:Bmal1flox mice (d).

