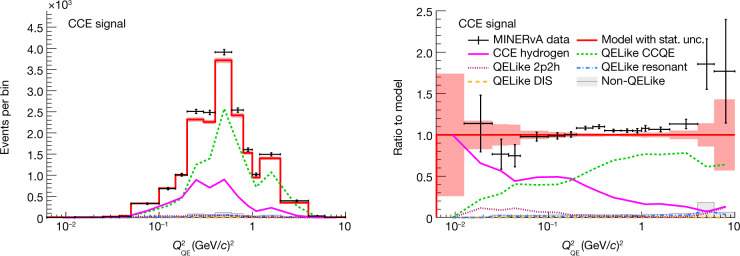
Fig. 2. Fitted event distribution and ratio in the signal region.
Event rate (left) and ratio to the post-fit model (right). The vertical error bars around the data points and the error band around the model prediction account for statistical uncertainty (stat. unc.) based on the standard deviation of a Poisson distribution. Note that the (0,0.0125) (GeV/c)2 and (6.0,10) (GeV/c)2 bins are not reported due to low statistics. DIS refers to deep inelastic scattering.

