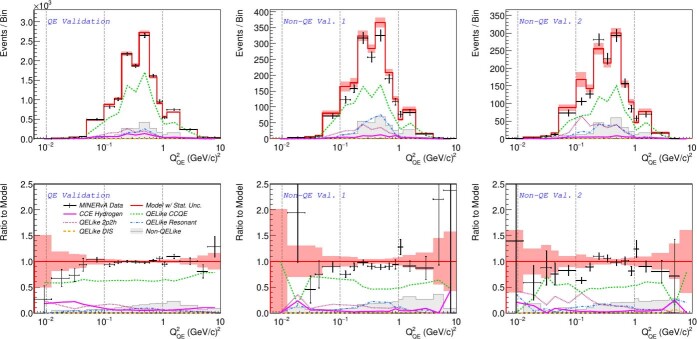
Extended Data Fig. 4. Post-fit event rates and ratios in the validation regions.
The “Non-QE validation” region is shown separated into two sub-regions. “Non-QE Val. 1” spans ∣δθP∣ < 20°, “Non-QE Val. 2” occupies 20° < ∣δθP∣ < 55°. The vertical error bars around the data points and the error band around the model prediction account for 1 standard deviation due to statistical uncertainty. The CCE signal and the regions used in the background fits are shown in Figs. 2 and 3, respectively.

