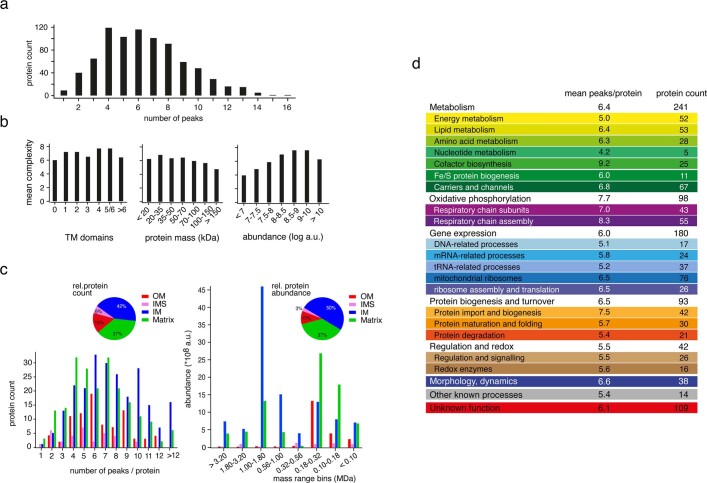
Extended Data Fig. 6. Complexity of mitochondrial protein assemblies.
a, Complexity (number of peaks per protein) of mitochondrial assemblies identified in the abundance–mass profiles of the 818 mitochondrial proteins accessible to automated Gaussian fitting. The mean value of the complexity was 6.4 peaks/assemblies per protein (SEM: 0.1, n = 818 mitochondrial proteins). b, Mean complexity determined for proteins with the indicated number of predicted transmembrane domains (TM, left), protein mass (middle) and overall abundance in mitochondria (right). c, Complexity and size related to submitochondrial localization. Bar graphs summarizing the complexity (left panel, number of peaks per protein) or the apparent molecular size (right panel, mass range bins) of assemblies/complexes identified in the abundance–mass profiles of proteins located in the outer and inner membranes (OM, IM), the intermembrane space (IMS) or the matrix of mitochondria. The plots represent results of 562 proteins for which subcompartmental localization was extracted from SGD GO terms. Relative numbers (left) and abundances (right) of the proteins in the subcompartments are indicated by pie charts. The apparent mass range was binned into equal log-value intervals (bins of 0.25) of the apparent molecular mass. The highest number of peaks (complexity) was observed for inner membrane proteins. The molecular mass ranges of protein assemblies strongly differ between the mitochondrial subcompartments. Inner membrane complexes are present in high abundance in the mass range of ~500–1,800 kDa, consistent with the presence of oxidative phosphorylation supercomplexes and further large membrane protein complexes8,74, whereas outer membrane complexes, including protein translocases and metabolite channels, and many matrix complexes display the highest abundance between 100–320 kDa. d, Complexity related to functional categories. Mean complexity of different functional categories and subcategories of mitochondrial proteins. Protein count, number of proteins representing these categories in the complexome determined in this work. Regarding the molecular mass distribution of protein assemblies, the two most abundant functional categories, oxidative phosphorylation and metabolism, display major differences (Fig. 2). Proteins involved in oxidative phosphorylation show the highest abundance in a molecular mass range of ~500–1,800 kDa. A fraction of proteins operating in metabolic processes migrate in the high molecular mass range >1,800 kDa, the majority of metabolism-linked proteins, however, migrate below 320 kDa. The category protein biogenesis and turnover shows the highest abundance between 180 and 320 kDa in agreement with the sizes observed for major protein translocases62,70,71. Proteins involved in regulatory or redox processes are predominantly found in the low molecular mass range. The category morphology and dynamics displays a broad distribution with a maximum at an apparent mass of >3,200 kDa (Fig. 2) that includes the mitochondrial contact site and cristae organizing system (MICOS) and associated assemblies1,10.

