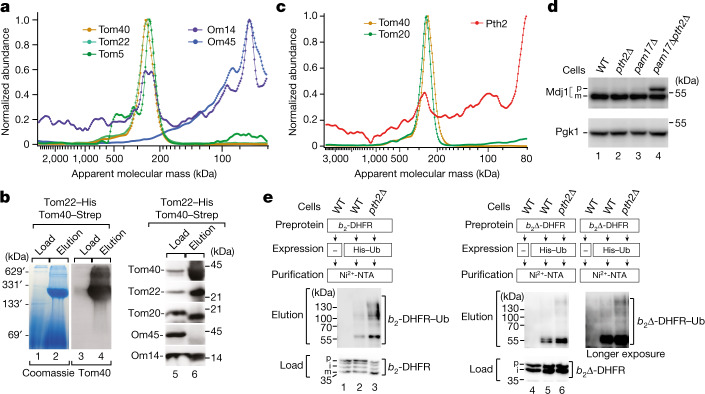
Fig. 3. The TOM complex interacts with the ribosome receptor Om14 and the quality-control factor Pth2.
a, Normalized abundance–mass profiles of the TOM subunits Om14 and Om45. b, Tom22–His Tom40–Strep mitochondria were lysed with digitonin and processed for tandem affinity purification through Ni-NTA agarose and Strep-Tactin Sepharose. The samples were analysed by blue native electrophoresis or SDS–PAGE followed by Coomassie staining (lanes 1 and 2) or immunodetection using the indicated antisera. Load, 0.2% (blue native gel) or 1% (SDS–PAGE); elution, 100%. c, Normalized abundance–mass profiles of Tom40, Tom20 and Pth2. d, Cell extracts of the indicated strains were analysed by immunodetection. p, precursor; m, mature form. e, Wild-type (WT) and pth2∆ cells expressing cytochrome b2–DHFR or b2∆–DHFR precursors and His-tagged ubiquitin as indicated were lysed under denaturing conditions and affinity-purified through Ni-NTA agarose. Proteins were analysed by SDS–PAGE and immunodetection. Affinity purification of tagged ubiquitin under denaturing conditions leads to an enrichment of proteins with covalently attached ubiquitin41. b2-DHFR–Ub, ubiquitin modified b2-DHFR; b2∆-DHFR–Ub, ubiquitin modified b2∆-DHFR; i, intermediate.

