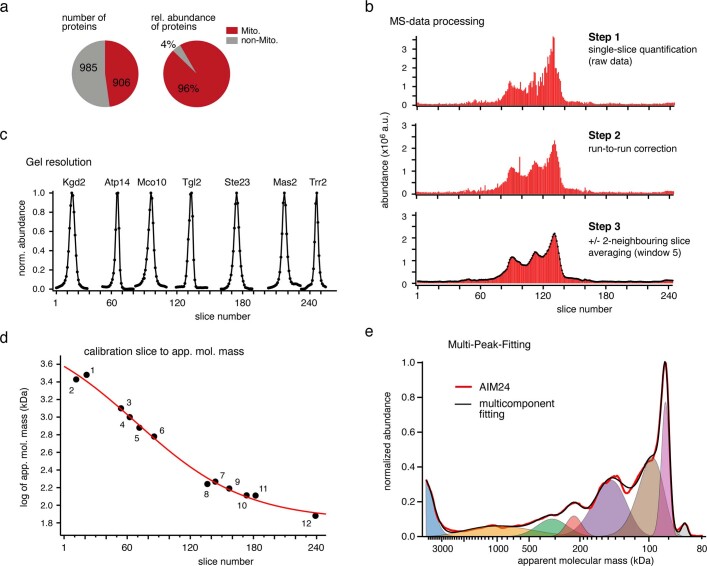
Extended Data Fig. 2. Benchmarking of cryo-slicing blue native mass spectrometry.
a, Diagram summarizing number and abundance of proteins identified in the mitochondrial preparation from yeast. We used a mild procedure for mitochondrial preparation such that possible interaction partners from other cellular compartments remained associated with the mitochondrial surface/outer membrane complexes b, Stepwise processing of MS-data as detailed in Materials and Methods using protein Por2 (VDAC2) as an example; the data points and line in black at step 3 represent the ‘abundance over slice number’ profile for Por2. c, Profiles (around the abundance peak) of the indicated mitochondrial proteins illustrating equally high resolution over the entire blue native gel range. d, Conversion of slices to apparent molecular mass using fit of a sigmoidal function (curve in red) to the masses of the following proteins: 1, Oxoglutarate Dehydrogenase/Ketoglutarate Dehydrogenase complex (3020 kDa); 2, pre-60S ribosome large subunit (2680 kDa); 3, Dimer of F1FO-ATP synthase (1250 kDa); 4, III2IV2 supercomplex (1000 kDa); 5, III2IV1 supercomplex (750 kDa); 6, Monomer of F1FO-ATP synthase (600 kDa); 7, SAM-Mdm10 complex (185.5 kDa); 8, TIM22 complex (174 kDa); 9, ATM1 (155 kDa); 10, SAMcore complex (Sam50, Sam37, Sam35, 129.4 kDa); 11, succinate dehydrogenase (130 kDa); 12, NADPH-cytochrome P450 reductase (Ncp1, 77 kDa). e, Multi-peak fitting by an automated algorithm approximating the profile data obtained for Aim24 (altered inheritance rate of mitochondria) (red line) by a sum of eight Gaussian functions (see Methods). The procedure provided the Gaussian parameters midpoint (apparent molecular mass), amplitude (abundance) and half-width (focusing or variation in size) for the peaks detected in a given profile. Black line represents the result of the multi-component fit, individual Gaussians are colour-coded.

