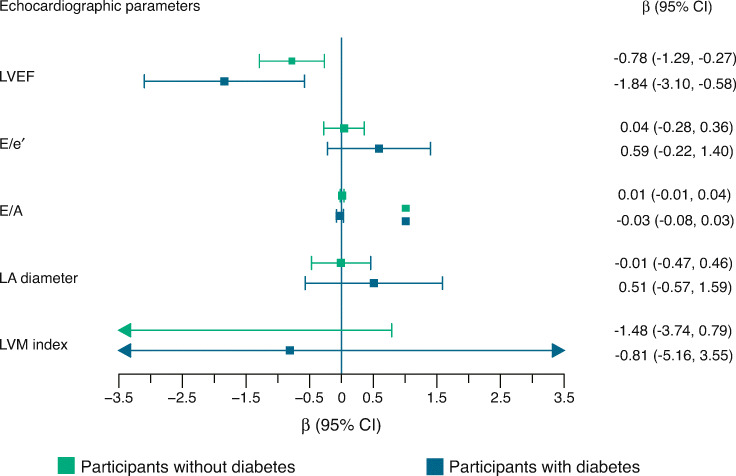
Fig. 2.
Association of SAF with parameters of LV systolic and diastolic function by type 2 diabetes status. Mean difference (β) (95% CI) for one unit increase in SAF was calculated using linear regressions adjusted for age, sex, CHD, hypertension, smoking status, waist circumference, monthly income and physical activity. The number of participants without diabetes was 2069 and with diabetes was 357 in the original data. Arrows in the figure indicate that CI interval exceeds the width of the x-axis

