

Abstract
Background and Objectives:
Identifying a precise genetic diagnosis can improve outcomes for individuals with rare disease, though the resources required to do so may impede access and exacerbate healthcare disparities leading to inequitable care. Our objective was therefore to determine the effect of multiple sociodemographic factors on the yield of the diagnostic evaluation for genetics outpatients.
Methods:
Retrospective cohort study from 2017–2019 of outpatient genetics referrals at a pediatric academic tertiary care center. Exposures included: primary language, insurance type, and neighborhood resources (via the Childhood Opportunity Index, COI). The primary outcome was identification of a genetic diagnosis within 2 years of the initial clinic visit.
Results:
COI quintile was not significantly associated with the odds of diagnosis but was significantly associated with clinic attendance, with lower neighborhood resources leading to incomplete referrals. Limited English proficiency was associated with a higher odds of diagnosis, though at an older age. Public insurance was associated with increased access to genetic testing.
Conclusion:
Lower neighborhood resources are negatively associated with clinic attendance. Our findings further suggest delays in care and a referral bias for more severe phenotypes among families with limited English proficiency. Improved access to clinical genetics is needed to improve diagnostic equity.
Category of study: Clinical
Introduction
Rare diseases affect millions of individuals in the United States and disproportionately contribute to morbidity and mortality.1–6 Most rare childhood diseases are thought to be genetic, and identifying the precise causative change in the genome, referred to as a molecular diagnosis, can lead the way to novel treatments or therapies in addition to other improved outcomes.7–9 However, access to the resources necessary to identify such a diagnosis are unlikely to be distributed equitably and may lead to lower rates of diagnosis in populations with historically reduced access to healthcare. Prior studies have shown that certain areas of the country have few practicing geneticists to evaluate and diagnose genetic syndromes10,11, and access to any subspecialty care, genetics included, is limited for children who live in lower-income neighborhoods or belong to minoritized racial or ethnic groups.12 Additionally, even if a clinical geneticist is available within a certain city or region, children who may have an underlying genetic diagnosis may not be referred for evaluation due to failure to recognize the features of a certain condition or other barriers to clinic attendance.13 This referral bias disproportionately affects minoritized racial and ethnic groups, where syndromic features may not be recognized14, as well as children within communities with impaired access to healthcare for socio-economic or other reasons.
Once established within the genetics clinic, families may still face additional barriers along the path to identification of a molecular diagnosis – the care cascade that has come to be known as the “diagnostic odyssey”.15 These include: lack of recognition of a genetic condition, difficulty obtaining insurance coverage for genetic testing, difficulty accessing the lab to provide samples for genetic testing, and challenges in variant interpretation due to a paucity of non-European ancestry groups in genetic reference databases.13,16 The end result of such barriers in access to testing may be a lower diagnostic yield for families of lower socioeconomic position or from minoritized racial or ethnic groups.16–18 However, while disparities in use of, or access to, genomic medicine have been evaluated related to many conditions primarily affecting adults or for more common diseases19–22, the extent and nature of these disparities has not been fully defined in the pediatric rare disease community. We therefore sought to determine the influence of social determinants of health, in particular, neighborhood resources and primary language, on the genetic diagnostic odyssey at a high-volume pediatric outpatient genetics clinic.
Methods
This is a retrospective cohort study of an outpatient genetics clinic within an academic, pediatric tertiary care center in an urban community. We identified all outpatients with their first visit to genetics clinic scheduled to be in 2017 and abstracted data from the electronic health record (EHR) pertaining to the genetic evaluation for up to two years (730 days) following this initial visit date. The two year follow-up period was set for consistency in the amount of time each cohort member had for their diagnostic odyssey. Data were collected using REDCap hosted at our institution.23 The Boston Children’s Hospital Institutional Review Board reviewed and approved this analysis with a waiver of informed consent due to the nature of the study.
We developed a conceptual model related to disparities in genetic diagnosis that guided our data collection and analysis (Figure 1). The primary exposure evaluated was individual-level Childhood Opportunity Index (COI) quintile, which takes into account multiple dimensions of neighborhood resources (health, education, socioeconomic status) in order to generate a composite measure with normative levels at the metro, state, or national level.24 State-normed COI data were used in this study due to the geographical diversity of our cohort, where many families lived outside our metro area. Our primary outcome was diagnostic yield: whether or not a molecular genetic diagnosis was identified within two years of the initial clinic visit. Other exposures assessed included: primary language, ancestry, insurance type, and reason for genetics evaluation (presenting phenotype). We also evaluated intermediate steps along the path to a genetic diagnosis such as clinic attendance, prior testing, testing planned, and testing sent. Exposure and outcome data were abstracted from our EHR by two reviewers. Further information on our exposure and outcome variables and the analysis plan is provided in the Supplement.
Figure 1. Conceptual model.

The relationship between various social determinants of health and the primary outcome of genetic diagnosis. Yellow circles indicate exposures analyzed as possible predictors of the outcome (green circle). Blue circles indicate possible confounders. The dashed arrow reflects that race is a social construct that may overlap with genetic ancestry.
We first evaluated the relationship between the above exposures and clinic attendance, comparing those who attended the first scheduled visit to those whose visit was either cancelled or was neither attended nor cancelled (“no show”). Then, focusing on the patients who attended this first clinic visit, we evaluated the relationship between these exposures and reason for clinic visit. Finally, for those who were undiagnosed at this first clinic visit, we evaluated the yield of the genetic diagnostic odyssey and the above exposures as possible predictors of this outcome. To avoid confounding in our analysis of diagnostic yield, we excluded certain reasons for referral from this analysis (Figure 2) because either a) the diagnosis was already known or had been made clinically or b) because diagnostic molecular testing was less likely to be sent for these indications or c) such testing has a yield skewing high or low. Patients were considered “diagnosed” if, over the 2 years following the initial clinic visit, a likely pathogenic or pathogenic variant was identified or a variant of unknown significance was identified that was clinically considered to be diagnostic.
Figure 2. CONSORT-style diagram.
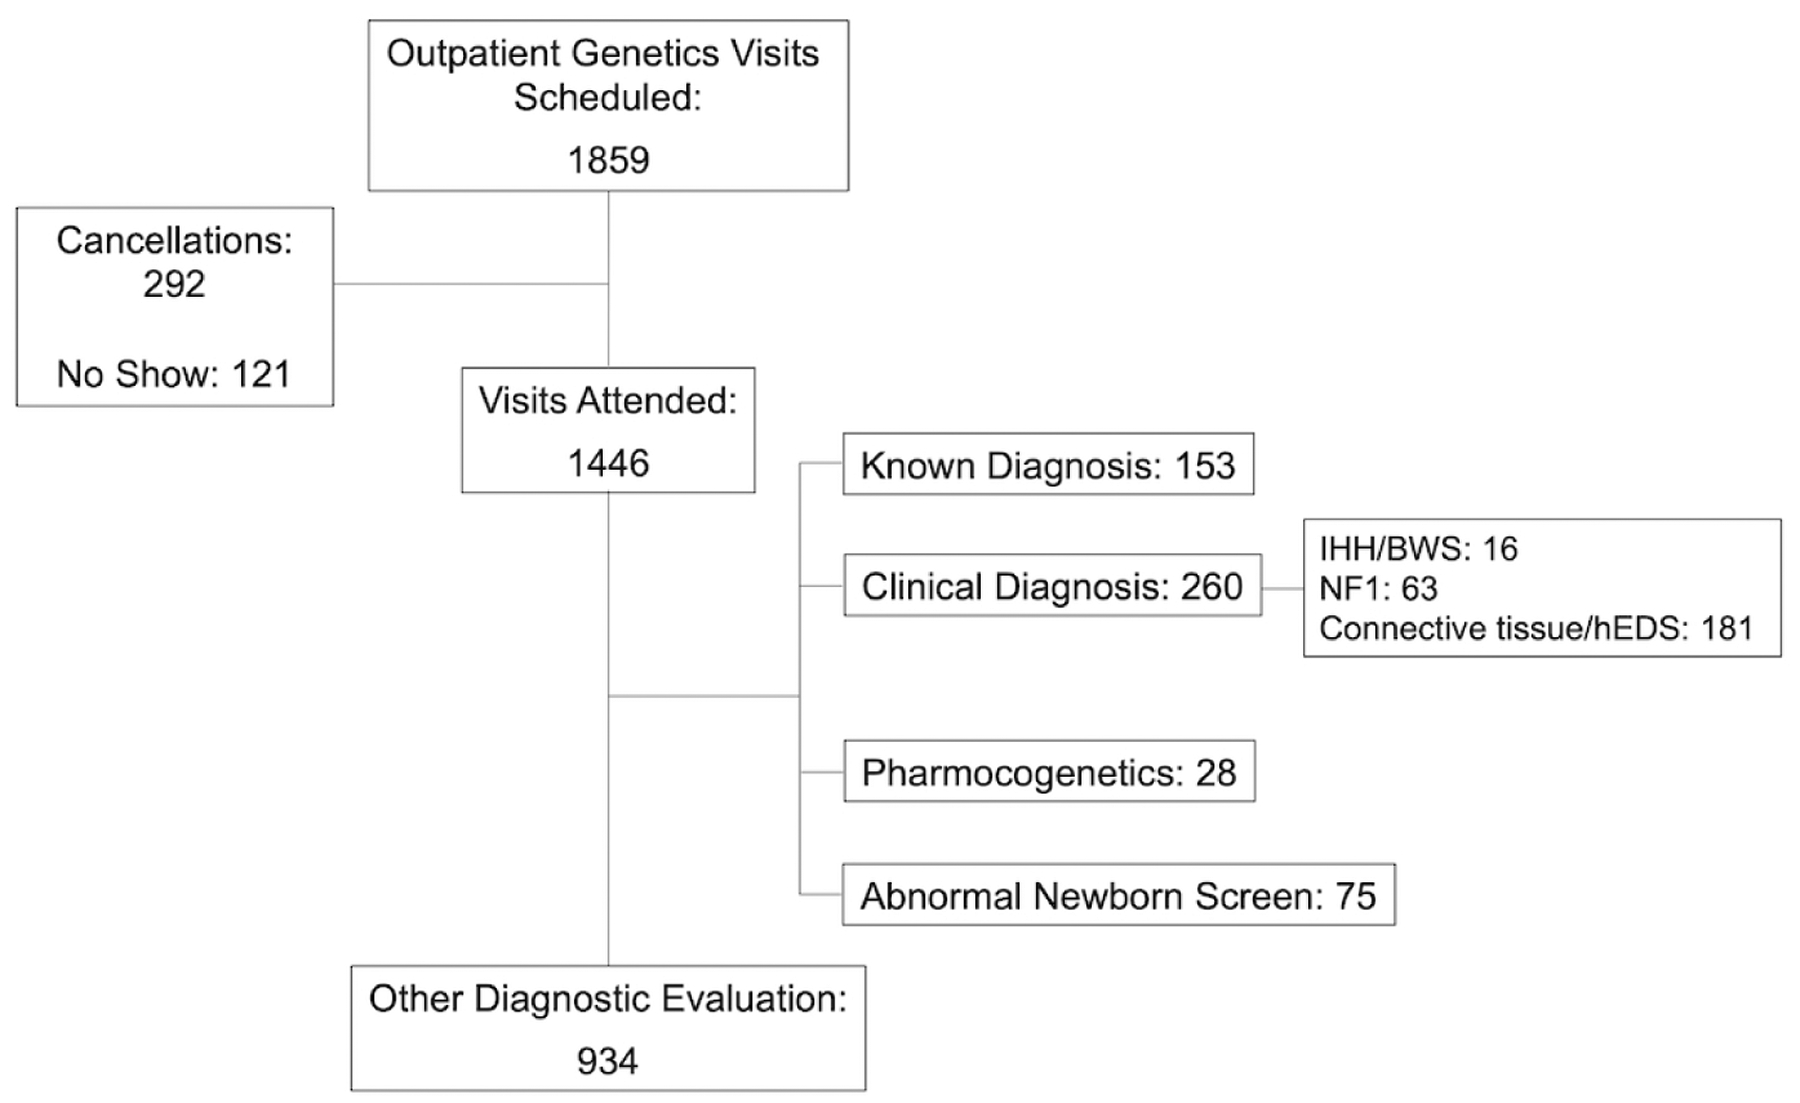
Of the attended visits, certain indications for genetics visit were excluded from further analysis (indications are not mutually exclusive, and individuals with one excluded diagnosis and one included diagnosis were included in the analysis). CONSORT, Consolidated Standards of Reporting Trials, IHH/BWS, isolated hemihyperplasia/Beckwidth-Wiedemann syndrome; NF1, Neurofibromatosis 1; hEDS, hypermobile Ehlers-Danlos syndrome.
Statistical analysis was performed using SPSS version 27 (IBM Corporation, Armonk, NY).
Results
Of 1859 patients with scheduled visits, 413 resulted in cancellations or no shows, leading to 1446 patients seen (Table 1). Of the attended visits, 934/1446 (64.6%) were for the purpose of diagnostic evaluation per our pre-specified criteria (Figure 2).
Table 1.
Demographic features of genetics outpatients with initial clinic visit in 2017.
| N = 1859 | |
|---|---|
| Sex (female) | 884 (47.6%) |
| In state | 1379 (74.2%) |
| Race | |
| White | 959 (50.5%) |
| Black | 97 (5.2%) |
| Asian/Pacific Islander | 62 (3.4%) |
| Native American | 6 (0.3%) |
| Other | 274 (14.7%) |
| Unknown | 482 (25.9%) |
| Language | |
| English | 1594 (85.7%) |
| Spanish | 109 (5.9%) |
| Arabic | 87 (4.7%) |
| Other a | 69 (3.7%) |
| Insurance Plan | |
| Private | 1132 (60.9%) |
| Public | 622 (33.5%) |
| International | 74 (4.0%) |
| Self-pay | 27 (1.5%) |
| Unknown | 4 (0.2%) |
| COI Overall | N = 1682 |
| Very low | 290 (17.2%) |
| Low | 285 (17.0%) |
| Moderate | 308 (18.3%) |
| High | 377 (22.4%) |
| Very High | 421 (25.0%) |
COI, childhood opportunity index, state-normalized data. a) Other languages included Albanian (2), Cape Verde Creole (6), Chinese (10), Haitian Creole (7), Hindi (1), Indian (1), Italian (1), Korean (1), Polish (1), Portuguese (16), Russian (7), Sign Language (6), Somalian (5), Urdu (1), Vietnamese (3), unspecified (1). Further details on “Other” race are generally not available in our electronic medical record.
In comparing socio-demographic features of those who attended the first clinic visit compared to cancellation and “no shows”, we identified significant variation in clinic attendance related to state-normed overall childhood opportunity by quintile (Table 2), where those in the “no show” category were more likely to live in a “Very Low” COI neighborhood and those who attended the clinic visit had a higher proportion in the higher COI quintiles. We also found significant differences in clinic attendance related to primary language and insurance plan, with the “no show” group having a higher percentage of Spanish-speaking individuals as well as those with public insurance (Table 2).
Table 2.
Relationship between socio-demographic features and clinic attendance.
| Attended N = 1446 | Cancelled N = 292 | No Show N = 121 | p | |
|---|---|---|---|---|
| Female sex | 681 (47.1%) | 151 (51.7%) | 52 (43.0%) | 0.21 |
| In state | 1093 (75.6%) | 184 (63.0%) | 102 (84.3%) | <0.001 |
| Language | 0.03 | |||
| English | 1247 (86.2%) | 249 (85.3%) | 98 (81.0%) | |
| Spanish | 81 (5.6%) | 14 (4.8%) | 14 (11.6%) | |
| Arabic | 66 (4.6%) | 19 (6.5%) | 2 (1.7%) | |
| Other | 52 (3.6%) | 10 (3.4%) | 7 (5.8%) | |
| Insurance Plan | <0.001 | |||
| Private | 912 (63.1%) | 181 (62.2%) | 39 (32.8%) | |
| Public | 453 (31.3%) | 91 (31.3%) | 78 (65.5%) | |
| International | 58 (4.0%) | 14 (4.8%) | 2 (1.7%) | |
| Self-pay | 22 (1.5%) | 5 (1.7%) | 0 (0%) | |
| Unknown | 1 (0.1%) | 1 (0.3%) | 2 (1.7%) | |
| COI Overall | N = 1304 | N = 263 | N = 114 | <0.001 |
| Very low | 207 (15.9%) | 43 (16.3%) | 40 (35.1%) | |
| Low | 206 (15.8%) | 51 (19.4%) | 28 (24.6%) | |
| Moderate | 252 (19.3%) | 44 (16.7%) | 12 (10.5%) | |
| High | 310 (23.8%) | 49 (18.6%) | 19 (16.7%) | |
| Very High | 329 (25.2%) | 76 (28.9%) | 15 (13.2%) |
COI, Childhood Opportunity Index (state-normalized data). Patients with cancellations or no shows that then rescheduled and attended in 2017 were counted as attended visits with the date of the first attended visit used as the index date
For the 1446 outpatients who attended their initial genetics clinic visit in 2017, we reviewed the reasons for referral to the genetics clinic and associated socio-demographic features. Significant differences in COI quintiles were identified for autism, possible metabolic disorder, hypermobile Ehlers-Danlos syndrome, and management of a known diagnosis, where autism had a higher proportion of individuals in the lower COI quintiles and the others had higher proportions in the higher COI quintiles. Of note, none of those presenting for pharmacogenomics evaluation and only one person presenting for hypermobile Ehlers-Danlos syndrome had limited English proficiency. (Supplemental Table S1). Supportive of our exclusions in the analysis of diagnostic yield (Figure 2) we found that hypermobility (2/87, 2%) and connective tissue evaluations (5/108, 5%) had low rates of molecular diagnosis, as did hemihypertrophy/Beckwith-Wiedemann syndrome and Neurofibromatosis 1 combined (3/79, 4%), whereas referral for an abnormal newborn screen had a relatively high yield (23/80, 29%).
We then focused on the 934 individuals who presented for diagnostic evaluation for the following indications: developmental delay/intellectual disability, autism, congenital anomalies, neurologic disease, short stature or failure to thrive, other organ system-based complaints (ophthalmologic, otologic, immunologic, dermatologic, endocrinologic, metabolic), family history of genetic disorder, or discussion of test results sent by another provider. The overall diagnostic yield was 176/934 (18.8%) including both chromosomal and monogenic conditions (Supplemental Table S2).
An analysis of demographic and clinical predictors of diagnostic yield is displayed in Table 3. No differences were found in diagnostic yield across COI quintiles. Those who had a confirmed diagnosis had a significantly lower age at first clinic visit. Additionally, there was an association between primary language and diagnostic yield, with English speakers comprising a smaller proportion of those who had a confirmed diagnosis and Spanish and Arabic speakers comprising a higher proportion compared to the undiagnosed. No differences were found across ancestry categories or by insurance status. The diagnostic yield varied by indication for evaluation, with a lower proportion of diagnoses found in those with autism and a higher proportion in those with other specific organ system anomalies. We did not identify any significant differences in diagnostic yield comparing those with or without any genetic testing performed prior to the clinic visit (62/378 [16.4%] vs 114/556 [20.5%], p = 0.13) or when comparing specific tests (e.g. gene panel testing). Individuals with genetic testing planned at the first clinic visit were more likely to have a diagnosis identified within the study time period, particularly if this was a single gene test – suggesting that this individual presented with a specific phenotype. Supportive of this theory is the finding that, when evaluating the relationship between number of tests sent over the two-year period and diagnosed status (excluding those who had no testing sent), those who remained undiagnosed had more testing (median 2, IQR 1–3) than those who had a diagnosis made (median 1, IQR 1–2, p = 0.021). No significant differences were seen across COI quintiles or language or insurance categories. The modalities leading to diagnosis were: karyotype and fluorescence in situ hybridization (8/176, 4.5%), microarray (23/176, 13.1%), single gene test (37/176, 21.0%), gene panel (47/176, 26.7%), exome sequencing (48/176, 27.3%), with other tests each contributing less than 2%. There was no significant variation in modality leading to diagnosis by COI quintile, language, or insurance type.
Table 3.
Demographic and clinical predictors of a genetic diagnosis
| Total 934 | Diagnosis Found 176 | No Diagnosis 758 | p | |
|---|---|---|---|---|
| Female sex | 402 (43.0%) | 80 (45.5%) | 322 (42.5%) | 0.50 |
| Age at first clinic visit, years (median, IQR) | 3.1 (0.9–7.8) | 2.1 (0.5–7.4) | 3.4 (1.1–7.8) | 0.003 |
| In state | 706 (75.6%) | 129 (73.3%) | 577 (76.1%) | 0.44 |
| Ancestry | ||||
| African continent | 69 (7.4%) | 12 (6.8%) | 57 (7.5%) | 0.87 |
| Asia/Pacific Islands | 70 (7.5%) | 17 (9.7%) | 53 (7.0%) | 0.26 |
| Middle East | 91 (9.8%) | 23 (13.1%) | 68 (9.0%) | 0.12 |
| Latin America | 179 (19.2%) | 36 (20.5%) | 143 (18.9%) | 0.67 |
| North America | 180 (19.3%) | 34 (19.3%) | 146 (19.3%) | >0.99 |
| Europe | 522 (55.9%) | 95 (54.0%) | 427 (56.3%) | 0.61 |
| Unknown | 130 (13.9%) | 21 (11.9%) | 109 (14.4%) | 0.47 |
| Language | 0.04 | |||
| English | 789 (84.4%) | 139 (79.0%) | 650 (85.8%) | |
| Spanish | 55 (5.9%) | 15 (8.5%) | 40 (5.3%) | |
| Arabic | 56 (6.0%) | 17 (9.7%) | 39 (5.2%) | |
| Other | 34 (3.7%) | 5 (2.8%) | 29 (3.9%) | |
| Insurance Plan | 0.58 | |||
| Private | 551 (59.0%) | 96 (54.5%) | 455 (60.0%) | |
| Public | 319 (34.2%) | 67 (38.1%) | 252 (33.2%) | |
| International | 47 (5.1%) | 9 (5.1%) | 38 (5.0%) | |
| Self-pay | 17 (1.8%) | 4 (2.3%) | 13 (1.7%) | |
| Overall COI Level | N = 830 | N = 157 | N = 673 | 0.34 |
| Very low | 146 (17.7%) | 26 (16.6%) | 120 (18.0%) | |
| Low | 127 (15.3%) | 31 (19.7%) | 96 (14.3%) | |
| Moderate | 145 (17.5%) | 30 (19.1%) | 115 (17.1%) | |
| High | 207 (25.0%) | 32 (20.4%) | 175 (26.0%) | |
| Very High | 205 (24.7%) | 38 (24.2%) | 167 (24.8%) | |
| Reason for visit | ||||
| DD/ID | 283 (30.3%) | 59/283 (21.0%) | 224/283 (79.2%) | 0.32 |
| Autism | 149 (16.0%) | 11/149 (7.4%) | 138/149 (92.6%) | <0.001 |
| Congenital anomalies | 231 (24.7%) | 45/231 (19.5%) | 186/231 (80.5%) | 0.77 |
| Neurologic | 199 (21.3%) | 42/199 (21.1%) | 157/199 (78.9%) | 0.36 |
| Metabolic disease | 129 (13.8%) | 18/129 (14.0%) | 111/129 (86.0%) | 0.15 |
| Other | 305 (32.7%) | 81/305 (26.6%) | 224/305 (73.4%) | <0.001 |
| Genetic testing recommended at first visit | 318 (34.0%) | 77 (44.0%) | 241 (31.8%) | 0.003 |
| Type of test | ||||
| Karyotype | 43 (4.6%) | 12 (6.8%) | 31 (4.1%) | 0.16 |
| CMA | 187 (20.0%) | 31 (17.6%) | 156 (20.6%) | 0.40 |
| Single gene | 50 (5.4%) | 23 (13.1%) | 27 (3.6%) | <0.001 |
| Gene panel | 88 (9.5%) | 21 (11.9%) | 67 (8.9%) | 0.25 |
| Exome sequencing | 13 (1.4%) | 2 (15.4%) | 11 (84.6%) | >0.99 |
| Fragile X | 75 (8.0%) | 6 (3.4%) | 69 (9.1%) | 0.01 |
IQR, interquartile range; DD/ID, developmental delay or intellectual disability; CMA, chromosomal microarray.
Considering the relationship between these predictors and diagnostic yield, we created a multivariable logistic regression model incorporating language, reason for visit, and age at first visit (Table 4). After controlling for reason for visit and age at first visit, primary language continued to be a predictor of a diagnosis, with both Arabic-speaking and Spanish-speaking families having a higher odds of diagnosis compared to English speakers.
Table 4.
Multivariate model: the effect of multiple predictors on diagnosed status:
| Exposure | Unadjusted Odds Ratio (95% C.I.) | p | Adjusted Odds Ratio (95% C.I.) | p | |
|---|---|---|---|---|---|
| Primary language | |||||
| English | (ref) | (ref) | |||
| Spanish | 1.8 (0.9–3.3) | 0.08 | 2.3 (1.2–4.5) | 0.01 | |
| Arabic | 2.0 (1.1–3.7) | 0.02 | 1.9 (1.0–3.5) | 0.05 | |
| Other | 0.8 (0.3–2.1) | 0.66 | 0.9 (0.3–2.3) | 0.79 | |
| Age, years* | 0.8 (0.8–0.9) | 0.001 | 0.8 (0.7–0.9) | 0.001 | |
| Insurance | Private | (ref) | n/a | ||
| Public | 1.3 (0.9–1.8) | 0.19 | |||
| International or self-pay | 1.2 (0.6–2.3) | 0.57 | |||
| COI levels | n/a | ||||
| Very low | (ref) | ||||
| Low | 1.5 (0.8–2.7) | 0.18 | |||
| Moderate | 1.2 (0.7–2.2) | 0.53 | |||
| High | 0.8 (0.5–1.5) | 0.56 | |||
| Very high | 1.1 (0.6–1.8) | 0.86 | |||
| Reason for visit: | |||||
| DD/ID | 1.2 (0.8–1.7) | 0.30 | 1.8 (1.2–2.7) | 0.008 | |
| Autism | 0.3 (0.2–0.6) | <0.001 | 0.4 (0.2–0.8) | 0.008 | |
| Congenital anomalies | 1.1 (0.7–1.5) | 0.78 | 1.1 (0.7–1.7) | 0.69 | |
| Neurologic | 1.2 (0.8–1.8) | 0.36 | 1.3 (0.8–2.0) | 0.23 | |
| Metabolic disease | 0.7 (0.4–1.1) | 0.13 | 1.0 (0.5–1.9) | >0.99 | |
| Other | 2.0 (1.5–2.8) | <0.001 | 2.3 (1.5–3.6) | <0.001 |
COI, Childhood Opportunity Index, DD/ID, developmental delay or intellectual disability.
Log-transformed.
We then evaluated the process of the genetic diagnostic odyssey related to socio-demographic factors in order to further understand the multivariable model results in an exploratory model of intermediates in the relationship between our exposures and outcome (Supplemental Figure S1). Language, insurance type, and COI quintile were all significantly associated with the likelihood of testing being planned at the first visit or sent over the two years following this first visit, where more testing was sent with those who had public insurance or from lower COI quintiles. Language was significantly associated with insurance category, where Spanish language-speaking families had a higher percentage with public insurance. This association may explain why testing was planned earlier and sent more often for those with Spanish or Arabic as the primary language and subsequently why diagnoses were more frequently identified.
We also evaluated trends across the entire cohort related to usage of exome sequencing, which is known to be high yield for diagnosis in pediatric populations with suspected genetic disease.25 We found that those who were primarily Arabic-speaking or who had international insurance were over-represented in the group of patients who had exome sequencing while those who were Spanish-speaking or had public insurance were under-represented. Neighborhoods with “High” or “Very High” COI levels also appeared to be over-represented, though this difference was not statistically significant (Supplemental Table S3).
Due to this variation in the diagnostic odyssey and the potential impact on the time to diagnosis, we performed a survival analysis to evaluate the impact of COI quintile, language, and insurance status on time to diagnosis (Supplemental Figure S2). We found a significant relationship between language status and time to diagnosis, with non-English speakers experiencing a shorter time to diagnosis, but time to diagnosis was not significantly different across insurance categories or COI quintiles. A Cox proportional hazards model evaluating the relationship between language status and time to diagnosis, adjusting for phenotype, demonstrated that the Spanish speaking families had a higher hazard of diagnosis over the study period compared to English-speaking patients even after controlling for phenotype (hazard ratio, HR = 2.0, 95% C.I. 1.2–3.5), p = 0.01, though the HRs were not significant for Arabic (HR 1.6, 95% CI 1.0–2.7, p = 0.07) or other languages (HR = 0.8, 95% CI 0.3–1.9, p = 0.6). We also found that median age at diagnosis varied between groups, with primary English-speaking patients having a younger median age at diagnosis (2.2 years, interquartile range [IQR] 0.9–6.5 years) compared to Spanish-speaking patients (5.9 years, IQR 1.0–12.6 years), Arabic (4.2 years, IQR 1.5–7.7 years) and other languages (10.4 years, IQR 2.5–21.1 years) though this difference did not reach statistical significance (p = 0.06). As our Arabic-speaking population was found in the prior analyses to represent a unique group with a high diagnostic yield, we then focused on the non-Arabic speaking families and identified a younger median age at diagnosis for English-speaking families (2.2 years, IQR 0.9–6.5 years) versus those who were non-English and non-Arabic speaking (7.3 years, IQR 1.8–12.3 years), p = 0.03.
Discussion
We present an analysis of socio-demographic factors related to the genetic diagnostic odyssey in the outpatient setting. Our main finding was that the primary source of inequity in access to a genetic diagnosis was access to the genetics clinic, where lack of neighborhood resources was negatively associated with clinic attendance. Variation in the reason for referral was also observed, with important implications for referral patterns and evidence of referral bias, where conditions such as hypermobile Ehlers-Danlos syndrome should not be concentrated in those with higher neighborhood resources, though referrals for these conditions were enriched in this way. Our results are also consistent with prior research that has shown that people who attend a genetics clinic visit tend to have higher levels of education and income, and are less likely to identify with a minoritized population26. Engagement in research studies for genetic diagnosis has also been found to be lower for populations with historically poor access to healthcare.27
Once in the clinic, there was no difference in diagnostic yield related to COI quintile, though there was significant variation related to primary language, where those who spoke Arabic or Spanish as a primary language had a higher odds of diagnosis compared to English speakers, even when considering other factors such as age and reason for visit. Although we had hypothesized that families with limited English proficiency would have more difficulty navigating the diagnostic odyssey, associations between intermediate factors related to access to genetic testing were identified that may explain this finding. We observed that Spanish speaking patients in our study were more likely to have public insurance, which may facilitate access to genetic testing in our clinic as prior authorization is not typically pursued (since the patient cannot be balance-billed). Thus, a child with public insurance may be more likely to have testing planned and ordered on the day of the first visit, while a child with private insurance would have to await insurance authorization which may not be successful. Indeed, insurance authorization has been identified as a substantial barrier to outpatient genetic testing28,29. While prior studies of adult patients have found that genetic testing is more easily accessed for those with private insurance compared to Medicaid17, a recent analysis focusing on pediatric patients found that insurance prior authorization denials were less frequent with public compared to private payers29. Furthermore, of all prior authorization requests that were either approved or determined to not require prior authorization in this study, 26% did not proceed to actual testing, supporting our hypothesis that ordering and sending a genetic test on the same day of the initial clinic visit greatly facilitates access to a diagnosis29. However, the improved access to testing that we observed with public insurance did not carry over to exome sequencing, where inequities were identified.
Another factor driving diagnostic yield, which is more difficult to quantify, is the underlying likelihood of a genetic diagnosis among those presenting to clinic. It may be that the children seen in clinic who were from families of limited English proficiency had more severe or extreme presentations and a higher pre-test probability of a diagnostic test result. Similarly, a higher diagnostic yield for patients from minoritized populations compared to white individuals via gene panel testing for RASopathies (Noonan syndrome and related disorders) was identified at a molecular diagnostic laboratory16 and also may reflect bias in recognition of genetic syndromes in minoritized populations and subsequent referral for testing - where white patients might have had testing for a milder phenotype. We found that children from families with limited English proficiency were older at diagnosis, suggesting a delay in referral and supporting our conclusion that a major disparity in identifying a genetic diagnosis relates to access to a genetics clinic. Additionally, many of the Arabic-speaking families were from communities with higher rates of consanguinity and may be at higher risk for recessive conditions, although de novo dominant conditions are still frequently identified in these populations30. It is difficult, however, to draw conclusions regarding language and the likelihood of a diagnosis from a biological standpoint, as both Spanish-speaking and Arabic-speaking families represent diverse ethnic identities and ancestral backgrounds. Shared language was not intended to serve as a proxy for shared ancestry in our stud, rather, we considered limited English proficiency as a potential barrier in access to care.
Though we were unable to evaluate the impact of structural racism on identification of a genetic diagnosis within our cohort due to lack of data within our EHR, prior work has shown that white individuals are concentrated in neighborhoods with higher levels of childhood opportunity, while those who are Black or Hispanic are concentrated in neighborhoods of lower childhood opportunity, a phenomenon known as “opportunity hoarding”.31 We found a negative association between COI quintile and clinic attendance suggesting a possible racial and ethnic bias in referral for which COI might be a proxy. A distinct, though somewhat related, issue relates to genetic ancestry, where interpretation of variants of uncertain significance may be more challenging in populations that are poorly represented in genetic reference databases.16 We did not detect significant differences in diagnostic yield related to self-reported ancestry in our study. Many rare diseases are caused by de novo variants, and thus, determination of the pathogenicity of these variants may not be as reliant upon population reference databases as are inherited variants such as those seen in genes related to cancer predisposition or cardiomyopathy or evaluation of complex traits, where lack of diversity in population databases makes diagnosis challenging.16,19,22,32 While we support diversification of reference databases, our results suggest that directing resources towards addressing referral bias and providing support for patients to attend clinic is equally important, albeit not unique to genetics as a subspecialty.
Limitations to our study include the observational nature and sample size, and that this analysis represents the workflow within a single academic institution. Though our overall cohort was large, the proportion diagnosed was smaller and presented challenges to analysis adjusting for multiple factors such as language, reason for visit, and COI. We were also unable to elaborate on inequities in referral patterns due to the study design, thus future analyses are needed in order to explore the outcomes for patients who did not attend their clinic visit. Due to the timeframe of the study, we were also unable to evaluate the impact of telehealth, though our data may provide a helpful benchmark for future analyses of the landscape of outpatient genetics referrals incorporating such visits, which improve access if transportation to clinic is a major barrier, but not if other factors such as time off from work to attend a visit are the primary barriers. As telehealth practices were rapidly incorporated into our practice in 2020 and have evolved substantially since then, future research is needed to evaluate the impact of this change to clinic structure once enough time has passed to evaluate the telehealth diagnostic odyssey.
Overall, our results demonstrate significant variation in the genetic diagnostic odyssey related to sociodemographic characteristics and suggest that access to the genetics clinic is the most salient barrier to obtaining a diagnosis for children with rare disease. Our results represent a balance of many interacting features relating to detection of a genetic diagnosis, where this outcome depends on two important factors – whether or not the patient has an underlying diagnosis (unmeasurable, but potentially predictable), and whether or not testing was sent (measured in this study). Our patients with historically greater access to healthcare due to English language, insurance type, or higher neighborhood resources may have presenting phenotypes that were less extreme or severe and less likely to be genetic, leading to a lower yield. Conversely, those with limited English proficiency, public insurance, or lower neighborhood resources, may have had more extreme or severe phenotypes because of decreased access to healthcare and increased likelihood of missing a genetic phenotype in minoritized individuals, thus leading to a higher yield once they do present. The rise of exome sequencing availability, even during the study period, may impact access to a diagnosis, though this will be contingent upon equitable access to this test.33 Our results suggest that improved engagement with primary care physicians and other providers responsible for outpatient genetics referrals would be helpful to address these disparities that we have identified, and that additional insight into the factors driving delayed or incomplete referrals is critical. Future studies incorporating implementation science and equity-focused quality improvement are needed to continue to explore issues of access within clinical genetics in order to identify and address inequities in care.
Supplementary Material
Impact:
The resources required to identify a genetic diagnosis may impede access and exacerbate healthcare disparities leading to inequitable care.
In an analysis of pediatric outpatient genetics referrals, we observed a significant association between neighborhood resources and clinic attendance but not diagnostic yield for those attending, and a higher diagnostic yield for families with limited English proficiency, suggesting referral bias for more severe phenotypes.
Thus, the primary barrier to finding a genetic diagnosis was initiation of care, not the ensuing diagnostic odyssey.
Further research efforts should be directed at increasing access to clinical genetics evaluations for children with rare disease.
Acknowledgements:
The authors thank the geneticists and genetic counselors that we work with who work tirelessly to provide equitable care in their clinical practice. We also thank Dr. Henry Feldman for statistical support.
Funding:
Dr. Wojcik was supported by a Boston Children’s Hospital Medical Staff Organization Faculty Innovated Research Award and the National Institute of Child Health and Human Development K23 HD102589. Ms. Bresnahan was supported by the Harvard Neonatal-Perinatal Medicine Summer Student Research Program. The other authors received no external funding.
Footnotes
Competing interests: The authors have no conflicts of interest relevant to this article to disclose.
Consent statement: This study was conducted with a waiver of written informed consent due to the nature of the study design.
Data Availability:
To protect patient privacy, the dataset generated and analyzed during the current study may be available from the corresponding author on reasonable request contingent on a data use agreement.
References
- 1.Gonzaludo N, Belmont JW, Gainullin VG, Taft RJ. Estimating the burden and economic impact of pediatric genetic disease. Genet Med. 2019;21(8):1781–1789. [DOI] [PMC free article] [PubMed] [Google Scholar]
- 2.Arth AC et al. Inpatient Hospitalization Costs Associated with Birth Defects Among Persons of All Ages - United States, 2013. MMWR Morb Mortal Wkly Rep. 2017;66(2):41–46. [DOI] [PMC free article] [PubMed] [Google Scholar]
- 3.Wojcik MH et al. Infant mortality: the contribution of genetic disorders. J Perinatol. 2019; 39(12):1611–1619. [DOI] [PMC free article] [PubMed] [Google Scholar]
- 4.Boyle B et al. Estimating Global Burden of Disease due to congenital anomaly: an analysis of European data. Arch Dis Child Fetal Neonatal Ed. 2018;103(1):F22–F28. [DOI] [PMC free article] [PubMed] [Google Scholar]
- 5.Haendel M et al. How many rare diseases are there? Nat Rev Drug Discov. 2020;19(2):77–78. [DOI] [PMC free article] [PubMed] [Google Scholar]
- 6.Navarrete-Opazo AA, Singh M, Tisdale A, Cutillo CM, Garrison SR. Can you hear us now? The impact of health-care utilization by rare disease patients in the United States. Genet Med. 2021;3(11):2194–2201. [DOI] [PMC free article] [PubMed] [Google Scholar]
- 7.Coulter ME et al. Chromosomal microarray testing influences medical management. Genet Med. 2011;13(9):770–776. [DOI] [PubMed] [Google Scholar]
- 8.Stark Z et al. Does genomic sequencing early in the diagnostic trajectory make a difference? A follow-up study of clinical outcomes and cost-effectiveness. Genet Med. 01 2019;21(1):173–180. = [DOI] [PubMed] [Google Scholar]
- 9.Kim J et al. Patient-Customized Oligonucleotide Therapy for a Rare Genetic Disease. N Engl J Med. 10 2019;381(17):1644–1652. = [DOI] [PMC free article] [PubMed] [Google Scholar]
- 10.Jenkins BD et al. The 2019 US medical genetics workforce: a focus on clinical genetics. Genet Med. 2021; 23(8):1458–1464. [DOI] [PMC free article] [PubMed] [Google Scholar]
- 11.Maiese DR et al. Current conditions in medical genetics practice. Genet Med. 2019;21(8):1874–1877. [DOI] [PMC free article] [PubMed] [Google Scholar]
- 12.Bohnhoff JC, Taormina JM, Ferrante L, Wolfson D, Ray KN. Unscheduled Referrals and Unattended Appointments After Pediatric Subspecialty Referral. Pediatrics. 2019;144(6) [DOI] [PubMed] [Google Scholar]
- 13.Fraiman YS, Wojcik MH. The influence of social determinants of health on the genetic diagnostic odyssey: who remains undiagnosed, why, and to what effect? Pediatr Res. 2021; 89(2):295–300. [DOI] [PMC free article] [PubMed] [Google Scholar]
- 14.Koretzky M et al. Towards a more representative morphology: clinical and ethical considerations for including diverse populations in diagnostic genetic atlases. Genet Med. 2016;18(11):1069–1074. [DOI] [PMC free article] [PubMed] [Google Scholar]
- 15.Carmichael N et al. “Is it going to hurt?”: the impact of the diagnostic odyssey on children and their families. J Genet Couns. 2015;24(2):325–335. [DOI] [PubMed] [Google Scholar]
- 16.Landry LG, Rehm HL. Association of Racial/Ethnic Categories With the Ability of Genetic Tests to Detect a Cause of Cardiomyopathy. JAMA Cardiol. 2018;3(4):341–345. [DOI] [PMC free article] [PubMed] [Google Scholar]
- 17.Suther S, Kiros GE. Barriers to the use of genetic testing: a study of racial and ethnic disparities. Genet Med. 2009;11(9):655–62. [DOI] [PubMed] [Google Scholar]
- 18.Bonkowsky JL, Wilkes J, Bardsley T, Urbik VM, Stoddard G. Association of Diagnosis of Leukodystrophy With Race and Ethnicity Among Pediatric and Adolescent Patients. JAMA Netw Open. 2018;1(7):e185031. [DOI] [PMC free article] [PubMed] [Google Scholar]
- 19.Wojcik GL et al. Genetic analyses of diverse populations improves discovery for complex traits. Nature. 2019;570(7762):514–518. [DOI] [PMC free article] [PubMed] [Google Scholar]
- 20.Armstrong K, Micco E, Carney A, Stopfer J, Putt M. Racial differences in the use of BRCA1/2 testing among women with a family history of breast or ovarian cancer. JAMA. 2005;293(14):1729–36. [DOI] [PubMed] [Google Scholar]
- 21.Olaya W et al. Disparities in BRCA testing: when insurance coverage is not a barrier. Am J Surg. 2009;198(4):562–5. [DOI] [PubMed] [Google Scholar]
- 22.Slavin TP et al. Prospective Study of Cancer Genetic Variants: Variation in Rate of Reclassification by Ancestry. J Natl Cancer Inst. 2018;110(10):1059–1066. [DOI] [PMC free article] [PubMed] [Google Scholar]
- 23.Harris PA et al. Research electronic data capture (REDCap) - A metadata-driven methodology and workflow process for providing translational research informatics support. J of Biomed Inform. 2009;42(2):377–381. [DOI] [PMC free article] [PubMed] [Google Scholar]
- 24.Acevedo-Garcia D et al. The child opportunity index: improving collaboration between community development and public health. Health Aff (Millwood). 2014;33(11):1948–57. [DOI] [PubMed] [Google Scholar]
- 25.Clark MM et al. Meta-analysis of the diagnostic and clinical utility of genome and exome sequencing and chromosomal microarray in children with suspected genetic diseases. NPJ Genom Med. 2018;3:16. [DOI] [PMC free article] [PubMed] [Google Scholar]
- 26.Hussain SB, Quittner AL, Brown M, Li-Rosi AM. Understanding access to genomics in an ethnically diverse south Florida population: A comparison of demographics in odyssey and rapid whole genome sequencing programs. J Genet Couns. 2020;29(4):553–561. [DOI] [PubMed] [Google Scholar]
- 27.Walley NM et al. Characteristics of undiagnosed diseases network applicants: implications for referring providers. BMC Health Serv Res. 2018;18(1):652. [DOI] [PMC free article] [PubMed] [Google Scholar]
- 28.Pasquini TLS, Goff SL, Whitehill JM. Navigating the U.S. health insurance landscape for children with rare diseases: a qualitative study of parents’ experiences. Orphanet J Rare Dis. 15 2021;16(1):313. [DOI] [PMC free article] [PubMed] [Google Scholar]
- 29.Smith HS et al. Outcomes of prior authorization requests for genetic testing in outpatient pediatric genetics clinics. Genet Med. 2021;23(5):950–955. [DOI] [PubMed] [Google Scholar]
- 30.Monies D et al. The landscape of genetic diseases in Saudi Arabia based on the first 1000 diagnostic panels and exomes. Hum Genet. 2017;136(8):921–939. [DOI] [PMC free article] [PubMed] [Google Scholar]
- 31.Acevedo-Garcia D et al. Racial And Ethnic Inequities In Children’s Neighborhoods: Evidence From The New Child Opportunity Index 2.0. Health Aff (Millwood). Oct 2020;39(10):1693–1701 [DOI] [PubMed] [Google Scholar]
- 32.Manrai AK et al. Genetic Misdiagnoses and the Potential for Health Disparities. N Engl J Med. 2016;375(7):655–65. [DOI] [PMC free article] [PubMed] [Google Scholar]
- 33.Wojcik MH, Fraiman YS. Further Considerations on the Value of Whole-Genome Sequencing in Critically Ill Infants. JAMA Pediatr. Apr 1 2022;176(4):420–421. [DOI] [PMC free article] [PubMed] [Google Scholar]
Associated Data
This section collects any data citations, data availability statements, or supplementary materials included in this article.
Supplementary Materials
Data Availability Statement
To protect patient privacy, the dataset generated and analyzed during the current study may be available from the corresponding author on reasonable request contingent on a data use agreement.