

Abstract
Purpose:
Model constrained Reconstruction with Fourier-based Undersampling (MoReFUn) is introduced to accelerate the acquisition of dynamic magnetic resonance imaging using hyperpolarized [1-13C]-pyruvate.
Methods:
MoReFUn resolves spatial aliasing using constraints introduced by a pharmacokinetic model that describes the signal evolution of both pyruvate and lactate. Acceleration was evaluated on three single-channel datasets: a numerical digital phantom that used to validate the accuracy of reconstruction and model parameter restoration under various signal-to-noise and undersampling ratios, retrospectively and prospectively sampled data of an in vitro dynamic multispectral phantom, and retrospectively undersampled imaging data from a prostate cancer patient to test the fidelity of reconstructed metabolite time series.
Results:
All three datasets showed successful reconstruction using MoReFUn. In simulation and retrospective phantom data, the restored time series of pyruvate and lactate maintained image details, and the mean square residual error of the accelerated reconstruction increased only slightly (<10%) at reduction factor up to 8. In prostate data, the quantitative estimation of the conversion rate constant of pyruvate to lactate was achieved with high accuracy of less than 10% error at reduction factor of 2 compared to the conversion rate derived from unaccelerated data.
Conclusion:
MoReFUn can be used as an effective and reliable imaging acceleration method for metabolic imaging using hyperpolarized [1-13C]-pyruvate.
Keywords: Constrained Reconstruction, Hyperpolarized MR, Pyruvate, Undersampling, Pharmacokinetic Modeling
1. INTRODUCTION
Hyperpolarized (HP) MRI1 using [1-13C]-pyruvate is a minimally invasive imaging approach for measuring metabolic exchange2,3. The MRI signal of 13C-labeled substrates can achieve a >10,000-fold gain in signal intensity, compared to thermal equilibrium, through the process of dissolution dynamic nuclear polarization (dDNP).4 This large signal increase enables real-time measurement of metabolism. In particular, the conversion of HP [1-13C]-pyruvate to lactate is generally elevated in the setting of cancer, and has shown tremendous potential as a robust imaging biomarker for staging cancer4,5 and assessing tumor response to therapy6–8 as a relatively short acquisition that can be added to a conventional MRI exam.
However, HP MRI is technically challenging due to the transient and non-renewable HP signal. The signal is continuously lost via spin-lattice relaxation9 and depleted by radiofrequency excitations and chemical conversion to other metabolites. Despite dDNP providing a massive, yet transient signal increase, images of HP agents are still frequently limited by a low SNR and/or spatial resolution. Therefore, significant research has been focused on acceleration approaches to reduce the impact of excitation losses and preserve SNR. Parallel imaging10–13 and compressed sensing14–16 based approaches have been proposed for acquisitions with up to 6.6-fold acceleration in the spatial domain. The k-t (spatial-temporal) space undersampling approach achieved up to an 8-fold acceleration by targeting redundancy in the spatial and temporal domains.17,18 Although effective in specific applications, these approaches rely on the employment of multi-channel coils or fully sampled center k-space for training that compromises the actual acceleration ratio. These requirements can be challenging for HP imaging due to the limited signal acquisition window, restrictions on receiver coil size, or small matrix size in clinical setup. Therefore, alternative acquisition strategies for HP MRI are needed.
Model-based constrained reconstruction, which depicts the signal evolution in a controlled manner, is a specialized algorithm suitable for HP [1-13C]-pyruvate imaging. The dynamic signal evolution of perfused HP substrates in vivo can be modeled by compartmental exchange driven by a vascular input function (VIF). The VIF can be measured or estimated, often in the form of a gamma variate function, and metabolic activity can be described by pharmacokinetic (PK) models.19–21 Model-based constraints can be incorporated to reconstruct full-resolution image series from undersampled data. Similar ideas have been employed in dynamic contrast-enhanced MRI studies at an in-plane acceleration ratio of as high as 100-fold at a sub-millimeter resolution, in which the unknowns of PK models were directly estimated by fitting a time series representing voxel intensities measured during intravenous administration of a gadolinium contrast agent.22–24 Unlike dynamic contrast-enhanced MRI that measures changes in signal due to enhanced longitudinal signal relaxation, HP [1-13C]-pyruvate MRI measures the distribution of pyruvate and its metabolic conversion to multiple biochemical endpoints. PK models for HP MRI have shown tremendous potential previously in the reconstruction of spatiotemporally undersampled dynamic spectroscopic images with radial encoding21.
In this study, we extend the model constraint into the construction of spatially undersampled data on a Cartesian grid. Model constrained Reconstruction with Fourier-based Undersampling (MoReFUn) encodes spatial information with additional encoding phases determined by a temporally varying Fourier-based spatial undersampling function. Reconstruction was implemented by an explicit estimation of parametric pharmacokinetic signal model images. We investigated two PK models to describe the dynamic signal profiles of multiple metabolites. The model-based constraint was used to accurately resolve aliased voxels with a modest SNR penalty. We demonstrate this technique in silico, in vitro, and in vivo in order to assess its performance.
2. THEORY
2.1. SPATIAL ENCODING USING MoReFUn
MoReFUn shares the same data sampling strategy as the classic k-t space encoding method UNFOLD25. For the conventional fully sampled HP MR imaging protocol, each metabolite is probed sequentially at each time point t = n × TR, (n= 0,1,2…N) using spectral-spatial excitations followed by an echo-planar imaging (EPI) readout26, and each acquisition fully samples k-space at the designated matrix size. The undersampling ratio, R, is defined as the ratio of the number of samples in the fully sampled matrix to the number of samples acquired in the under-sampled dataset. In the undersampled dataset, k-space is sampled by increasing the distance between acquired phase encoding steps by a factor of R, and the resultant under-sampled image encodes a reduced FOV (FOV/R) in the phase encode direction when compared to the full target FOV. Each set of under-sampled k-space data is acquired at an offset from the center of k-space in the phase encoding direction (kPE=0) by a factor of r∙ΔkPE, where r is an integer value that varies as a function of n, and ΔkPE is the distance between phase encoding lines in fully encoded k-space data of the full target FOV. The undersampling patterns in k-space for different metabolites are defined as the same for the simplicity of encoding in this manuscript, but they are subject to independent design.
After performing the Fourier transform, undersampled images are comprised of aliased voxel values, A, that represent a summation of true voxel values () whose phase is modulated by their position (m) and k-space offset (r). The selection of r should cover all k-space within R consecutive repetitions. For the simplicity of implementation, we define , which alternatives between and as the same values that m does in this manuscript. For the case of R=2, which is illustrated in Figure 1, r = (0, 1, 0, 1…). Two data points, and , which are FOV/2 away from each other in the image space will alias to the same image location. The relationship between aliased voxel values, A, and true voxel values, P, is generalized as
| (1) |
Where m indexes the position of voxels that are separated from the center of the FOV by . φ(m) stands for the original phase of each voxel from the full FOV. The phase of the time series for each metabolite at each voxel may be assumed to be constant over time with mild variations due to noise. The second phase term represents an additional temporally varying phase shift to each of the aliasing voxels due to the temporally varying gradient encoding.
Figure 1.
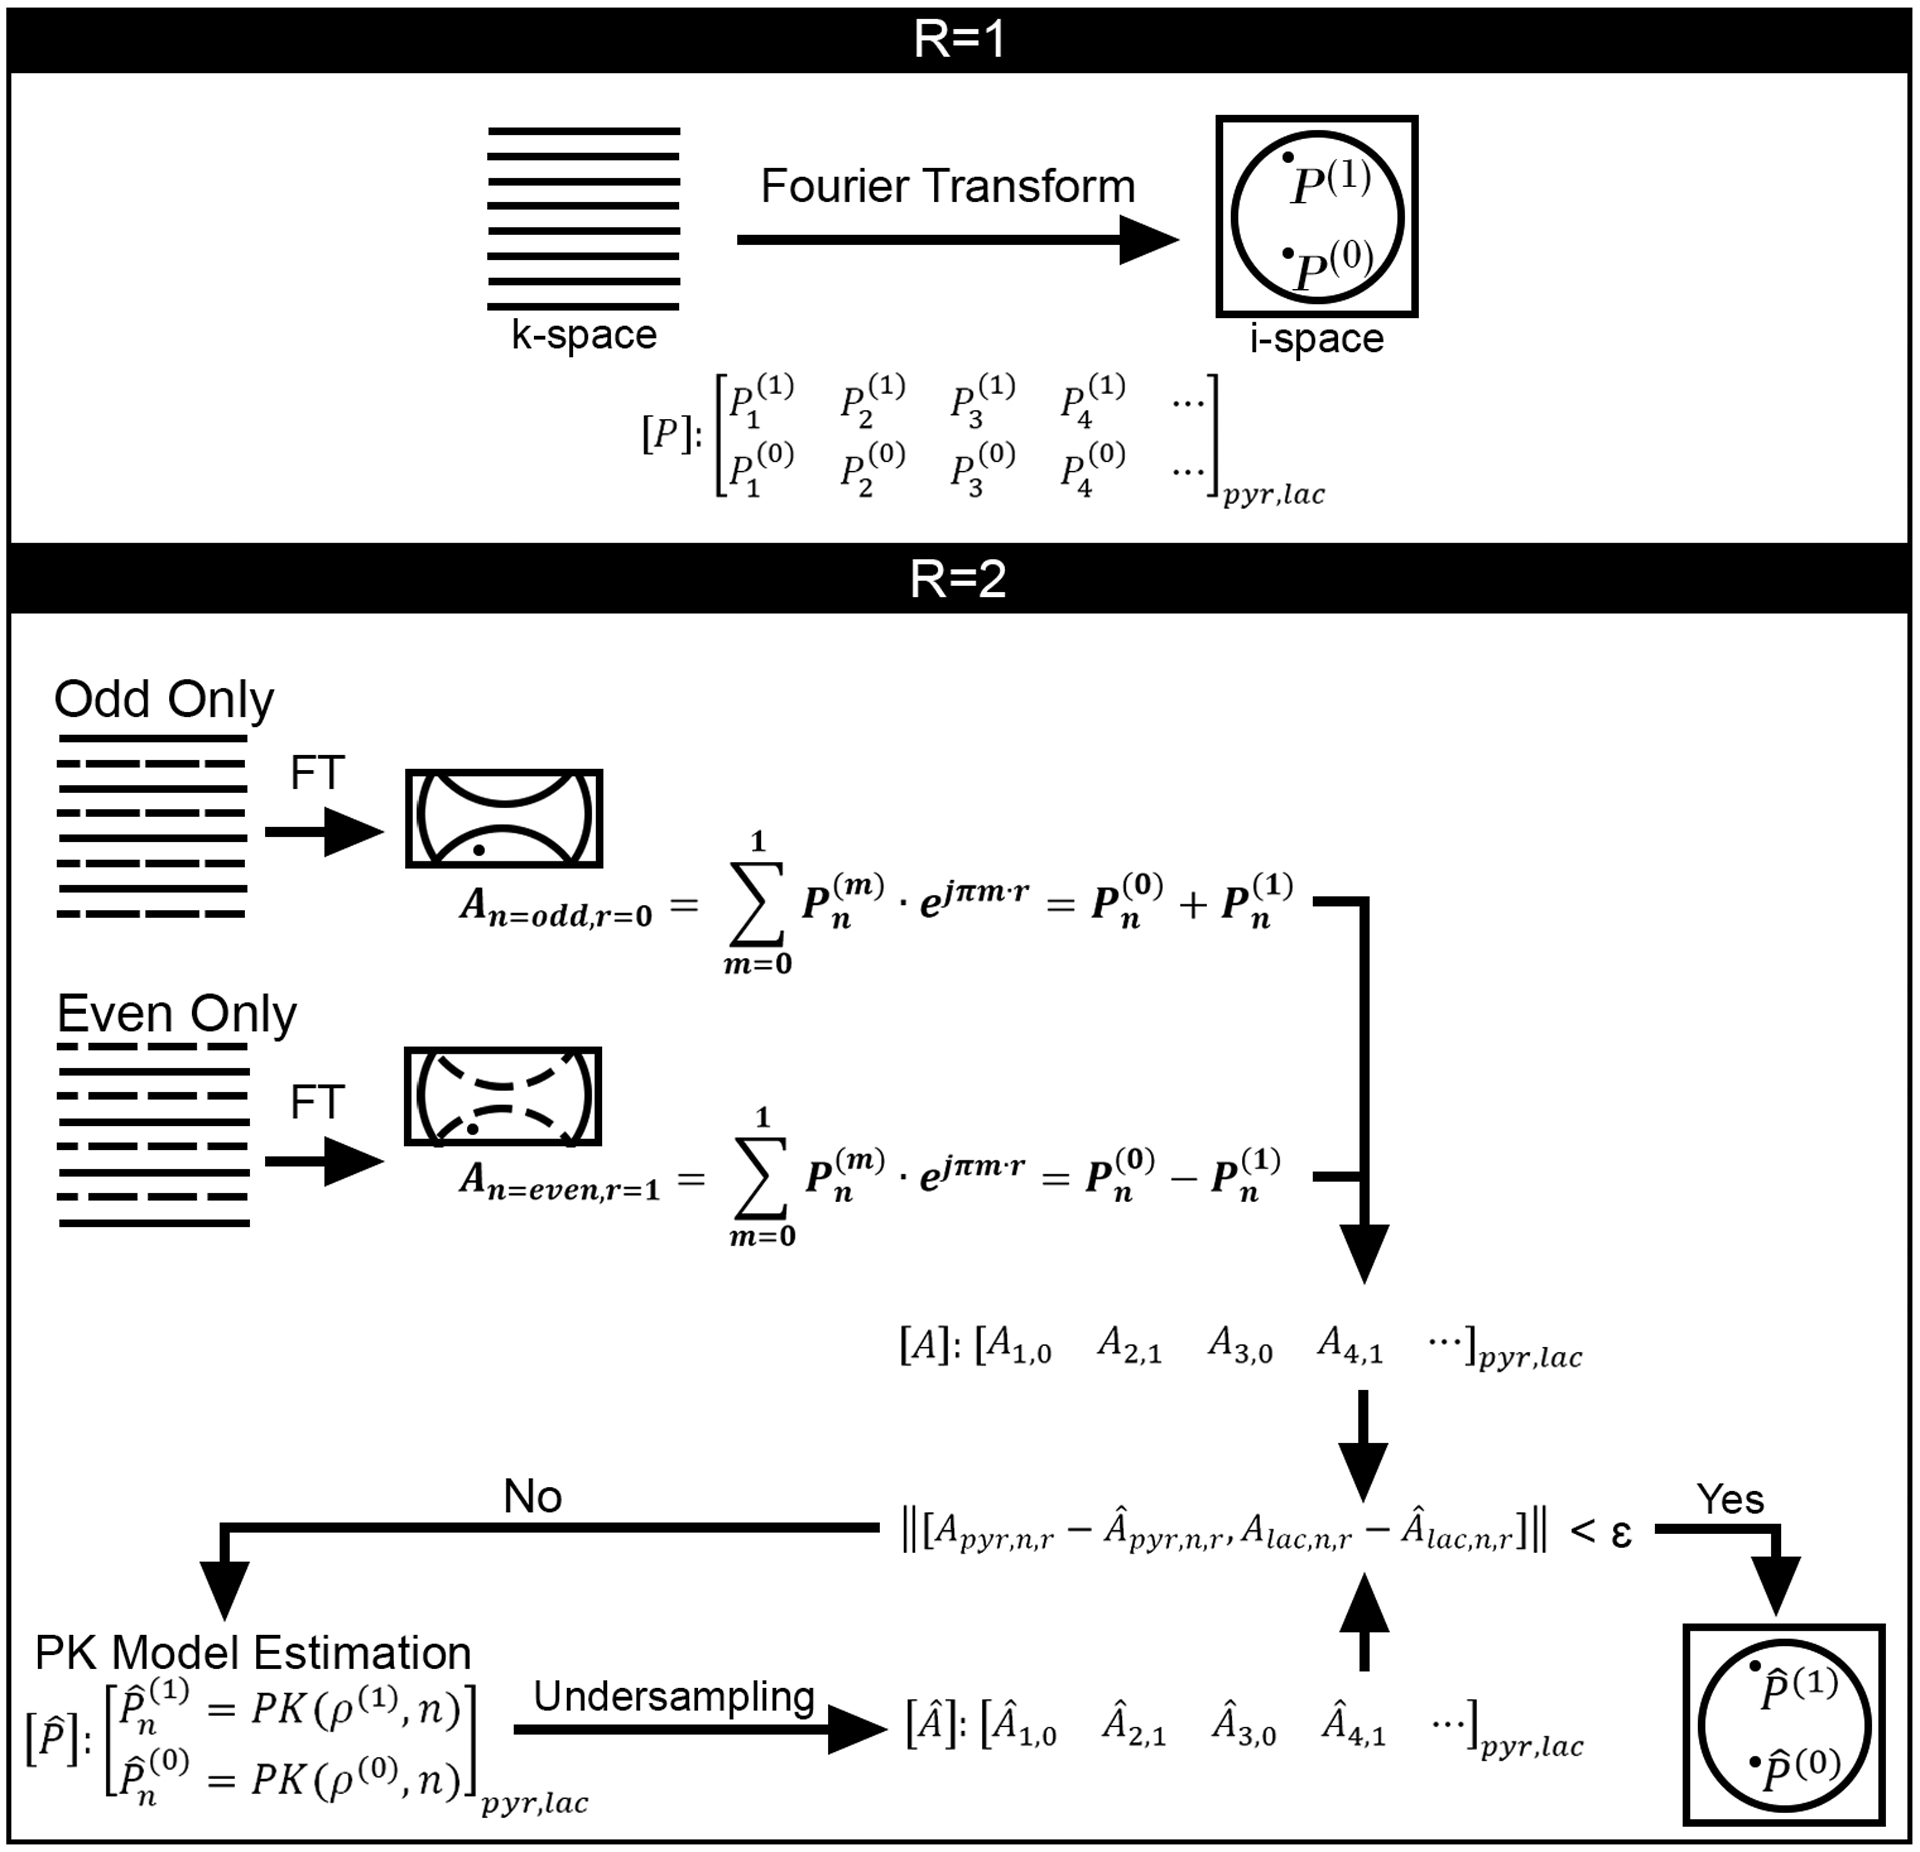
Data acquisition and constrained reconstruction scheme for MoReFUn. R stands for the undersampling ratio, P stands for the value of a voxel in the full FOV image, A stands for the value of an aliased pixel in the undersampled image with reduced FOV, A_cap is the estimated aliased pixel that is synthesized under the same undersampling scheme as A from the MoReFUN reconstructed image. ‘PK’ stands for the pharmacokinetic model as stated by equation 4,5 or equation 6–8 depends the application. ‘ρ’ stands for the parameter space (kPL, kve, vb, etc.) going to be estimated. ‘r’ defines the amount of k-space shift depending on undersampling pattern. The solid and dashed lines represent, respectively, the acquired and skipped phase steps in k-space. The k-space undersampling patterns vary over time, but are set as identical across pyruvate and lactate.
MoReFUn resolves the aliased time series by using spatial-temporal constraints provided by a PK model. Given a set of model parameters that describe signal evolution at each spatial location, the time series can be synthesized according to:
| (2) |
where ρ is the parameter vector of the underlying model (described in the following section 2.2) composed by l parameters (kPL, KVe, etc) for the time series at the target locations. All parameters are defined as real numbers (R) only in the model optimization; the phase of the complex input is co-estimated with the magnitude as described in Eq. [1]. The synthesized time series at n locations are aliased deliberately to subject to Eq. [1]. The reconstruction is iteratively optimized by minimizing the L2 norm between synthesized and sampled data An,r. Details of equation solver is presented in image reconstruction (section 3.4).
| (3) |
This process operates on N under-sampled complex images to generate a set of parameter values (l) for each voxel in the full target FOV, which can then be used to reconstruct signal intensity at the original temporal sampling scheme or at any arbitrary time.
2.2. PHARMACOKINETIC MODELING
Pharmacokinetic models have previously been introduced to describe the dynamic signal of HP pyruvate and its substrates21. In this study, we employed two models composed of two chemical pools (pyruvate and lactate) and one or more physical compartments to account for signal exchange under different conditions of mixture.
We have previously introduced a dynamic HP phantom system that contains HP pyruvate, lactate, and coenzymes (LDH, NADH) that mediate the conversion of HP pyruvate into lactate27. This phantom represents a closed system, and signal from this phantom will evolve according to:
| (4) |
| (5) |
This closed model (Eq. [4] and [5]) can be used to describe the longitudinal signal evolution in a piecewise continuous manner that enforces excitation losses at the start of each TR period. Here, kPL is the apparent rate constant for conversion of HP pyruvate into lactate. R1,Pyr and R1,Lac reflect losses due to T1 relaxation for pyruvate and lactate, respectively.
In regards to in vivo applications, HP 13C MRI signal evolution can be described using a PK model with two spatial compartments (intravascular, extravascular) and two chemical pools (pyruvate, lactate)21,28–30. This two-compartment model is a simplification of a more physiologically accurate three-compartment model21, based on the assumption that the extravascular compartment represents a well-mixed combination of intracellular space in rapid equilibrium with interstitial space. The chemical conversion of pyruvate into lactate is confined to the extravascular compartment and pyruvate exchanges between the two physical compartments according to the extravasation rate (kve). The apparent rate constant for chemical conversion in the mixed extravascular space is denoted by . The VIF for pyruvate is denoted as Pyriv(t), and it is assumed that HP lactate is not carried into tissue through vasculature (Laciv(t)=0). Here, reverse chemical conversion (kLP) is assumed to be negligible.
The total observed signal is the sum of individual physical compartments, weighted by their relative volume fractions (intravascular, vb; and extracellular ve = 1 − vb):
| (6) |
| (7) |
| (8) |
This model (Eq. [6]–[8]) serves as the basis for our in silico study using a numerical phantom composed of regions with distinct parameter sets, and the in vivo study using image data from a patient with prostate cancer.
These two models were selected because they have previously well described the metabolic reaction from pyruvate to lactate. We concentrate on the exchange rate between pyruvate and lactate because this is the primary interest in cancer imaging, but they can certainly be extended to include other chemical endpoints (such as bicarbonate) and corresponding rate constants.
3. METHODS
3.1. IN SILICO STUDY
A digital reference object (DRO1) was created to evaluate MoReFUn in resolving small and large features with various values, as shown in Figure 2a. The phantom (matrix size 16 × 16) was composed of four regions: two regions of interest (ROIs) with relatively high (0.06 s−1) in the center square and moderate (0.04 s−1) in the square at the bottom right corner; a larger square ROI with low (0.001–0.005 s−1), which simulated regions with low chemical exchange; and a background boundary-simulating region where no HP agent was expected. The kve (0.0066 s−1) and vb (0.037) maps remained constant for simplicity at regions with non-zero . This phantom was used to generate dynamic data according to the PK model with two spatial compartments (Eq. [6–8]) with parameters described below. T1 remained constant over all locations (T1,Pyr = 43s, T1,Lac = 33s). The excitation angle was set to 20° for both pyruvate and lactate over 60 repetitions with TR = 2s. P0 and L0 were set to zero at the start of the simulation for both metabolites. The shape of the VIF was defined by a gamma function (, with α = 2.8, β = 4.5).31,32 The time series from each voxel was assigned a phase that was constant over time but random across positions. Complex Gaussian white noise was added to the synthesized pyruvate and lactate time series at all locations in the Fourier transformed k-space to provide a maximum pyruvate SNR (max(pyr)/σ) of 30. The simulation was repeated 100 times with the same amount of noise variance.
Figure 2.

Parameter maps for the two-physical-compartment model and representative full resolution images. (a) Maps of primary parameters for the digital reference object. The map is comprised of boxed regions at relatively large (yellow), moderate (teal), and small (blue) values indicating tissue at different metabolic rates. The kve and vb maps are homogeneous for simplicity. (b) Noise-free pyruvate and lactate images from three time points.
A second DRO (DRO2) was created to test the reliability of the reconstruction in the presence of multiple similar overlapping signals. Measurements were repeated 1000 times with varying levels of maximum pyruvate SNR, ranging from 10 to 50. The target voxel was synthesized at various values (0.005–0.1 s−1); the aliasing voxels were set to cover the from 0.005 up to 0.2 s−1 that broader than the common measured value in vivo (Supporting Information Table S1). All other parameters remained constant for all voxels.
A thrid DRO (DRO3), similar to the DRO1, was created to compare the restruction accuracy and partial volume effect at different spatial resolutions. The highest spatial resolution DRO was designed with matrix size of 64×64, with map similar to DRO1 but included details (squares with low values inside the high greenish square at the center) at multiple sizes. The other model parameters (kve, vb, T1,P, T1,L, etc) were the same as those from DRO1. Noise was first added to the metabolite image series in spatial domain at peak pyruvate SNR=7.5, then lower spatial resolution(matrix size of 32×32 and 16×16) images was acquired by subsampling the center portion of highest spatial resolution in the Fourier transformed k-space at the ratio of matrix size of two resolutions. The effect of different TE was ignored for simplicity.
3.2. IN VITRO STUDY
Fully encoded HP MRI data from a dynamic HP phantom33 was retrospectively undersampled to evaluate MoReFUn. The phantom consisted of a 50 mL conical tube containing two 2mL vials submerged in relaxed water. One vial was prefilled with 1mL solution containing 40 U/mL LDH (Worthington Biomedical, Lakewood, NJ) and 10 mM NADH dissolved in TRIS buffer (both from Sigma Aldrich, St. Louis, MO), and the other vial was prefilled only with 1 mL of TRIS buffer. Next, 1 mL of HP [1-13C]-pyruvate was injected into both vials simultaneously, resulting in pyruvate signal in both vials but lactate signal only in the vial containing LDH. An echo-planar imaging sequence with spectral-spatial excitations (similar to reference26) was used for the dynamic acquisition of pyruvate and lactate images for 90 repetitions with TR/TE/echo spacing = 2000ms/14ms/1.152ms and 20° excitation angle on both metabolites. The acquisition used a 1cm-thick spectral-spatial excitation matched with single shot flyback EPI readouts encoding a 16×16 matrix over a 4×4 cm2 FOV. The imaging acquisition began prior to the HP agent injection and ran until the HP signal completely vanished. Images were acquired on a 7T small animal MRI system (Biospec 70/30 USR, Bruker Biospin MRI, Billerica, MA).
A prospective undersampling at R=2 was performed with the same phantom system27 and the same imaging setup (sequence, scanner) as the retrospective study listed above. The spatial resolution, TR, and number of repetitions were unchanged, but the halved k-space matrix resulted a shorter TE=9.6ms. The odd-only and even-only phase encoding steps were acquired at alternative TRs in the same way as previously introduced in section 2.1.
3.3. IN VIVO STUDY
Fully encoded HP MRI images from a patient with prostate cancer were retrospectively undersampled to evaluate clinical HP data using MoReFUn. Axial 13C images were acquired using a 2D multislice EPI sequence with singleband spectral-spatial excitations34,35 at metabolite-specific flip angles for the dynamic acquisition of pyruvate and lactate images. There were 21 repetitions in total with 2s temporal resolution and an excitation angle of 15° for pyruvate and 30° for lactate. The spatial resolution was 8mm isotropic (0.5 cm3) and the encoding matrix size was 16×16 across 16 slices. Proton images were collected within the same scanning session and coregistered as overlay reference. Anatomic T2-weighted fast spin echo proton images were had resolution of 0.35×0.35×3 mm and matrix size of 512×512. All images were acquired on a GE 3T MRI scanner. 13C imaging was performed using a Helmholtz-style 13C volume transmit “clamshell” coil (GE Healthcare) and a specialized dual-element 13C/1H endorectal receiver coil.36 The patient study followed IND/IRB approved protocol, and all data sharing were HIPAA-compliant.
3.4. IMAGE RECONSTRUCTION
Image reconstruction was implemented using MATLAB 2020b (MathWorks, Natick, MA, USA). Model parameters were estimated by solving equation [3] with nonlinear least square fitting (lsqnonlin) using a trust-region-reflective method37. The numerical optimization details and PK model constraints were listed in Supporting Information Table S2.
The two-compartment PK model was used to estimate aliased voxel values () and their signals were combined () using Eq. [6–8] for the DROs and the in vivo study. To facilitate parameter mapping, initial values were estimated by using temporally view-shared data describe as following. At undersampling ratio of R, undersampled data at consecutive R time points in image-space were corrected for longitudinal magnetization loss due to excitation and T1 relaxation effects, and combined in k-space to create a spatially fully sampled, but R-fold temporally undersampled data series for each metabolite. The view-shared data were interpolated back to the original temporal resolution. Next, the interpolated data were used to estimate the initial values of the model parameters with MoReFUn in a voxelwise manner. In both the DRO study and prostate patient study, , kve, vb, VIF scaling factor, φPyr, and φLac were estimating parameters of the two-compartment model. In the prostate patient study, Pyr0 and Lac0 were also set as unknown to account for potential non-zero HP metabolite signal present at the start of the acquisition.
The closed model (Eq. [4] and [5]) was used to estimate dynamic aliased voxel values from the LDH phantom. The model constraints were separated into two temporal segments to account for absence of chemical exchange after consumption of NADH. The first segment was set from the beginning until the time point when the peak lactate magnitude was achieved at the aliased time series to describe the period that the signal evolution was driven by pyruvate-lactate pool exchanging, T1 decay and excitation loss. The second segment described the signal evolution after the pool stopped exchanging, which was dominated by T1 decay and excitation losses only. The duration of the first segment was set individually at each spatial location to account for the inhomogeneous LDH/NADH distribution and HP pyruvate delivery within the phantom. The first segment took kPL and the initial values of pyruvate and lactate as the unknowns; the second segment assumed kPL = 0 but inherited other unknowns from the first segment through the remainder of the dynamic data.
4. RESULTS
4.1. NUMERICAL SIMULATIONS
MoReFUn successfully reconstructed full-resolution images from undersampled data with promising accuracy (Figure 3). When the fully sampled data (R = 1) from DRO1 were used as the input, MoReFUn reconstruction was effective as a denoising process by regressing the acquired data with PK model. For the displaying image at t=20s, for example, the regional SNR of the high region (center 7×7 square) was 28.2 for pyruvate and 3.8 for lactate in fully sampled raw images, but increased to 75.6 and 22.4, respectively, in MoReFUn R = 1 reconstructed images. The regional SNR was defined as the ratio of mean to standard deviation of values from voxels in the homogeneous region. The root-mean-square-error (RMSE) of the pyruvate images over all spatial locations was 0.8 % with respect to noise-free images. The RMSE of the lactate images was 1.6 %, which was a result of the lower SNR of lactate compared to pyruvate. When R = 2, the RMSE of pyruvate and lactate increased to 1.0% and 2.2%, respectively. The RMSE further increased moderately at R = 4, and 8.
Figure 3.

PK model parameter rate map estimation from MoReFUn reconstructed data. The peak pyruvate tSNR of the raw data was 30. Measurement was made over 100 runs. The mean of estimated kPL maps accurately reflected the ground truth (figure 2a). The medians of the standard deviation (SD) of the estimated kPL were 4.4% and 5.5% for the high kPL region (center square) and the moderate kPL region (bottom right square) when the undersample ratio R = 1, 6.1% and 8.1% when R = 2, 7.4% and 9.9% when R = 4, 9.9% and 12.8 when R = 8. The arrows and crosses indicate voxels at the same location from different image modalities, whose time series are shown in Figure 4. Similar with kPL estimation, kve (medians of SD = 2.8%, 3.9%, 4.8%, 6.3% at R=1,2,4,8, respectively) and vb (medians of SD = 4.3%, 6.1%, 7.5%, 10.5% at R=1,2,4,8, respectively) maps were also accurately mapped.
The time series from selected voxels (indicated by arrows in Figure 3) are shown in Figure 4. When R = 2, the aliased time series of pyruvate presented a fluctuating pattern as a result of summation (n = even, r=0) or subtraction (n = odd, r=1) of the pyruvate time series voxel () and the paired voxels (). When R = 4, and 8, the aliased time series reflect complex phase combinations that vary with time. Under all acceleration ratios, the reconstructed time series matched the ground truth with modest deviation.
Figure 4.
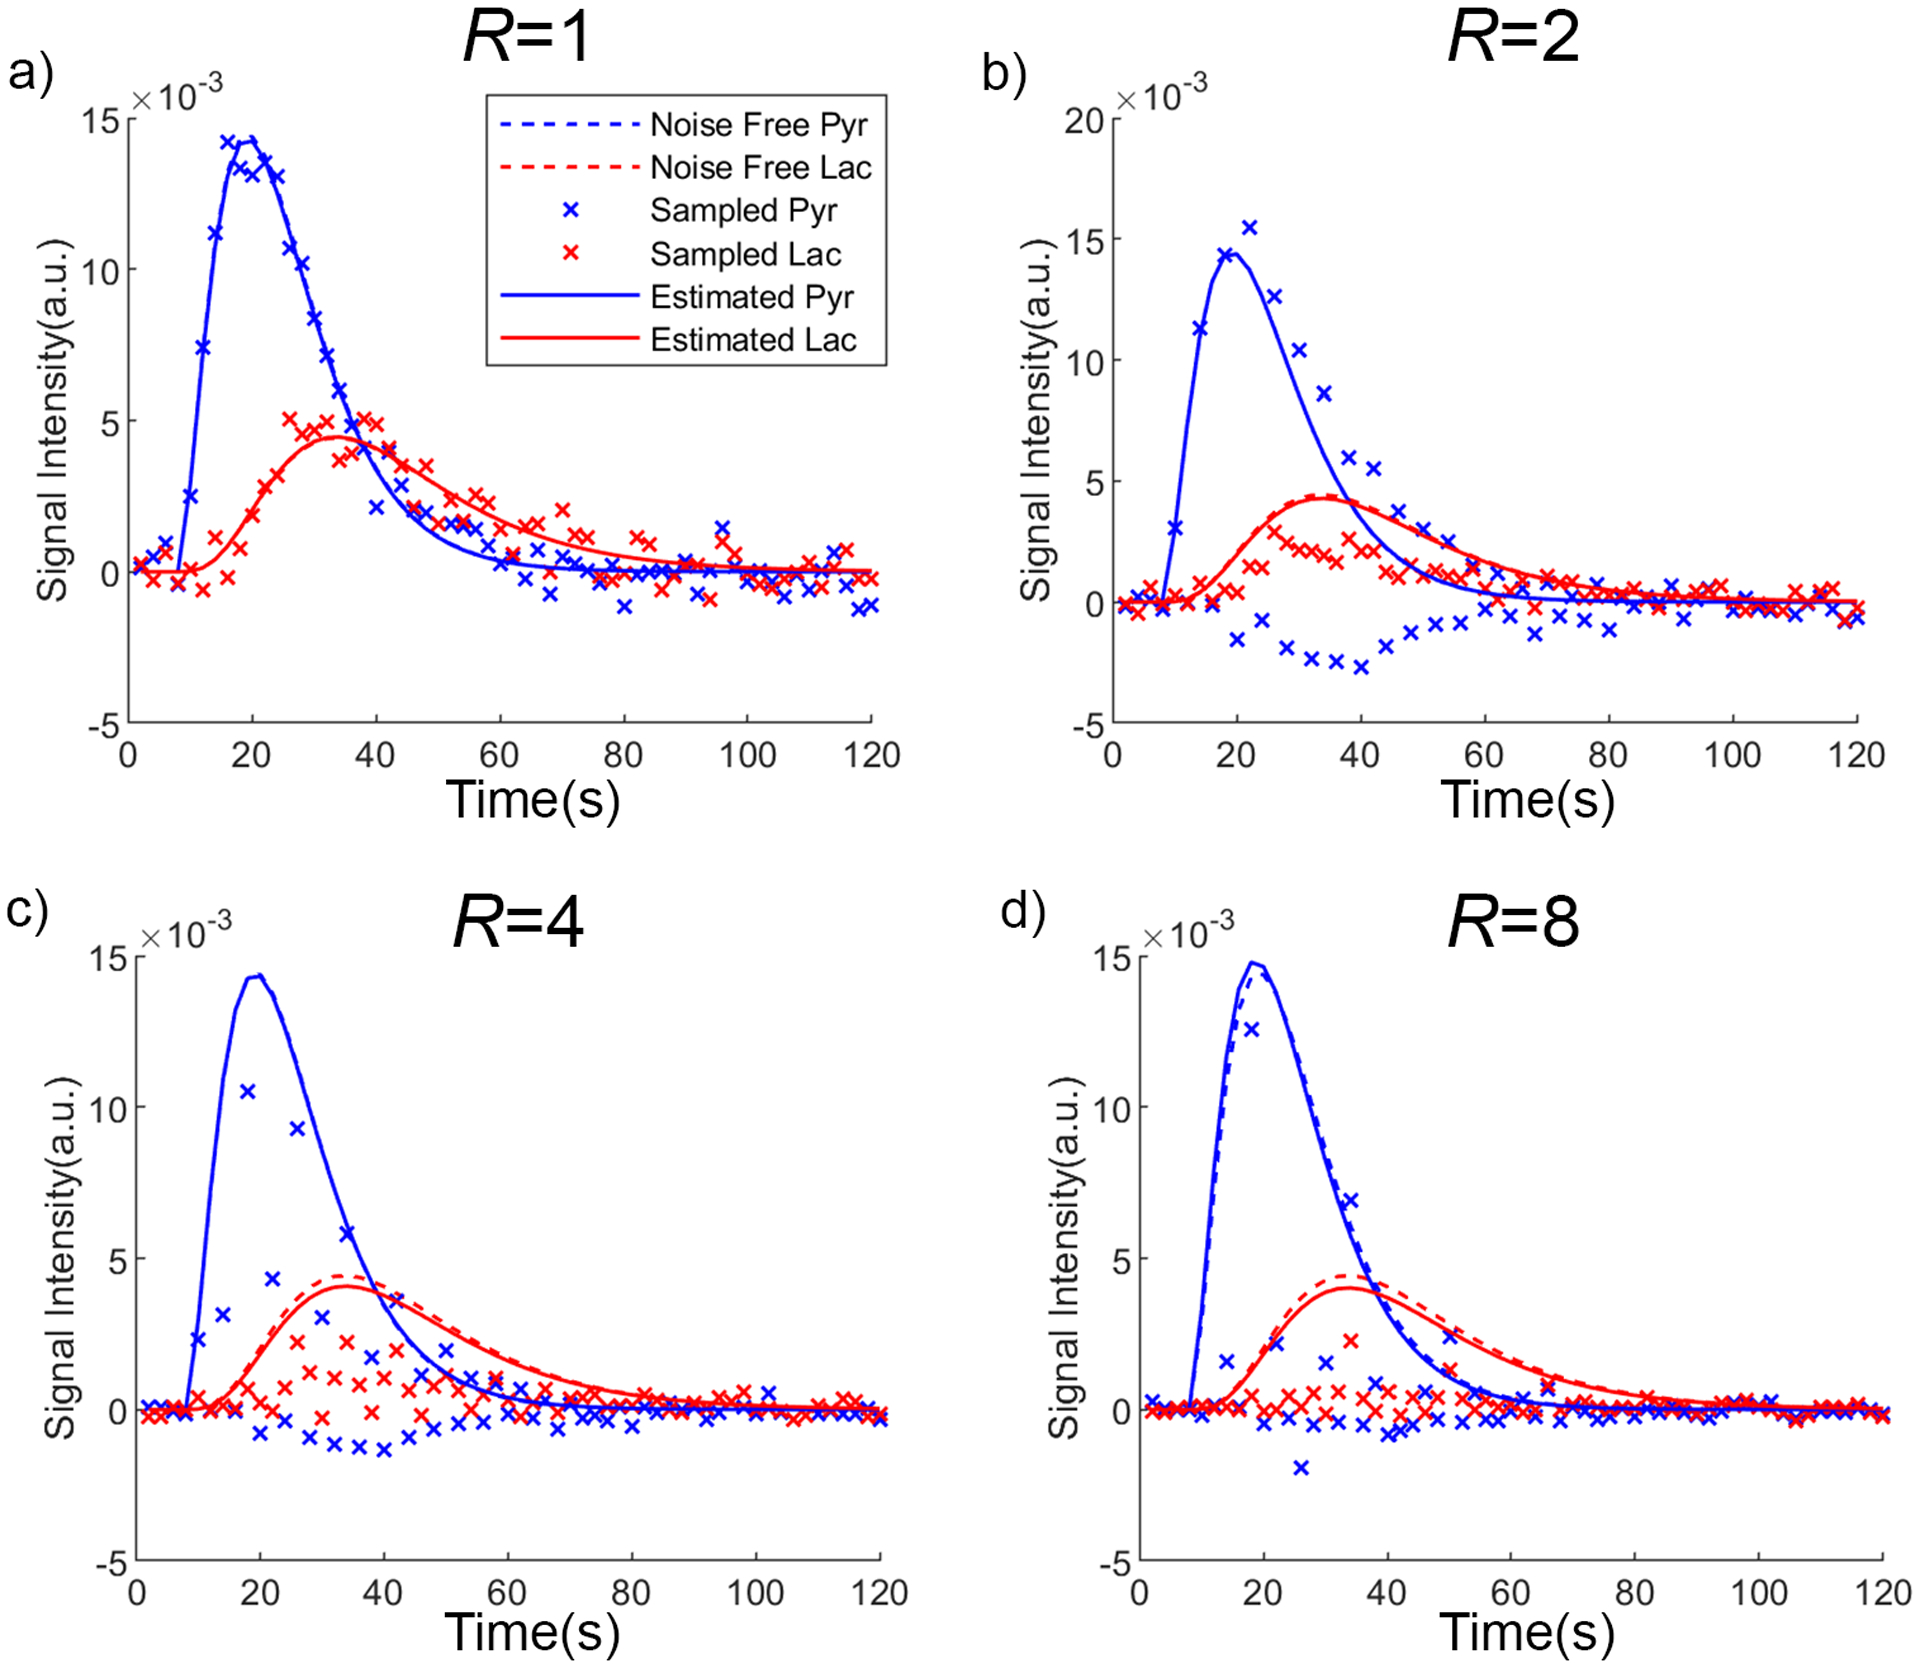
The time series at the same voxel location with different undersampling rates. Only the real components from phase corrected time series are displayed. (a) The fully sampled metabolite series (‘x’) at peak pyruvate SNR = 30 fluctuates along the noise-free series (dashed lines), while the estimated series (solid) from pharmacokinetic model matches the noise-free series with a slight offset. (b) The undersampled pyruvate series with undersample ratio R = 2 (blue ‘x’) fluctuates dramatically around the noise-free series (dashed lines), and the lactate series (red ‘x’) is severely deviated, but the MoReFUn restored series (solid) matches the noise-free series with only a moderate offset. (c,d) The undersampled data and the MoReFUn reconstructed data at R = 4, and R = 8 respectively.
PK model parameters were estimated by MoReFUn while the full-resolution image series were simultaneously synthesized. As a result, the parameter accuracy also served as an evaluation index of the reconstruction performance. The estimated maps over 100 runs at a max pyruvate SNR of 30 are shown in Figure 3(b,d,f,h). No significant differences in the mean maps were observed across different R values. The median standard deviations of the estimated high (0.06 s−1) region were only 4.4%, 6.2%, 7.3%, and 9.9%, of the nominal value at R = 1, 2, 4, and 8, respectively.
The quantitative estimation of was accurate under certain limits, as shown in Figure 5 (using DRO2). Both high and high SNR directly improved the accuracy as a result of the improved lactate signal. When was as low as 0.02 s−1, the minimal peak pyruvate SNR needed to reach an estimation of with promising accuracy (both fractional error mean and SD < 10%) from undersampled data at R = 2 was 30, while the minimal peak SNR for raw pyruvate was 20 for a of 0.1 s−1 to achieve the same performance. When R = 4 and R = 8, the error only moderately increased.
Figure 5.

Estimation accuracy of estimation from MoReFUn reconstructed images of undersampled images at R = 2, R = 4, and R = 8 at peak pyruvate SNR ranging from 10 – 50. Estimation RMSE and SD is over 1000 runs. The reliable estimation, defined as the relative RMSE and standard deviation, both are less than 10% from the actual kPL and labeled with dots in the above bar graph of the corresponding R.
The result of simulation using DRO3 was shown in Figure 6. The measured peak pyruvate SNR (7.2, 14.7, 29.7) at 64×64, 32×32, and 16×16 matrix size matched SNR in theory (7.5, 15, 30). At each resolution, the estimated map accuracy was evaluated by two matrices: 1) RMSE(highRes), interpolated then or directly referenced with the ground truth map composed at highest resolution; 2) RMSE(NsFree), referenced with the estimated map at the same resolution but noise-free time series. RMSE(highRes) is dominated by partial volume. When matrix size decreased from 64×64 to 32×32 and 16×16, the RMSE(highRes) of noise free map(2nd column from the left) increased from 0 to 16.4% and 35.8%. When R=1, RMSE(highRes) was 16.7%, 25% and 36% respectively: lower SNR at higher spatial resolution introduced relatively smaller error on top of that from partial volume. When R > 2, the RMSE(highRes) further increased. RMSE(NsFree), on the other hand, was primarily dominated by SNR. At R=1, the RMSE(NsFree) from matrix size of 64×64 was 16.7%, but decreased to 5.1% lowest resolution. But the coarse resolution clearly misinterpreted the details (vague boundaries between background and high voxels). The selection of RMSE or map reference is still an open topic. Here we recommend trading SNR for higher spatial resolution, and reducing acquisition time with MoReFUn, as this will result less RMSE(highRes) without increasing scan time. This could be an acceptable tradeoff and useful application for imaging with sufficient pyruvate and lactate SNR.
Figure 6.

The estimation of kPL from various spatial resolutions, using DRO 3. This new DRO was designed with map including details at multiple level(high : at the center region, medium : at the right bottom region), and homogeneous kve (=0.0066) and vb (=0.037) maps for simplicity (left column). The other model parameters (T1,P, T1,L, flip angle, kve, vb VIF profile) were the same as those from original DRO introduced in the method section 3.1,. The images with highest spatial resolution was reconstructed at matrix size of 64×64 and pixelwise SNR=7.5. The time series were then spatially subsampled to matrix size of 32×32, 16×16. The low spatial resolution time series were then undersampled and reconstructed by MoReFUn (undersampling ratio R=1,2,4,8). RMSE was measured over the high region. RMSE(HighRes): first interpolated then or directly compared with the ground truth high resolution map (the top left image). RMSE(NsFree): measured with the map (the 2nd column from the left) at the same spatial resolution but noise-free time series.
4.2. LDH PHANTOM UNDERSAMPLING
In addition to simulation of the DRO, MoReFUn was also successfully implemented to reconstruct retrospectively undersampled data from a dynamic HP MRI phantom as shown in Figure 7. In the reference images, both pyruvate and lactate signals were observed in one vial, while only pyruvate signal was observed in the other vial. Retrospectively undersampled data was successfully reconstructed using MoReFUn with high fidelity. In the raw data, the peak SNR across all voxels within the vial that lactate signal was detected was 87±58 for pyruvate, and 34±19 for lactate. When the raw data was modeled using the fully sampled data (R = 1), the RMSE between the reconstructed signal and the raw signal over all the voxels within the vial mask was about 1% for both metabolites. When the undersampling factor R was increased to 2, 4, and 8, the reconstructed images still preserved image details, and their RMSEs were comparable to that of R = 1.
Figure 7.

MoReFUn reconstruction using retrospective LDH phantom data. (a) 1 ml of 20 mM HP [1-13C] pyruvate was simultaneously injected into a vial (left) prefilled with 1 ml solution containing LDH, NADH, and TRIS buffer, and a vial (right) prefilled with 1 ml TRIS buffer. (a) Raw images of the dynamic pyruvate and lactate from spectral-spatial selected flyback-EPI at t=12s, and auto-thresholded mask that calculated using lactate AUC map for RMSE measurement. (b) Estimated images using the full k-space. (c, d, e) MoReFUn reconstructed imaging from the undersampled k-space at acceleration ratios of R = 2, R = 4, and R = 8, respectively. Both pyruvate and lactate image series are self-normalized for displaying. (f) T1 reference image and the correlation between kpl maps estimated from different R values. Statistically significant correlation coefficient value (p<0.05) in the top left corner were colored in red. Arrows refer two representative voxels with low lactate SNR and large kve offset between R=1 and R=8. In the raw data, the peak SNR across all voxels within the vial that lactate signal was detected was 87±58 for pyruvate, and 34±19 for lactate. The large SNR variation resulted from the heterogeneous metabolite distribution following injection.
MoReFUn was successfully reconstructed prospectively fully sampled (R=1) and undersampled (R=2) images (Figure 8). This qualitatively demonstrated the feasibility of MoReFUn reconstruction. Measured from the slide-window composed images, the peak SNR were also calculated across all voxels within the vial that lactate signal was detected. The peak SNR is 25±12 and 25±7 for pyruvate and lactate, respectively.
Figure 8.
Prospective MoReFUn reconstruction at R=2. Using the same LDH phantom system as retrospective study (result in figure 6). Quantitative analysis was not performed due to the drastic inter-trial difference of the phantom system. The peak SNR is 25±12 and 25±7 for pyruvate and lactate.
4.3. RETROSPECTIVE UNDERSAMPLING OF DATA FROM A PATIENT WITH PROSTATE CANCER
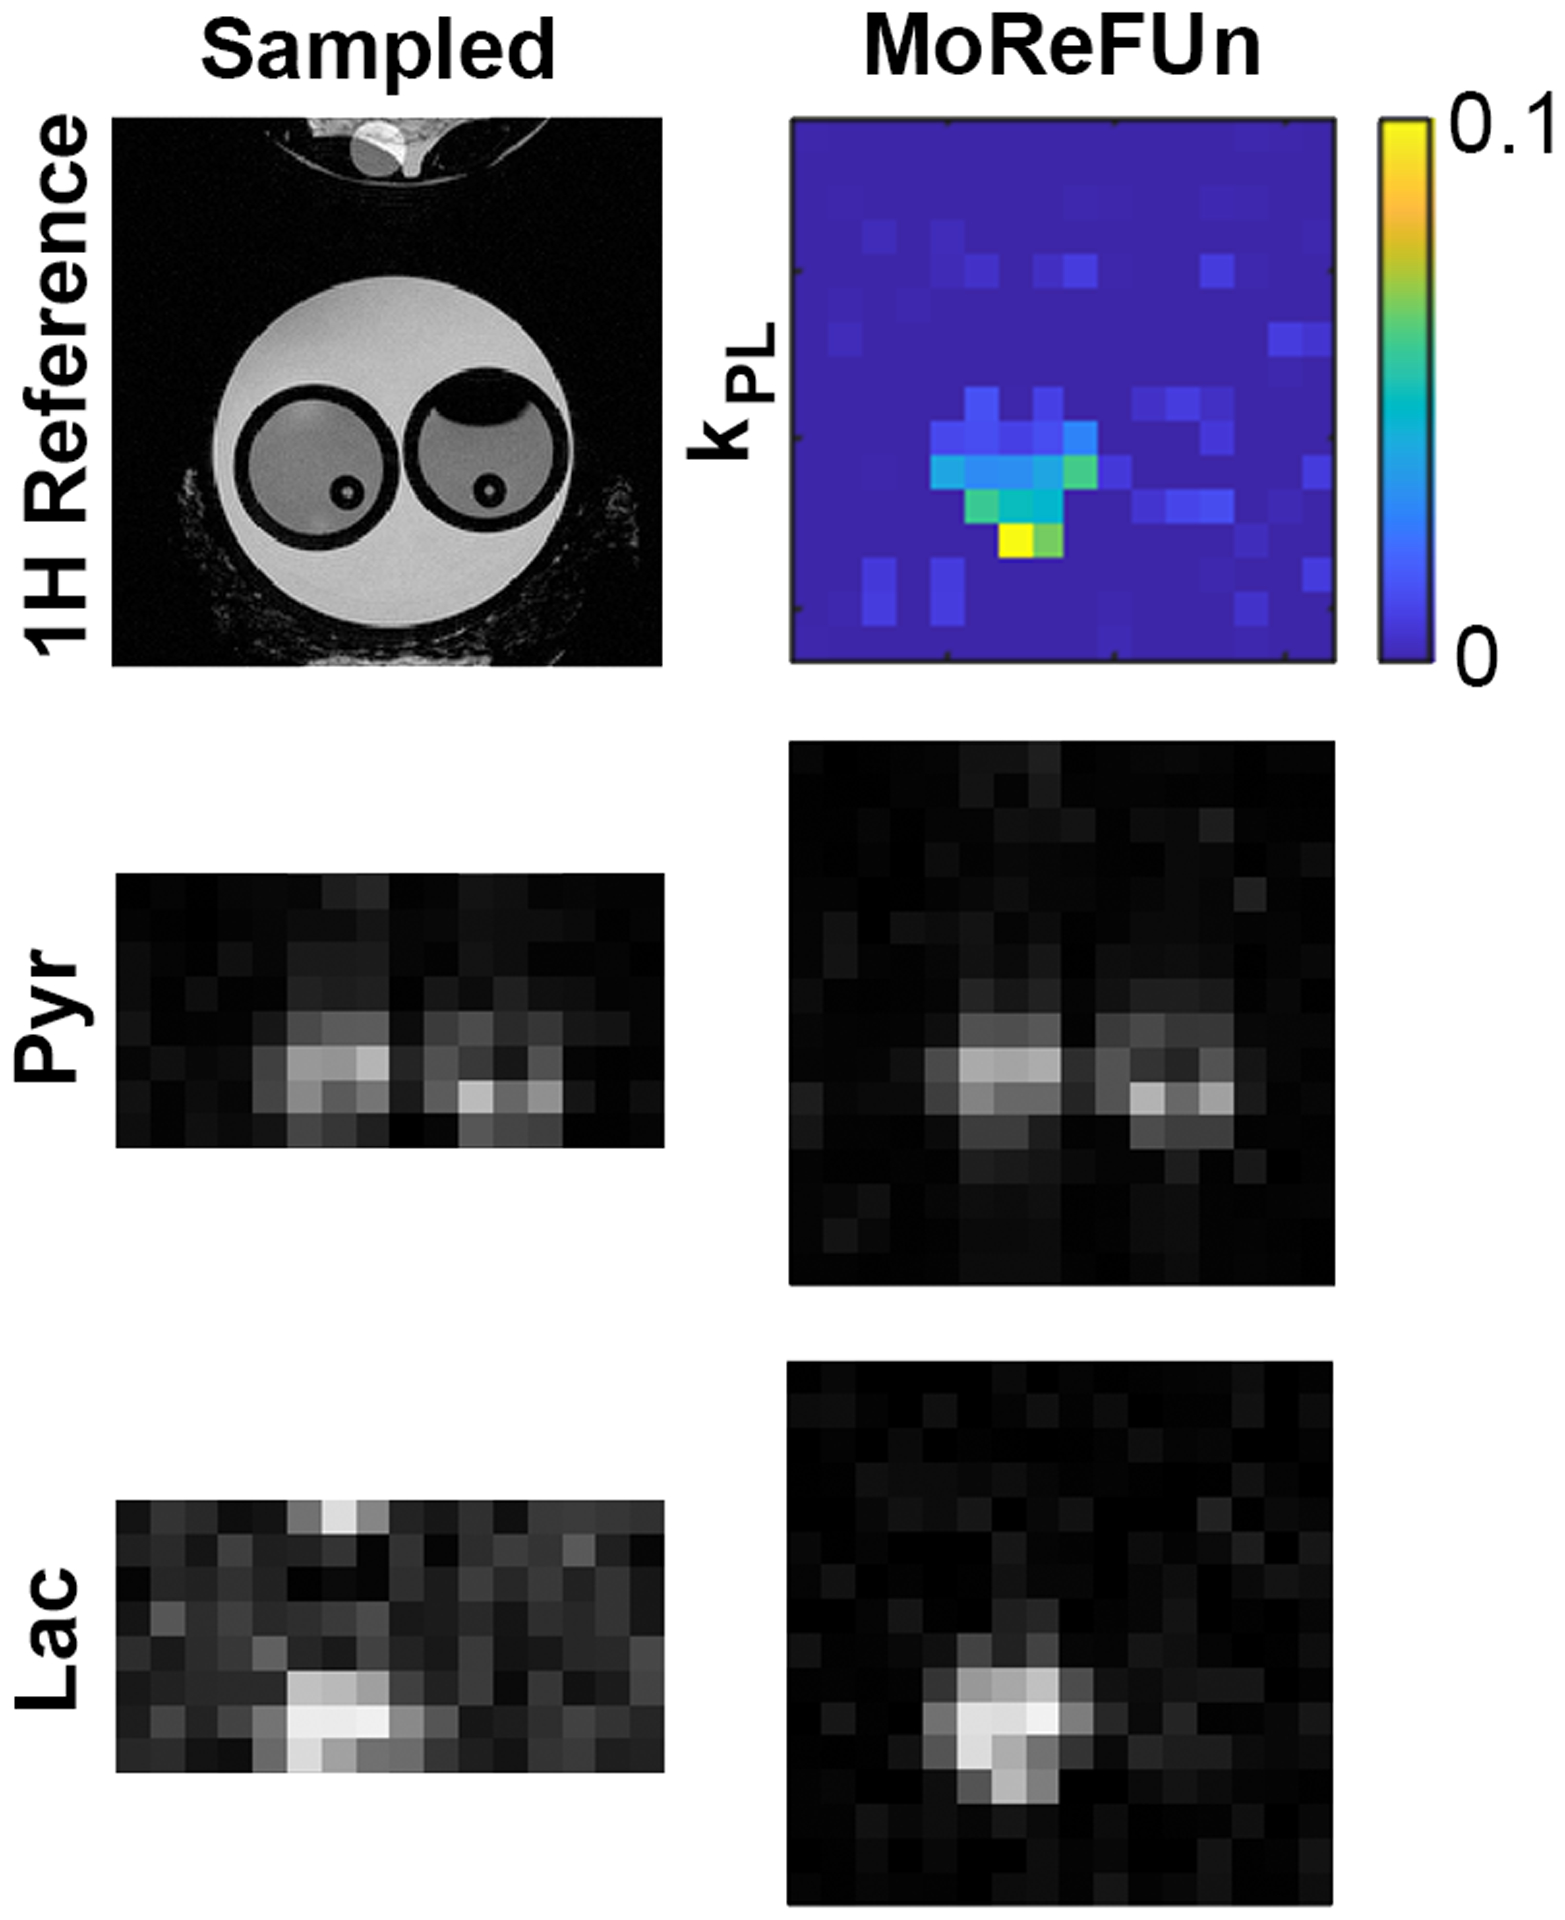
MoReFUn successfully reconstructed the retrospectively undersampled prostate 13C images, as shown in Figure 9. The restored pyruvate time series at R = 2 are visually indistinguishable from those with R = 1, and the high correlation(ρ) of 0.91 between their kPL map demonstrated the quantitative accuracy. As R increased to 8, the RMSE of both pyruvate and lactate image series were both slightly elevated, but the noisy background pixels became more noticeable and the estimated kPL map largely deviated from that estimated from R = 1. The peak SNR across all voxels was 11.3±3.6 for pyruvate, and 3.7±0.6 for lactate.
Figure 9.

MoReFUn reconstruction using a retrospectively undersampled in vivo prostate dataset. (a) Lactate area under the curve (AUC) map overlaid on the corresponding T2 anatomical reference. The FOV of the overlay was highlighted at the boundary voxels. The pyruvate AUC map, lactate AUC map, and the auto-thresholded RMSE mask based on the lactate AUC map were displayed at the corners. Only voxels within the mask were used for RMSE calculation and comparison of estimated kPL across different R values. (b) Raw images of the dynamic pyruvate and lactate at t = 20s. (c) Estimated images using MoReFUn with the full k-space. (d,f,g) reconstructed images by MoReFUN from the undersampled k-space at acceleration ratios of R = 2, 4, and 8. Both pyruvate and lactate images were self-normalized for displaying. The estimated kPL maps and their voxelwise comparison across different R factors were listed in (e); significant correlation coefficient (p < 0.01) that stated at the top-left corner were colored in red, while insignificant correlation coefficient (p > 0.05) were colored in black. The peak SNR across all voxels was 11.3±3.6 for pyruvate, and 3.7±0.6 for lactate.
5. DISCUSSION
MoReFUn is a reliable and accurate image acceleration approach for HP [1-13C] pyruvate imaging. By transferring information from the spatial to the temporal domain and sampling k-t space less densely, MoReFUn reduces the amount of data that must be acquired for image reconstruction. Baseline SNR of a given acquisition may be improved by sampling data at a lower bandwidth, or with a lower echo time. The model-based constraints resolve the spatially aliased time series by enforcing the known dynamic temporal relationship between HP pyruvate and its metabolites.
The biggest innovation of MoReFUn in this study is its incorporation of model constraints that permit the use of an effective Cartesian-based acceleration strategy. The SENSE38-like encoding pattern could be easily integrated into existing imaging sequences. The undersampling and encoding pattern in MoReFUn does not require reference scans or additional calibration data, resulting in identical nominal and effective acceleration ratios. In this study, we tested the reconstruction accuracy up to R = 8 for the small matrix size of 16-by-16. The reliability of MoReFUn at large spatial undersampling ratio requires further study at finer resolution with larger matrix sizes.
The performance of the MoReFUn reconstruction depends on the accuracy of the PK model and parameter estimates. In the LDH phantom imaging study, the closed system depicted signal evolution with and without active metabolic exchange over two temporal segments, and its fidelity was demonstrated by the small RMSE between the raw images and MoReFUn-reconstructed images. Similarly, in the DRO study using synthesized data with the two-compartment PK model, the decoding returned accurate parameter maps and image series. The in vivo data provided a challenging SNR, but the small RMSE of the reconstructed data, improved image quality, and robust measurement demonstrated the feasibility of the reconstruction method at R = 2. For studies designed to observe pyruvate downstream metabolites other than lactate, modified PK model should be applicable in theory, which will be validated in future to account for bicarbonate production in the heart39,40 or brain34 or alanine production for liver41 and pancreatic studies.42
The performance of MoReFUn also depends on the degrees of freedom in the model. In this study, the estimation of model parameters was reproducible by fitting only key parameters (such as kPL for the closed system, and kPL, kve, vb for the two-compartment model) as unknowns, whereas other parameters were assumed to be accurately known. By controlling all other parameters, a wide range of kPL values (as low as 0.005 s−1) were mapped with high accuracy. However, reproducibility is expected to worsen if more unknowns are included. Parameter mapping was also largely affected by the amount of unknowns to be estimated.28,43 This work was designed as a proof-of-concept for constrained reconstruction employing PK models; a more thorough evaluation of the model parameters and reconstruction reproducibility is underway.
In addition to noise and PK model accuracy, MoReFUn reconstructed images may be impaired by systematic errors, such as B1 miscalibration44, inhomogeneities28, excitation schemes29, etc. The related artifacts and distortion will have a similar negatively impact on MoReFUn as on full acquisition. Similar with SENSE and UNFOLD, MoReFUn is an image-space undersampling method in which the systematic error in the alised pixel value is govern by the cross-talk of equidistant pixels suffering from the localized distortion. Specifically, and φ(m) in equation [1] will be distorted but encoded into the mapped model and the error will be first pass to the PK model forwardly composed images (equation 2) then to the optimization formula (equation 3). Therefore, the reconstructed image will have similar appearance as the fully sampled images.
A conservative kPL evaluation threshold of 10% was set in simulation and the result suggested a reliable implementation of this approach only on studies that sufficient pyruvate SNR (>20) or kPL (>0.01) were expected. For data with poor observed SNR or low estimated kPL, MoReFUn will introduce noticeable error. One way to overcome this limitation, is to discarding voxels with SNR below empirical standard from clinical analysis, or applying additional constraints such as those could exploit the spatial correlation of PK model parameter maps43 or regularization45 to suppress noise into Eq. [3] to improve the reconstruction accuracy.
The future development of MoReFUn will require testing its compatibility with established techniques that could further improve reconstruction accuracy. MoReFUn is established to accelerate acquisition regardless of the coil geometry. In application using single element coils such as HP prostate imaging, the acceleration could be implemented exactly following Eq. [1]. In applications using phased array coils, future work is needed to develop methods for integrating MoReFUn with parallel imaging strategies11,38,46. Here, MoReFUn was demonstrated using spectral/spatial excitations with individual readout of each metabolite. This approach can also be used to reduce sampling requirements for multi-echo chemical shift decomposition.33,47
6. CONCLUSION
MoReFUn is a model-based constrained reconstruction algorithm that is specialized for dynamic HP [1-13C]-pyruvate imaging. By incorporating the unique spatial-temporal constraint provided by the PK model that mimics the metabolic activity associated with in vivo chemical exchange between pyruvate and its metabolites, this framework can be used to accelerate signal encoding and data sampling. Robust reconstruction accuracy was demonstrated under conditions of low SNR. This study demonstrates feasibility for the use of PK model constrained reconstruction and quantitative analysis of HP [1-13C] MRI data, while the quantitative accuracy and feasibility must be justified by future prospective/retrospective in vitro and in vivo studies.
Supplementary Material
Supplementary Information Table S1. value of target and aliasing voxels in DRO2.
Supplementary Information Table S2. Numerical details of reconstruction and model parameters constraint applied in this study.
ACKNOWLEDGMENTS
This research was funded in part by the National Institutes of Health (R01CA211150, U01EB026412, and P41EB013598) and GE Healthcare. The content is solely the responsibility of the authors and does not necessarily represent the views of its sponsors. We would also like to thank Amy Ninetto, Scientific Editor, Research Medical Library, MD Anderson Cancer Center, for help in preparing this manuscript.
Data availability
The Matlab scripts for the MoReFUn algorithm, and scripts used to carry out simulations with DROs can be accessed at https://github.com/mda-mrsl/MoReFUn. Imaging data and associated scripts will be shared upon request.
References:
- 1.Ardenkjaer-Larsen JH, Fridlund B, Gram A, et al. Increase in signal-to-noise ratio of > 10,000 times in liquid-state NMR. Proc Natl Acad Sci USA Sep 2 2003;100(18):10158–63. doi: 10.1073/pnas.1733835100. [DOI] [PMC free article] [PubMed] [Google Scholar]
- 2.Golman K, Zandt RI, Lerche M, Pehrson R, Ardenkjaer-Larsen JH. Metabolic imaging by hyperpolarized 13C magnetic resonance imaging for in vivo tumor diagnosis. Cancer Res. Nov 15 2006;66(22):10855–60. doi: 10.1158/0008-5472.CAN-06-2564. [DOI] [PubMed] [Google Scholar]
- 3.Day SE, Kettunen MI, Gallagher FA, et al. Detecting tumor response to treatment using hyperpolarized 13C magnetic resonance imaging and spectroscopy. Nat Med. Nov 2007;13(11):1382–7. doi: 10.1038/nm1650. [DOI] [PubMed] [Google Scholar]
- 4.Nelson SJ, Kurhanewicz J, Vigneron DB, et al. Metabolic imaging of patients with prostate cancer using hyperpolarized [1-(1)(3)C]pyruvate. Sci Transl Med. Aug 14 2013;5(198):198ra108. doi: 10.1126/scitranslmed.3006070. [DOI] [PMC free article] [PubMed] [Google Scholar]
- 5.Albers MJ, Bok R, Chen AP, et al. Hyperpolarized 13C lactate, pyruvate, and alanine: noninvasive biomarkers for prostate cancer detection and grading. Cancer Res. Oct 15 2008;68(20):8607–15. doi: 10.1158/0008-5472.CAN-08-0749. [DOI] [PMC free article] [PubMed] [Google Scholar]
- 6.Aggarwal R, Vigneron DB, Kurhanewicz J. Hyperpolarized 1-[(13)C]-Pyruvate Magnetic Resonance Imaging Detects an Early Metabolic Response to Androgen Ablation Therapy in Prostate Cancer. Eur Urol. Dec 2017;72(6):1028–1029. doi: 10.1016/j.eururo.2017.07.022. [DOI] [PMC free article] [PubMed] [Google Scholar]
- 7.Woitek R, McLean MA, Gill AB, et al. Hyperpolarized (13)C MRI of Tumor Metabolism Demonstrates Early Metabolic Response to Neoadjuvant Chemotherapy in Breast Cancer. Radiol Imaging Cancer. Jul 31 2020;2(4):e200017. doi: 10.1148/rycan.2020200017. [DOI] [PMC free article] [PubMed] [Google Scholar]
- 8.Miloushev VZ, Granlund KL, Boltyanskiy R, et al. Metabolic Imaging of the Human Brain with Hyperpolarized (13)C Pyruvate Demonstrates (13)C Lactate Production in Brain Tumor Patients. Cancer Res. Jul 15 2018;78(14):3755–3760. doi: 10.1158/0008-5472.CAN-18-0221. [DOI] [PMC free article] [PubMed] [Google Scholar]
- 9.Kazan SM, Reynolds S, Kennerley A, et al. Kinetic modeling of hyperpolarized (13)C pyruvate metabolism in tumors using a measured arterial input function. Magn Reson Med. Oct 2013;70(4):943–53. doi: 10.1002/mrm.24546. [DOI] [PubMed] [Google Scholar]
- 10.Shin PJ, Larson PE, Ohliger MA, et al. Calibrationless parallel imaging reconstruction based on structured low-rank matrix completion. Magn Reson Med. Oct 2014;72(4):959–70. doi: 10.1002/mrm.24997. [DOI] [PMC free article] [PubMed] [Google Scholar]
- 11.Arunachalam A, Whitt D, Fish K, et al. Accelerated spectroscopic imaging of hyperpolarized C-13 pyruvate using SENSE parallel imaging. NMR Biomed. Oct 2009;22(8):867–73. doi: 10.1002/nbm.1401. [DOI] [PubMed] [Google Scholar]
- 12.Gordon JW, Hansen RB, Shin PJ, Feng Y, Vigneron DB, Larson PEZ. 3D hyperpolarized C-13 EPI with calibrationless parallel imaging. J Magn Reson. Apr 2018;289:92–99. doi: 10.1016/j.jmr.2018.02.011. [DOI] [PMC free article] [PubMed] [Google Scholar]
- 13.Lau AZ, Lau JYC, Chen AP, Cunningham CH. Simultaneous multislice acquisition without trajectory modification for hyperpolarized (13) C experiments. Magn Reson Med. Oct 2018;80(4):1588–1594. doi: 10.1002/mrm.27136. [DOI] [PMC free article] [PubMed] [Google Scholar]
- 14.Chen HY, Larson PEZ, Gordon JW, et al. Technique development of 3D dynamic CS-EPSI for hyperpolarized (13) C pyruvate MR molecular imaging of human prostate cancer. Magn Reson Med. Nov 2018;80(5):2062–2072. doi: 10.1002/mrm.27179. [DOI] [PMC free article] [PubMed] [Google Scholar]
- 15.Cao P, Shin PJ, Park I, et al. Accelerated high-bandwidth MR spectroscopic imaging using compressed sensing. Magn Reson Med. Aug 2016;76(2):369–79. doi: 10.1002/mrm.26272. [DOI] [PMC free article] [PubMed] [Google Scholar]
- 16.Geraghty BJ, Lau JY, Chen AP, Cunningham CH. Accelerated 3D echo-planar imaging with compressed sensing for time-resolved hyperpolarized (13) C studies. Magn Reson Med. Feb 2017;77(2):538–546. doi: 10.1002/mrm.26125. [DOI] [PubMed] [Google Scholar]
- 17.Weiss K, Sigfridsson A, Wissmann L, et al. Accelerating hyperpolarized metabolic imaging of the heart by exploiting spatiotemporal correlations. NMR Biomed. Nov 2013;26(11):1380–6. doi: 10.1002/nbm.2963. [DOI] [PubMed] [Google Scholar]
- 18.Wespi P, Steinhauser J, Kwiatkowski G, Kozerke S. High-resolution hyperpolarized metabolic imaging of the rat heart using k-t PCA and k-t SPARSE. NMR Biomed. Feb 2018;31(2). doi: 10.1002/nbm.3876. [DOI] [PubMed] [Google Scholar]
- 19.Zierhut ML, Yen YF, Chen AP, et al. Kinetic modeling of hyperpolarized 13C1-pyruvate metabolism in normal rats and TRAMP mice. J Magn Reson. Jan 2010;202(1):85–92. doi: 10.1016/j.jmr.2009.10.003. [DOI] [PMC free article] [PubMed] [Google Scholar]
- 20.Harrison C, Yang C, Jindal A, et al. Comparison of kinetic models for analysis of pyruvate-to-lactate exchange by hyperpolarized 13 C NMR. NMR Biomed. Nov 2012;25(11):1286–94. doi: 10.1002/nbm.2801. [DOI] [PMC free article] [PubMed] [Google Scholar]
- 21.Bankson JA, Walker CM, Ramirez MS, et al. Kinetic Modeling and Constrained Reconstruction of Hyperpolarized [1–13C]-Pyruvate Offers Improved Metabolic Imaging of Tumors. Cancer Res. Nov 15 2015;75(22):4708–17. doi: 10.1158/0008-5472.CAN-15-0171. [DOI] [PMC free article] [PubMed] [Google Scholar]
- 22.Guo Y, Lingala SG, Zhu Y, Lebel RM, Nayak KS. Direct estimation of tracer-kinetic parameter maps from highly undersampled brain dynamic contrast enhanced MRI. Magn Reson Med. Oct 2017;78(4):1566–1578. doi: 10.1002/mrm.26540. [DOI] [PMC free article] [PubMed] [Google Scholar]
- 23.Bliesener Y, Lingala SG, Haldar JP, Nayak KS. Impact of (k,t) sampling on DCE MRI tracer kinetic parameter estimation in digital reference objects. Magn Reson Med. May 2020;83(5):1625–1639. doi: 10.1002/mrm.28024. [DOI] [PMC free article] [PubMed] [Google Scholar]
- 24.Lingala SG, Guo Y, Bliesener Y, et al. Tracer kinetic models as temporal constraints during brain tumor DCE-MRI reconstruction. Med Phys. Jan 2020;47(1):37–51. doi: 10.1002/mp.13885. [DOI] [PMC free article] [PubMed] [Google Scholar]
- 25.Madore B, Glover GH, Pelc NJ. Unaliasing by fourier-encoding the overlaps using the temporal dimension (UNFOLD), applied to cardiac imaging and fMRI. Magn Reson Med. Nov 1999;42(5):813–28. doi: . [DOI] [PubMed] [Google Scholar]
- 26.Gordon JW, Vigneron DB, Larson PE. Development of a symmetric echo planar imaging framework for clinical translation of rapid dynamic hyperpolarized (13) C imaging. Magn Reson Med. Feb 2017;77(2):826–832. doi: 10.1002/mrm.26123. [DOI] [PMC free article] [PubMed] [Google Scholar]
- 27.Walker CM, Lee J, Ramirez MS, Schellingerhout D, Millward S, Bankson JA. A catalyzing phantom for reproducible dynamic conversion of hyperpolarized [1-(1)(3)C]-pyruvate. PLoS One. 2013;8(8):e71274. doi: 10.1371/journal.pone.0071274. [DOI] [PMC free article] [PubMed] [Google Scholar]
- 28.Sun CY, Walker CM, Michel KA, Venkatesan AM, Lai SY, Bankson JA. Influence of parameter accuracy on pharmacokinetic analysis of hyperpolarized pyruvate. Magn Reson Med. Jun 2018;79(6):3239–3248. doi: 10.1002/mrm.26992. [DOI] [PMC free article] [PubMed] [Google Scholar]
- 29.Walker CM, Fuentes D, Larson PEZ, Kundra V, Vigneron DB, Bankson JA. Effects of excitation angle strategy on quantitative analysis of hyperpolarized pyruvate. Magn Reson Med. Jun 2019;81(6):3754–3762. doi: 10.1002/mrm.27687. [DOI] [PMC free article] [PubMed] [Google Scholar]
- 30.Walker CM, Gordon JW, Xu Z, et al. Slice profile effects on quantitative analysis of hyperpolarized pyruvate. NMR Biomed. Oct 2020;33(10):e4373. doi: 10.1002/nbm.4373. [DOI] [PMC free article] [PubMed] [Google Scholar]
- 31.Davenport R The derivation of the gamma-variate relationship for tracer dilution curves. J Nucl Med. Oct 1983;24(10):945–8. [PubMed] [Google Scholar]
- 32.Madsen MT. A simplified formulation of the gamma variate function. Phys Med Biol. 1992;37:1597–1600. doi: 10.1088/0031-9155/37/7/010. [DOI] [Google Scholar]
- 33.Michel KA, Ragavan M, Walker CM, Merritt ME, Lai SY, Bankson JA. Comparison of selective excitation and multi-echo chemical shift encoding for imaging of hyperpolarized [1-(13)C]pyruvate. J Magn Reson. Feb 3 2021;325:106927. doi: 10.1016/j.jmr.2021.106927. [DOI] [PMC free article] [PubMed] [Google Scholar]
- 34.Crane JC, Gordon JW, Chen HY, et al. Hyperpolarized (13) C MRI data acquisition and analysis in prostate and brain at University of California, San Francisco. NMR Biomed. May 2021;34(5):e4280. doi: 10.1002/nbm.4280. [DOI] [PMC free article] [PubMed] [Google Scholar]
- 35.Larson PEZ, Chen H-Y, Gordon JW, et al. Investigation of analysis methods for hyperpolarized 13C-pyruvate metabolic MRI in prostate cancer patients. NMR Biomed. 2018;31:e3997. doi: 10.1002/nbm.3997. [DOI] [PMC free article] [PubMed] [Google Scholar]
- 36.Gordon JW, Chen HY, Autry A, et al. Translation of Carbon-13 EPI for hyperpolarized MR molecular imaging of prostate and brain cancer patients. Magn Reson Med. Apr 2019;81(4):2702–2709. doi: 10.1002/mrm.27549. [DOI] [PMC free article] [PubMed] [Google Scholar]
- 37.Moré JJ, Sorensen DC. Computing a Trust Region Step. SIAM J Sci Comput. 1983;4(3):553–572. doi: 10.1137/0904038. [DOI] [Google Scholar]
- 38.Pruessmann KP, Weiger M, Scheidegger MB, Boesiger P. SENSE: sensitivity encoding for fast MRI. Magn Reson Med. Nov 1999;42(5):952–62. doi: . [DOI] [PubMed] [Google Scholar]
- 39.Lau AZ, Chen AP, Ghugre NR, et al. Rapid multislice imaging of hyperpolarized 13C pyruvate and bicarbonate in the heart. Magn Reson Med. Nov 2010;64(5):1323–31. doi: 10.1002/mrm.22525. [DOI] [PubMed] [Google Scholar]
- 40.Cunningham CH, Lau JY, Chen AP, et al. Hyperpolarized 13C Metabolic MRI of the Human Heart: Initial Experience. Circ Res. Nov 11 2016;119(11):1177–1182. doi: 10.1161/CIRCRESAHA.116.309769. [DOI] [PMC free article] [PubMed] [Google Scholar]
- 41.von Morze C, Reed G, Shin P, et al. Multi-band frequency encoding method for metabolic imaging with hyperpolarized [1-(13)C]pyruvate. J Magn Reson. Aug 2011;211(2):109–13. doi: 10.1016/j.jmr.2011.04.007. [DOI] [PMC free article] [PubMed] [Google Scholar]
- 42.Stodkilde-Jorgensen H, Laustsen C, Hansen ESS, et al. Pilot Study Experiences With Hyperpolarized [1-(13) C]pyruvate MRI in Pancreatic Cancer Patients. J Magn Reson Imaging. Mar 2020;51(3):961–963. doi: 10.1002/jmri.26888. [DOI] [PubMed] [Google Scholar]
- 43.Mammoli D, Carvajal L, Slater JB, et al. Kinetic Modeling of Hyperpolarized Carbon-13 Pyruvate Metabolism in the Human Brain. IEEE Trans Med Imaging. 2020;39:320–327. doi: 10.1109/TMI.2019.2926437. [DOI] [PMC free article] [PubMed] [Google Scholar]
- 44.Harlan CJ, Xu Z, Walker CM, Michel KA, Reed GD, Bankson JA. The effect of transmit B1 inhomogeneity on hyperpolarized [1-(13) C]-pyruvate metabolic MR imaging biomarkers. Med Phys. Sep 2021;48(9):4900–4908. doi: 10.1002/mp.15107. [DOI] [PMC free article] [PubMed] [Google Scholar]
- 45.Maidens J, Gordon JW, Chen H-Y, et al. Spatio-Temporally Constrained Reconstruction for Hyperpolarized Carbon-13 MRI Using Kinetic Models. IEEE Trans Med Imaging. 2018;37:2603–2612. doi: 10.1109/TMI.2018.2844246. [DOI] [PMC free article] [PubMed] [Google Scholar]
- 46.Griswold MA, Jakob PM, Heidemann RM, et al. Generalized autocalibrating partially parallel acquisitions (GRAPPA). Magn Reson Med. Jun 2002;47(6):1202–10. doi: 10.1002/mrm.10171. [DOI] [PubMed] [Google Scholar]
- 47.Reeder SB, Brittain JH, Grist TM, Yen YF. Least-squares chemical shift separation for (13)C metabolic imaging. J Magn Reson Imaging. Oct 2007;26(4):1145–52. doi: 10.1002/jmri.21089. [DOI] [PubMed] [Google Scholar]
Associated Data
This section collects any data citations, data availability statements, or supplementary materials included in this article.
Supplementary Materials
Supplementary Information Table S1. value of target and aliasing voxels in DRO2.
Supplementary Information Table S2. Numerical details of reconstruction and model parameters constraint applied in this study.
Data Availability Statement
The Matlab scripts for the MoReFUn algorithm, and scripts used to carry out simulations with DROs can be accessed at https://github.com/mda-mrsl/MoReFUn. Imaging data and associated scripts will be shared upon request.