

Abstract
Purpose:
Filter exchange imaging (FEXI) and diffusion time (t)-dependent diffusion kurtosis imaging (DKI(t)) are both sensitive to water exchange between tissue compartments. The restrictive effects of tissue microstructure, however, introduce bias to the exchange rate obtained by these two methods, as their interpretation conventionally rely on the Kärger model of barrier limited exchange between Gaussian compartments. Here we investigated whether FEXI and DKI(t) can provide comparable exchange rates in ex vivo mouse brains.
Methods:
FEXI and DKI(t) data were acquired from ex vivo mouse brains on a preclinical MRI system. Phase cycling and negative slice prewinder gradients were used to minimize the interferences from imaging gradients.
Results:
In the corpus callosum, apparent exchange rate (AXR) from FEXI correlated with the exchange rate (the inverse of exchange time, 1/τex) from DKI(t) along the radial direction. In comparison, discrepancies between FEXI and DKI(t) were found in the cortex due to low filter efficiency and confounding effects from tissue microstructure.
Conclusions:
The results suggest that FEXI and DKI(t) are sensitive to the same exchange processes in white matter when separated from restrictive effects of microstructure. The complex microstructure in gray matter, with potential exchange among multiple compartments and confounding effects of microstructure, still pose a challenge for FEXI and DKI(t).
1. Introduction
Water exchange between tissue compartments in the brain (e.g., the vascular, ventricular, extracellular, and intracellular spaces) is crucial for maintaining homeostasis (1,2). Water exchange involves both active and passive mechanisms (3) and is often affected by disease processes, such as acute cell swelling and eventual break-down of cell membranes after ischemic stroke (4). As a result, water exchange rates between brain tissue compartments are potential biomarkers for structural and functional deficits in the brain.
Non-invasive imaging of water exchange has been reported using PET and MRI (5–8), with MRI having several advantages over PET, including non-ionizing radiation, high spatial resolution, and multiple contrast mechanisms that are sensitive to water exchange. In particular, contrast enhanced MRI can examine exchange between the vascular and tissue spaces across the blood brain barrier (9,10). Measuring exchange in neuronal tissue behind the blood brain barrier, in comparison, is more challenging and must rely on intrinsic MR properties of tissue compartments. For example, myelin water exchange can be evaluated using techniques that exploit differences in relaxation and magnetization transfer (MT) properties between myelin and other compartments (11–13).
Diffusion MRI, commonly used for probing tissue microstructure, is also sensitive to water exchange between compartments. Based on a two-compartment Kärger model (14–16), measuring exchange between compartments with distinct diffusivities had been demonstrated using the constant gradient method, which collects data at multiple diffusion times with single diffusion encoding (SDE) (17–20). However, using this method, it is difficult to separate exchange between the distinct tissue compartments from the restrictive intra-compartmental effects of tissue microstructure, such as structural disorder (21–27). Incomplete coarse-graining (28) of structural disorder at finite diffusion time causes residual non-Gaussian diffusion in a given compartment, and leads to a dependence on the diffusion time of the diffusion coefficient and the intra-compartmental kurtosis, which are both beyond the Kärger model.
Diffusion time (t)-dependent diffusion kurtosis imaging, or DKI(t), measures signals at multiple diffusion times and gradient amplitudes, up to moderate diffusion weighting. In the absence of intra-compartmental microstructure effects, the decay of kurtosis with diffusion time reflects the effect of exchange between compartments. For neurites in the brain, such description was suggested based on the anisotropic Kärger model (27). In this picture, the coarse-graining over the microstructure in each compartment is deemed complete, such that the diffusion eigenvalues are asymptotically constant, and the intra-compartmental kurtosis vanishes. Hence, the measured diffusion time-dependent diffusivity, D(t), can help determine the suitability of the Kärger model for mapping exchange in a given tissue, with no apparent change in D(t) with t suggesting minimal involvement of microstructure and vice versa (Fig. 1 in (26)).
Fig. 1:
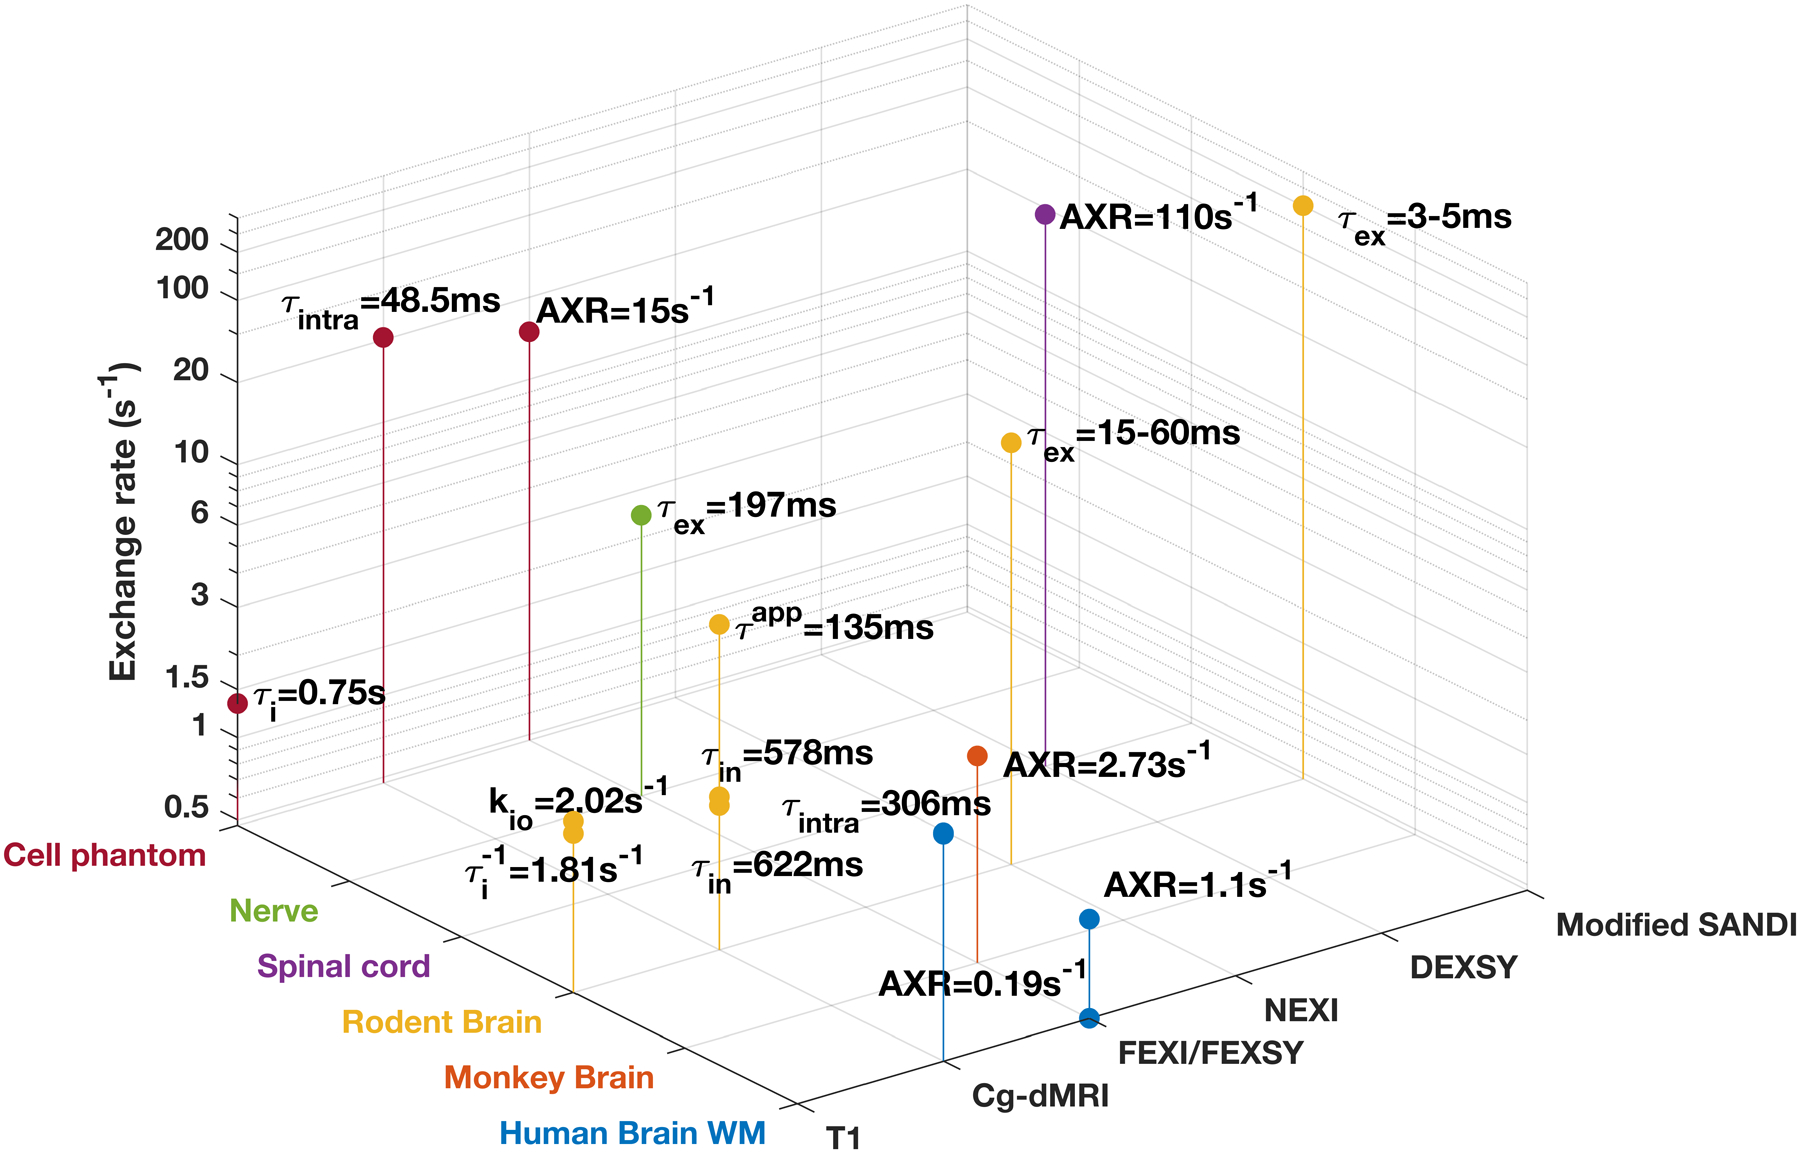
MRI-based estimates of water exchange rate from selected studies. The estimates were based on data acquired using a variety of methods, including T1-MRI (T1), constant gradient diffusion MRI (Cg-dMRI), FEXI, filter exchange NMR spectroscopy (FEXSY), neurite exchange imaging (NEXI), diffusion exchange spectroscopy (DEXSY), and modified soma and neurite density imaging (SANDI) model. The two horizontal axes are tissue category and acquisition methods. If only exchange time was reported, the value was converted to exchange rate by taking the inverse. Note the vertical axis of exchange rate is log-scaled. More details can be found in Supporting Information Table S1.
Filter exchange imaging (FEXI) was developed to measure exchange using a different approach (29–32). It uses two diffusion encoding blocks to target exchange between two compartments with different diffusivities. The first diffusion block acts as a filter to attenuate signals from spins in the fast diffusion compartment, and the second diffusion block, after a certain mixing period, detects signals from spins that migrate to the fast diffusion compartment. The separation of diffusion encoding blocks from the mixing period aims to separate exchange and restrictive effects from microstructure.
A wide range of MRI-based estimates of water exchanges in neuronal tissues can be found in the literature (Fig. 1), but evidence remains scarce whether different methods can produce comparable exchange measurements. Previously, Tian et al. (33) demonstrated good agreements between exchange measurements obtained using constant gradient SDE and FEXI in a non-imaging cell phantom experiment. In this study, we optimized FEXI and DKI(t) for preclinical MRI systems by minimizing the interferences of imaging gradients (34,35). We then compared FEXI and DKI(t) measurements of ex vivo mouse brains to investigate whether a similar agreement as in (33) can be found in brain tissue, which exhibits more complex microstructure than cell phantoms.
2. Theory
2.1: FEXI and DKI(t) within the 2-compartment Kärger model (KM):
Both FEXI and DKI(t) have been commonly applied within the 2-compartment KM, assuming that the exchange occurs between two Gaussian compartments (i.e., fast and slow diffusion compartments with full coarse-graining) and that exchange between the two compartments is barrier-limited. In FEXI, the recovery of diffusivity with increasing mixing times is modeled as
| Eq [1] |
where ADCeq is the apparent diffusion coefficient at equilibrium, σ is the filter efficiency, and AXR is the apparent exchange rate, as described in Lasic et al (32) and Nilsson et al (29). Within the 2-compartment KM, AXR = ksf + ksf = ksf / α (29), where ksf and ksf are the exchange rates between the slow (s) and fast (f) diffusion compartments and α is the volume fraction of the fast diffusion compartment. Note that ksf + ksf = ksf / α because the equilibrium condition in the 2-compartment KM implies (1 – α) ksf = αkfs.
For diffusion in realistic compartments mimicking tissue, t-dependent kurtosis, K(t), first increases with t and then decreases asymptotically. In DKI(t), the decay of kurtosis with t is modeled as
| Eq [2] |
where K0 is the initial kurtosis corresponding to the variance of the compartment diffusivities, and τex is the exchange time, defined as . Here, the use of Eq [2] is limited to the decaying part of the K(t) curve, i.e., for sufficiently long t (27). K0 is never attained practically, as the peak kurtosis (beyond which Eq [2] becomes applicable) is smaller than K0.
To account for the presence of more than two compartments (e.g., an immobile water or macroscopic partial-volume tissue components), the finite kurtosis asymptote K∞ at long diffusion times can be introduced in Eq [2], as described in (26), and Eq [2] becomes
| Eq [3] |
The asymptote K∞ is the measure of the variance of coarse-grained compartment diffusivities at t ≫ τex, i.e., when the exchange processes have played out but some non-exchanging compartments remain. K∞ = 0 under the 2-compartment KM assumptions.
Within the 2-compartment KM, we expect τex from DKI(t) to be the reciprocal of AXR from FEXI when acquired in the same experiment. However, any deviation from the KM assumptions will bias the exchange rate for both DKI(t) and FEXI, and these biases will, in general, be different. For FEXI, this is reflected in a simple exponential functional form of Eq [1] that neglects any power-law tails of the signal’s cumulants in each compartment due to the incomplete coarse-graining over the compartments’ microstructure (the breakdown of this assumption was recently discussed in (36); for DKI(t), Eqs [2]–[3] similarly neglect such effects, specifically assuming that all the t-dependence of kurtosis stems from the exchange. When other confounding factors (e.g. biases due to interferences of imaging gradients) can be minimized, the degree of disagreement between 1/τex and AXR, therefore, can serve as an indirect measure of the validity of KM’s assumptions (Gaussianity of diffusion in all compartments and the barrier-limited nature of exchange between them).
3. Methods:
3.1. Animals
All experimental procedures were approved by the Institutional Animal Care and Use Committee at New York University. Inbred BALB/cJ mice (Jackson Laboratories, 4 months old, female, n=7) were fixed by trans-cardiac perfusion of 4% paraformaldehyde in phosphate buffered saline (PBS) for ex vivo MRI. After fixation, mouse heads were removed and immersed in 4% PFA in PBS for 12 hours at 4°C before being transferred to PBS. The specimens were then kept in PBS (50 ml for each specimen) for 2 −3 weeks at 4°C to wash out residual fixatives, which reduce tissue T2 and the signal-to-noise ratio of the acquired images (37). Before ex vivo MRI, specimens were placed into 5 mL syringes, which were filled with Fomblin (Fomblin Profludropolyether, Ausimont, Thorofare, New Jersey, USA) for susceptibility matching and prevention of dehydration.
3.2. MRI acquisition
3.2.1: MRI equipment:
MRI experiments were performed on 7 Tesla preclinical MRI system (Biospec, Bruker Biospin, Billerica, MA, USA) equipped with an actively shielded gradient system (BGA 12s with a maximum gradient strength of 640 mT/m and a maximum slew rate of 3,440 T/m/s, Bruker Biospin, Billerica, MA, USA) and manufacturer provided console software Paravision 6.0. A volume coil (actively detuned, 72 mm inner diameter) was used for excitation, together with a 4-channel receive-only cryogenic coil. Both FEXI and DKI(t) experiments were performed at the room temperature.
3.2.2: Modified FEXI sequence:
The FEXI sequence used in this study was based on the sequence described in (38) using a pair of gradients with opposite polarities for filtering and detection (Fig. 2A). To counteract the effects of slice selection gradients, we used slice prewinder gradients with the opposite polarity and half the time integral of the slice selection gradients for the second and third 90-degree pulses (42) and a 4-step phase cycling for coherence pathway selection. Compared to the conventional FEXI sequence with two spin-echo diffusion encoding blocks (29), the FEXI sequence used here has less RF pulses, so that a simplified phase cycling scheme can be used, but is more susceptible than the conventional FEXI sequence to background gradient or concomitant field (39–41), which can be partially reduced with improved shimming.
Fig. 2.
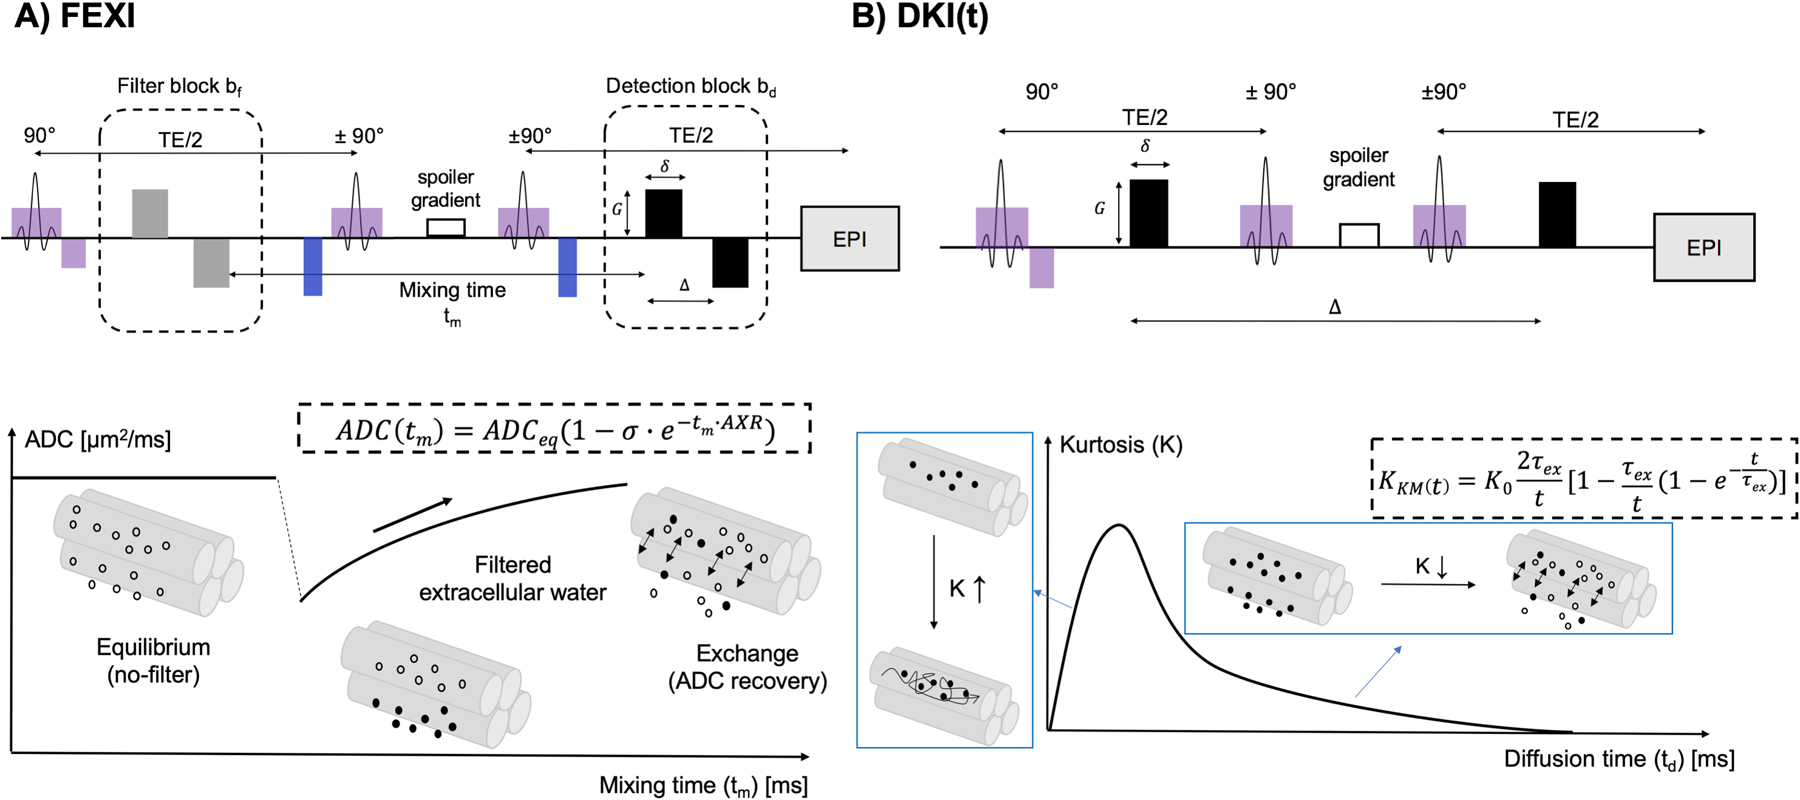
Pulse sequences and diffusion signal models of FEXI and DKI(t). A: FEXI uses a double diffusion encoding sequence with a filter block and a detection block separated by a mixing period. The filter gradient pair suppresses signals from compartments with high diffusivity (extracellular space in the diagram), causing reduced ADC, which recovers over the mixing time through transmembrane exchange. B: DKI(t) uses a conventional diffusion weighted stimulated echo EPI sequence. In the time-dependent kurtosis curve K(t), the initial increase reflects the intra-compartmental microstructural effects beyond the KM, whereas the later decrease reflects the exchange effects, together with the residual coarse-graining over each compartment’s microstructure. The KM applies only to the decreasing part of K(t) curve and attributes all of the kurtosis time dependence to exchange.
3.2.3: FEXI sequence testing:
To test whether phase cycling with slice prewinder gradients can reduce interferences of imaging gradients on FEXI measurements, we acquired FEXI data from an ex vivo mouse brain using the following parameters: matrix size = 128×80, repetition time (TR)/echo time (TE) = 2,000/45 ms, 4-step phase cycling with slice prewinder gradient set at negative values that compensated the slice selection gradients, 1-segment EPI acquisition, gradient pulse duration/separation = 6.5/2 ms, filter gradient applied along the rostral-caudal direction (perpendicular to the corpus callosum) with a filter diffusion weighting bf = 4 ms/μm2, detection gradient applied along 30 directions with a detection diffusion weighting bd = 3 ms/μm2, 8 mixing times (tm = 35, 50, 100, 150, 200, 250 and 300 ms), and 6 conditions: one sagittal slice with a slice thickness of 3 mm; two sagittal slices with a slice thickness of 1.5 mm; three sagittal slices with a slice thickness of 1 mm, either with positive crusher gradients (32 mT/m) or with negative slice prewinder gradients as described before. The equilibrium diffusivity was measured when the filter gradient was set to zero at the shortest mixing time of 35 ms. The three conditions covered the same amount of total imaging volume, and the multi-slice images acquired with the three-slice or two-slice settings were summed together for proper comparison with the one-slice setting. We also acquired images from a water phantom with the same range of mixing times (5–300 ms) but smaller filter gradient (bf = 0.1 ms/μm2). Both experiments were repeated 5 times.
3.2.4: FEXI experiments:
FEXI data were acquired using the same parameters described in the previous section with a 1.5 mm slice thickness and negative slice prewinder gradients, except that we acquired 3 slices and used 7 mixing times (tm = 5, 10, 15, 25, 45, 75, 105 ms) for measuring AXR. The imaging slices were placed along the mid-sagittal corpus callosum based on two-dimensional axial and sagittal T2-weighted images (Fig. 3A) acquired using a Rapid Acquisition with Relaxation Enhancement (RARE) sequence with the following parameters: TE/TR = 50/3,000 ms, an echo train length of 8, an in-plane resolution of 0.1 mm × 0.1 mm, and a slice thickness of 1 mm. The filter gradient strength was selected based on the signal attenuation curves shown in Fig. 3B. Fitting a two-pool model to the results showed a filter b-value of 4 ms/μm2 can effectively suppress signals from the fast diffusion pool (Dfast =1.40 ± 0.01 μm2/ms, volume fraction = 0.60 ± 0.002) compared to signals from the slow diffusion pool (Dslow = 0.16 ± 0.01μm2/ms).
Fig. 3.
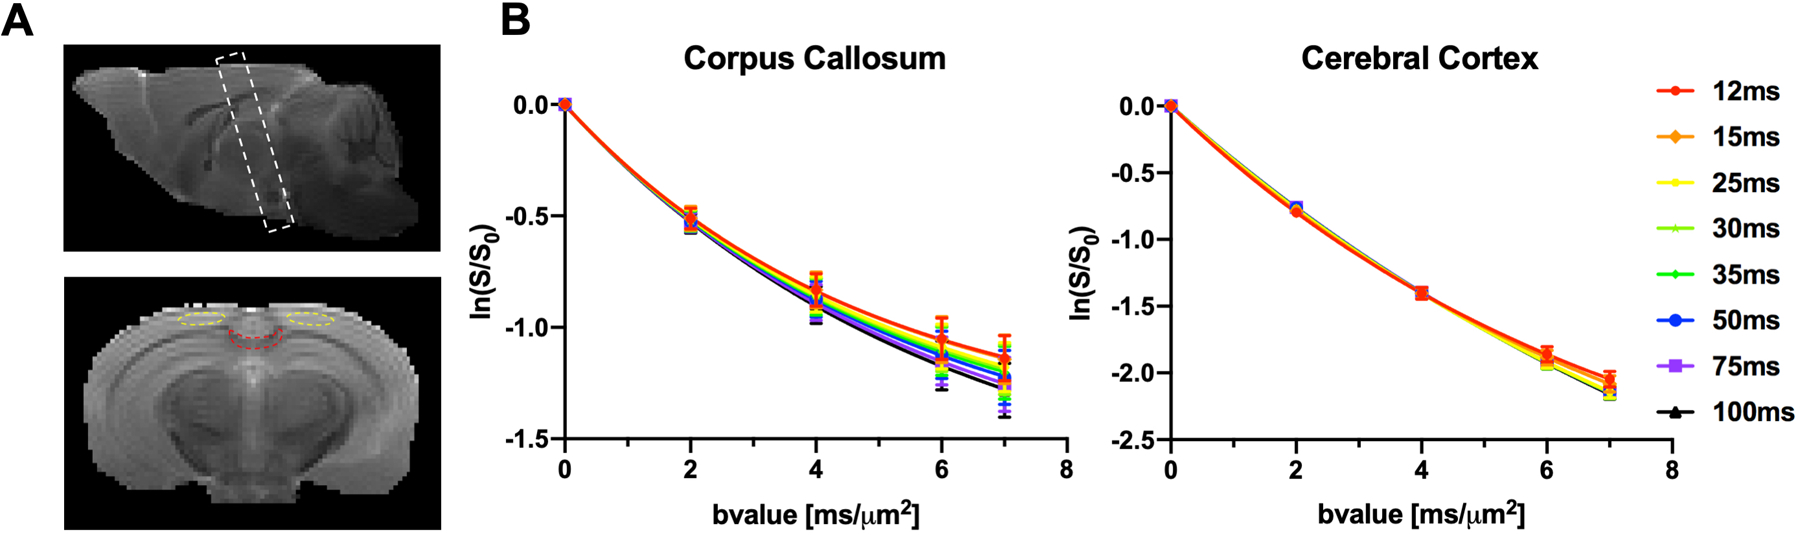
Average diffusion signal attenuation in ex vivo mouse brains (n=5) at room temperature and placement of imaging slices as well as regions of interest (ROIs). A: Top: imaging slices in FEXI and DKI(t) experiments were placed perpendicular to the corpus callosum in the mid-sagittal plane to minimize partial volume effects. Bottom: a representative ROI for the corpus callosum (red) and cerebral cortex (yellow). B: Diffusion signal attenuation for b-values range from 0 – 7 μm2/ms in the corpus callosum and cerebral cortex. The change in the attenuation curves with t reflect microstructural and exchange effects. The error bars indicate standard deviations.
3.2.5: DKI(t) experiments:
DKI(t) data was acquired using a conventional diffusion-weighted stimulated echo sequence (Fig. 2B), with matrix size = 128×80, TE / TR = 41/3000 ms, 4-step phase cycling with slice crusher gradient set at zero, single-shot EPI acquisition, four b-values (2, 4, 6 and 7 μm2/ms) with gradient pulse duration δ = 6 ms and 8 diffusion times (12, 15, 25, 30, 35, 50, 75, and 100ms) in 30 directions with same slice position, number of slices, and slice thickness as the FEXI experiments mentioned above. Signal attenuation curves at different diffusion times (Fig. 3B) show microstructural and exchange effects.
3.3. Data analysis
We used MRtrix 3.0 (www.mrtrix.org) to compute the diffusion tensor in each voxel from the 30 direction diffusion MRI data and generate mean/axial/radial diffusivity (MD/AD/RD) and fractional anisotropy (FA) maps at each tm. For each subject, one imaging slice was selected that contained the posterior end of the corpus callosum. Regions of interest (ROIs) were defined in the selected slice for the corpus callosum and cerebral cortex using ROIEditor (www.mristudio.org), and Eq [1] was fitted to the mean values in each ROI at multiple mixing times using the Matlab curve fitting tool with the trust-region nonlinear least squares option (www.mathworks.com) to estimate AXR and filter efficiency. Voxel-wise fittings of AXR and filter efficiency (σ) were later performed to generate AXR and filter efficiency maps of the brains. For DKI(t) data, the diffusivities for each diffusion time were estimated using the effective b-values, which were calculated including the effects of both diffusion and imaging gradients in Paravision. The diffusion kurtosis data were processed using the weighted linear least square fitting method implemented in the DESIGNER toolbox (43,44) (https://github.com/NYU-DiffusionMRI/DESIGNER) with application of non-negative kurtosis constraints to obtain mean, axial, and radial kurtosis (MK/AK/RK) maps for each diffusion time. Eq [2] and Eq [3] were fitted to the data to estimate K0, τex, and K∞ using curve fitting in Matlab. We also tested if D(t) and K(t) comply with the short-range structural disorder universality class (22) (in spatial dimensions d = 1, 2, 3) as described in (26) to assess whether the t-dependence we measured has any microstructural origin from an incomplete coarse-graining in at least one compartment.
Rician noise was added to the raw FEXI and DKI(t) data to evaluate the effects of noise on estimated AXR and DKI(t) parameters. The results (Supporting Information Table S2) suggest the fittings were robust to noise at the experimentally observed level of signal-to-noise ratio (SNR), defined as mean signal from the brain divided by the standard deviation in the background. F-test was used to evaluate models that were fitted to the DKI(t) data.
Pearson correlation analysis between AXR and values from each mouse were performed using GraphPad Prism (www.graphpad.com).
4. Results
4.1. Combining phase cycling and negative slice prewinder gradients reduced the interference of imaging gradients on FEXI measurements
Sagittal MD(tm) maps acquired using both positive crusher and negative slice prewinder gradients, mixing times from 35 to 100 ms, and slice thickness of 1, 1.5, and 3 mm are shown in Supplemental Figure S1. MD values decreased with the slice thickness (Fig. 4A), suggesting the effects of slice selection gradients cannot be ignored. This effect was reduced but not completely removed by introducing negative slice prewinder gradients. The data acquired with 1.5 mm slice thickness and negative slice prewinder gradients showed MD(tm) curves (red in Fig. 4B–C) closely following those of 3 mm (green in Fig. 4B–C) for mixing times less than 150ms, whereas data acquired with 1.5 mm slice thickness and positive crusher gradients were lower than corresponding measurements with 3 mm slice thickness for mixing times greater than 75 ms. With negative slice prewinder gradients, the estimated AXR based on FEXI MD maps acquired with mixing times from 35 to 150 ms still decreased with the slice thickness (Fig. 4C), but AXRs measured with 1.5 mm slice thickness and negative slice prewinder gradients approximated the AXRs measured with 3 mm slice thickness (Fig. 4C). With a slice thickness of 1mm, the AXRs measured with negative prewinder gradients were lower than AXRs at 3mm. In our water phantom test, the MD values remained stable over a large range of mixing times (Fig. 4D), suggesting relatively stable diffusivity measurements using the sequence with different mixing times.
Fig. 4:
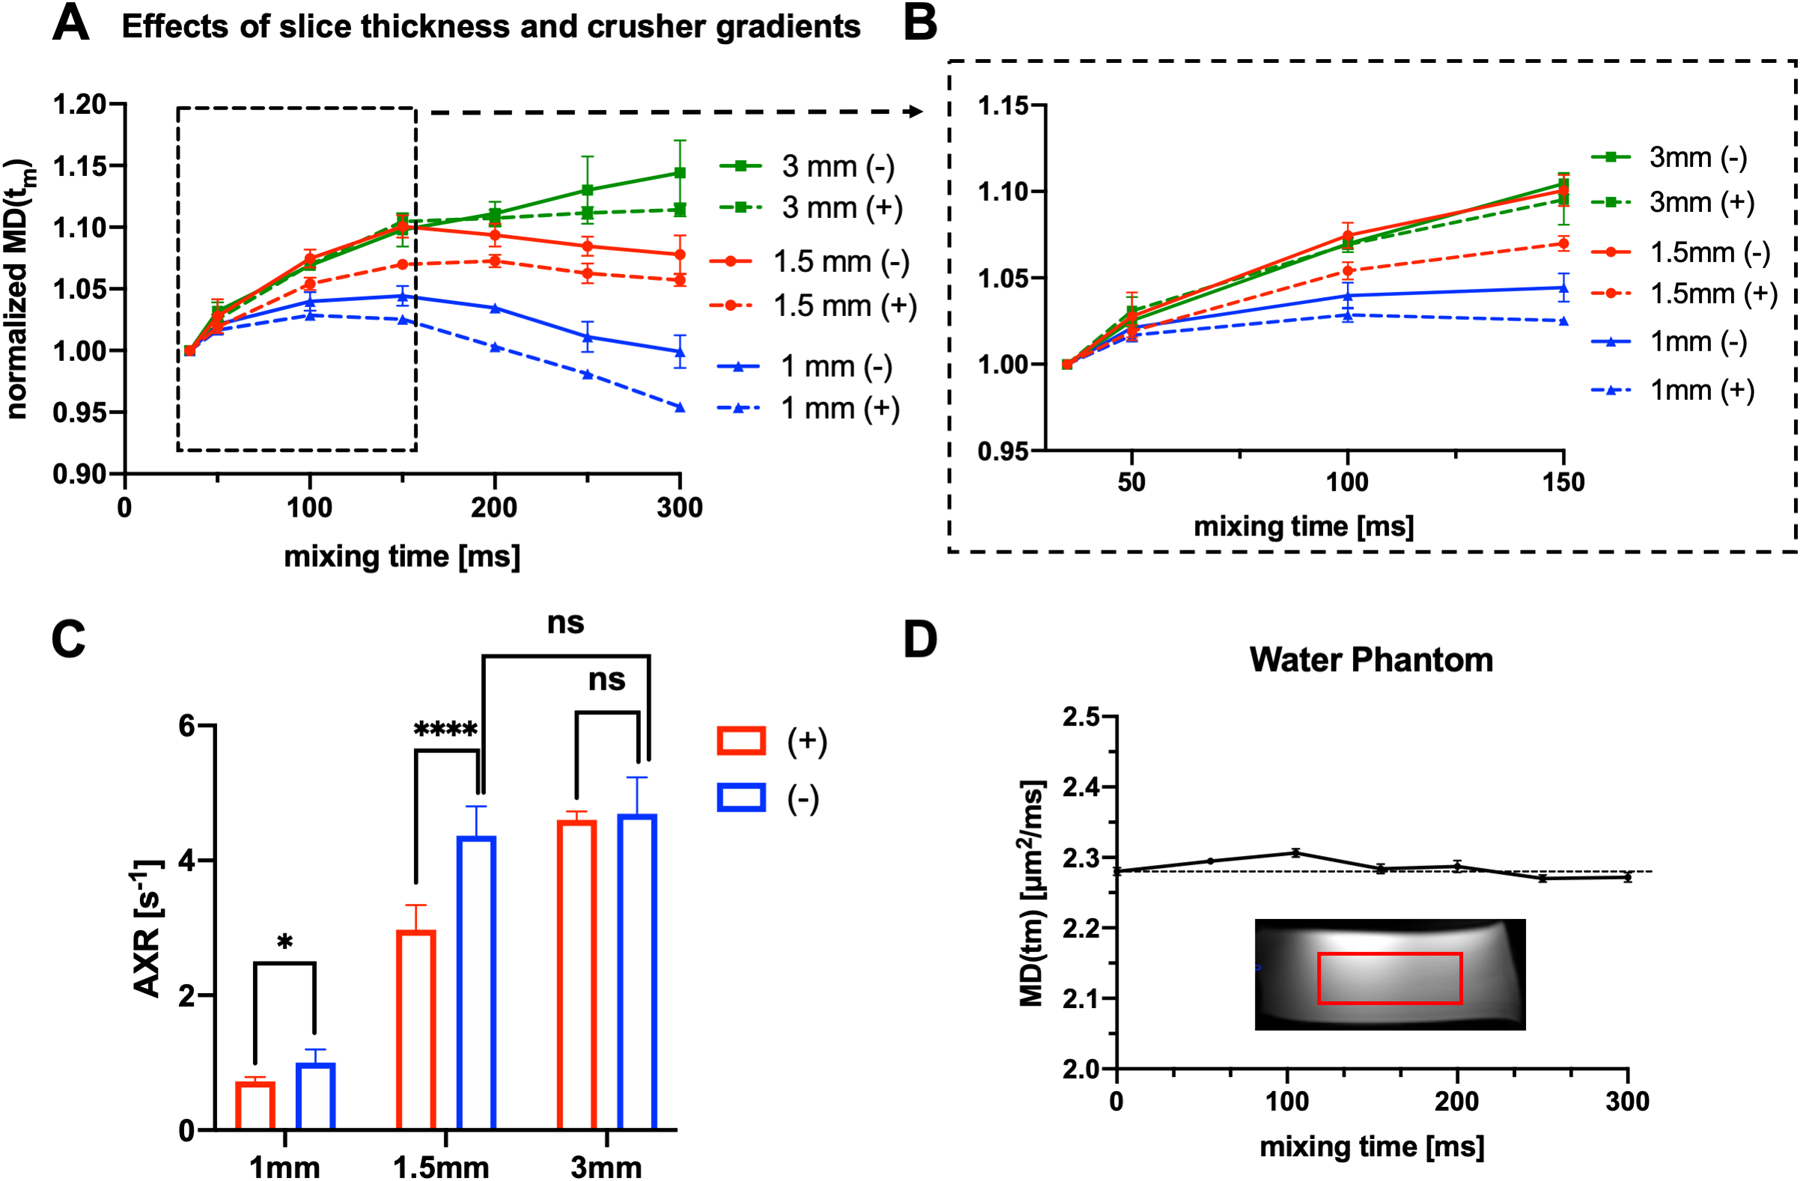
MD maps acquired in the FEXI experiment with phase cycling and positive/negative crusher gradients. A: Plots of the average MD(tm) values in a ROI from 35 to 300 ms (yellow rectangular in Supplemental Fig.1) and B: a zoom-in view for mixing times from 35 to 150 ms. “+” and “−” indicate implementation of positive crusher and negative slice prewinder gradients, respectively. C: the AXRs estimated from 1mm, 1.5 mm and 3mm slice thickness with both positive crusher and negative slice prewinder gradients for mixing time from 35ms to 150 ms. AXRs from data acquired with 1.5mm with negative slice prewinder gradients were slightly lower than the AXRs from data acquired with 3 mm slice thickness, but the difference was not significant with n=5. In comparison, the AXRs estimated from 1.5 mm slice thickness with positive crushers were significantly lower than the 1.5 mm data with negative prewinder gradients (p<0.0001, n=5). D: Plot of average MD(tm) values in a water phantom (within the red rectangle) with a slice thickness of 1.5 mm and negative crushers for mixing times from 5 to 300 ms.
4.2. FEXI of ex vivo mouse brains
Fig. 5 shows FEXI-MD/FA measurements from a representative ex vivo mouse brain. Data from 7 mouse brains showed that, compared to the corpus callosum, the cortex had higher equilibrium MD values (0.38±0.04 μm2/ms vs 0.27±0.03 μm2/ms, p<0.0001), lower filter efficiency (11.1±1.8% vs 21.4±4.8%, p<0.01), and higher AXR (5.94±1.40 s−1 vs 4.99±0.36 s−1, p=0.11). After adding the filter gradient, the directions of diffusion tensors measured in the corpus callosum remained consistent with increasing mixing times (Fig. 5C–D), suggesting that the AXRs based on AD and RD can be used to examine apparent exchange along and perpendicular to the axons in the corpus callosum. As expected, the equilibrium AD values (0.37±0.04 μm2/ms) were significantly higher than the equilibrium RD values (0.22±0.03 μm2/ms, p<0.0001) in the corpus callosum, and the difference was reduced (0.43±0.05 μm2/ms, vs 0.35±0.04 μm2/ms) in the cortex. The fitted radial AXR (4.39±0.24 s−1) were lower than axial AXR values (8.47±4.97 s−1) in the corpus callosum, the estimated filter efficiency values in the corpus callosum were higher in the radial direction (28.7±4.4%) than the axial direction (15.8±4.0%) (Fig. 6A). Fig. 6 shows the estimated filter efficiency and AXR maps based on the RD data from a representative brain.
Fig. 5:
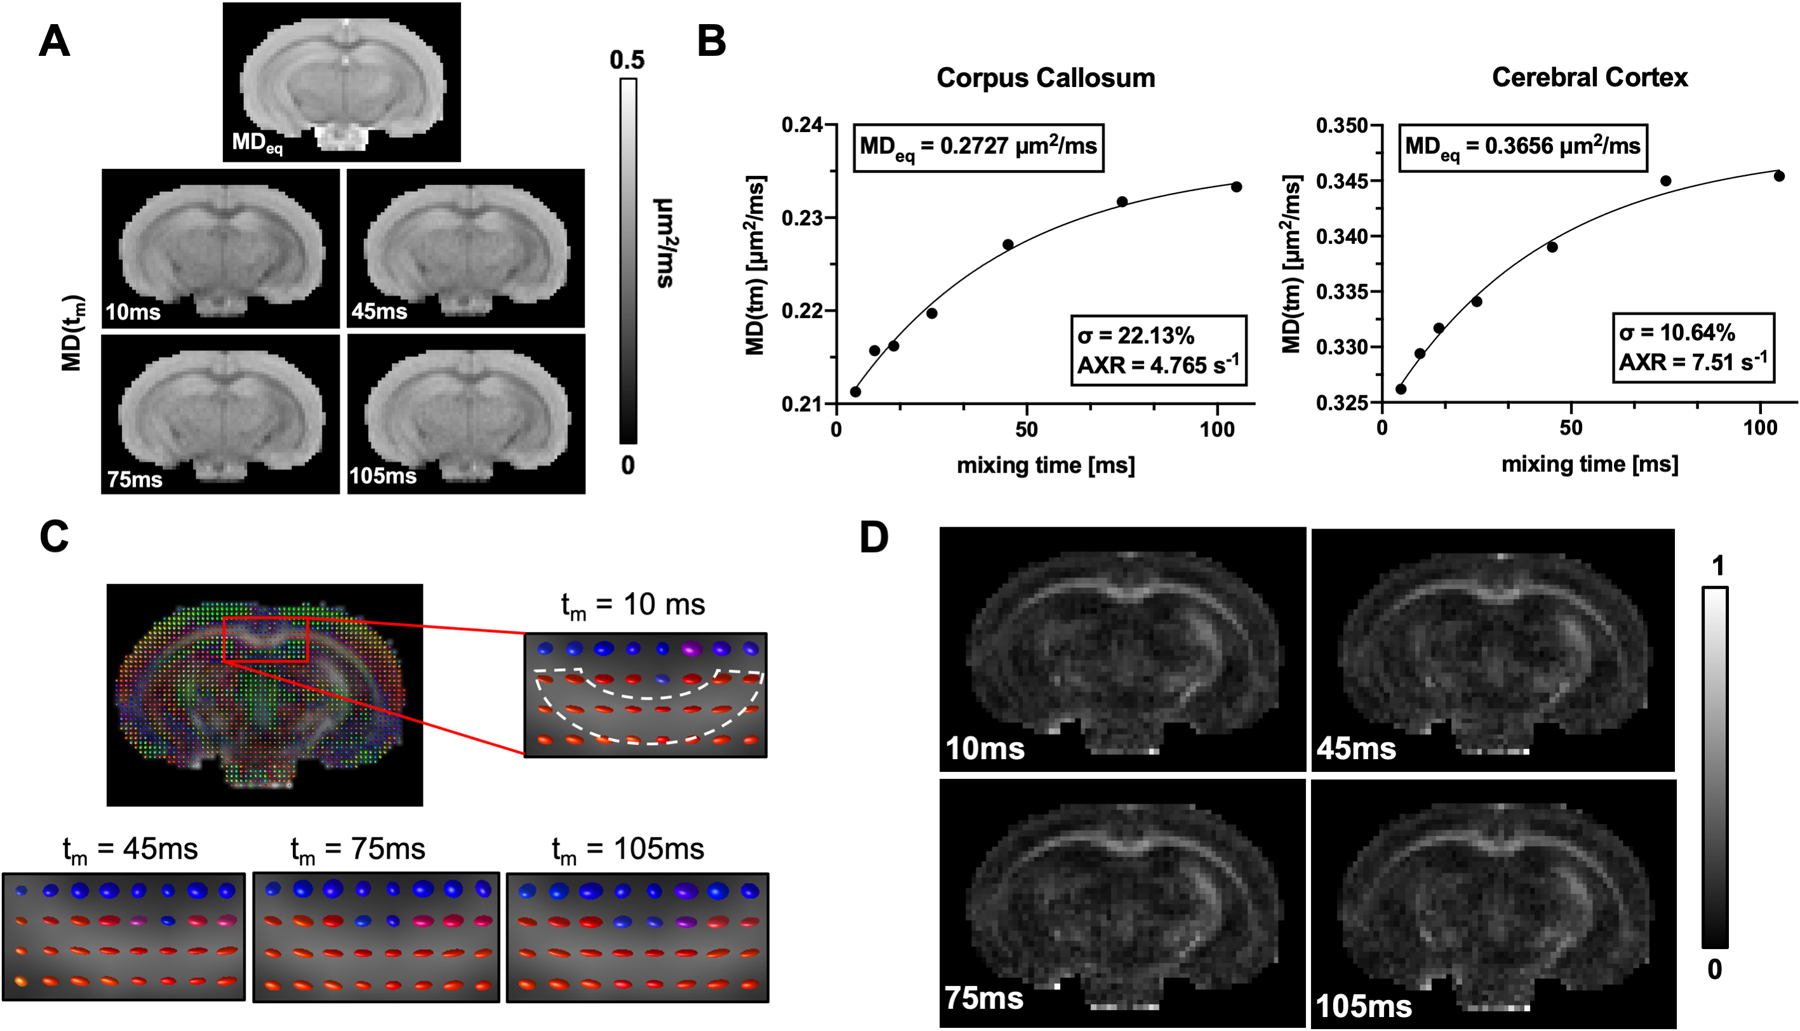
Representative ex vivo FEXI- MD(tm) results from a mouse brain. A-B: Representative MD(tm) maps and fitted curves from ROIs in the corpus callosum and cerebral cortex with mixing times ranging from 5 to 105 ms. The unit of MD is μm2/ms. C-D: diffusion tensor analysis and its corresponding FA maps in corpus callosum.
Fig. 6:
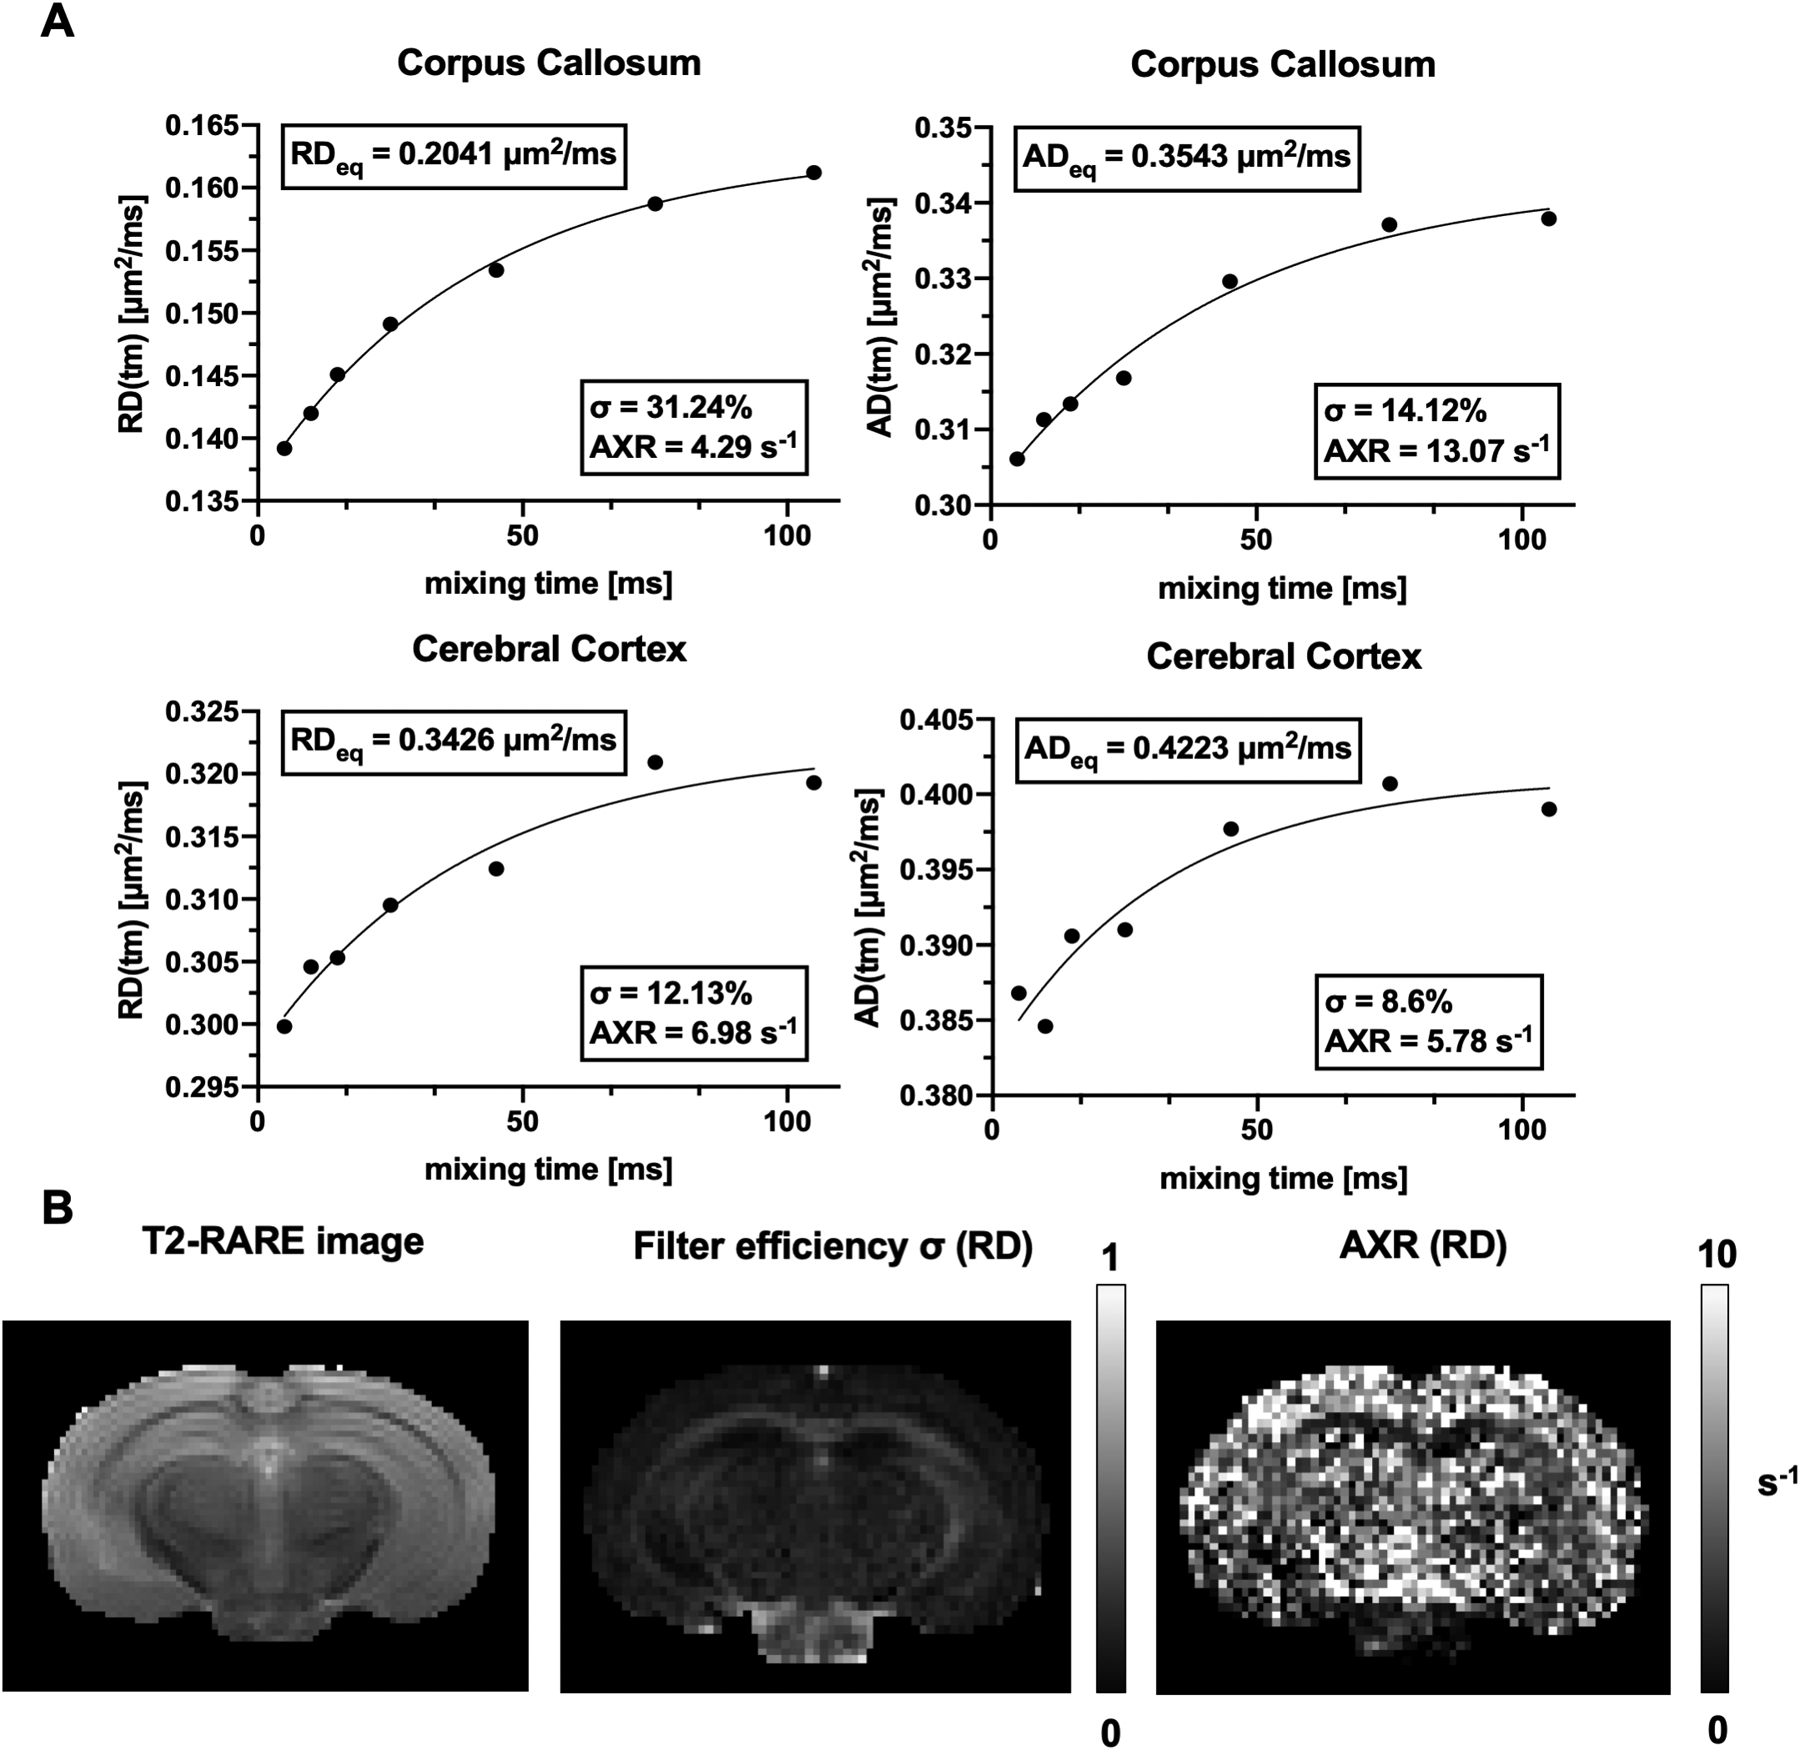
A: Representative RD(tm) and AD(tm) curves from ROIs in the corpus callosum and cerebral cortex from an ex vivo mouse brain. B: T2-weighted RARE image, filter efficiency, and AXR maps based on RD.
4.3. DKI(t) of ex vivo mouse brains
Fig. 7A shows the mean MD/AD/RD values of the ex vivo corpus callosum and cortex at all diffusion times measured in our DKI(t) experiments. While diffusivities in the cortex still showed t-dependence, no apparent t-dependence was observed in the corpus callosum. Diffusivities of the corpus callosum agreed with the equilibrium diffusivities measured in FEXI (Fig. 5B), showing consistency between the FEXI and DKI(t) measurements. The estimated MK maps (Fig. 7B) showed good image quality at all diffusion times.
Fig. 7:
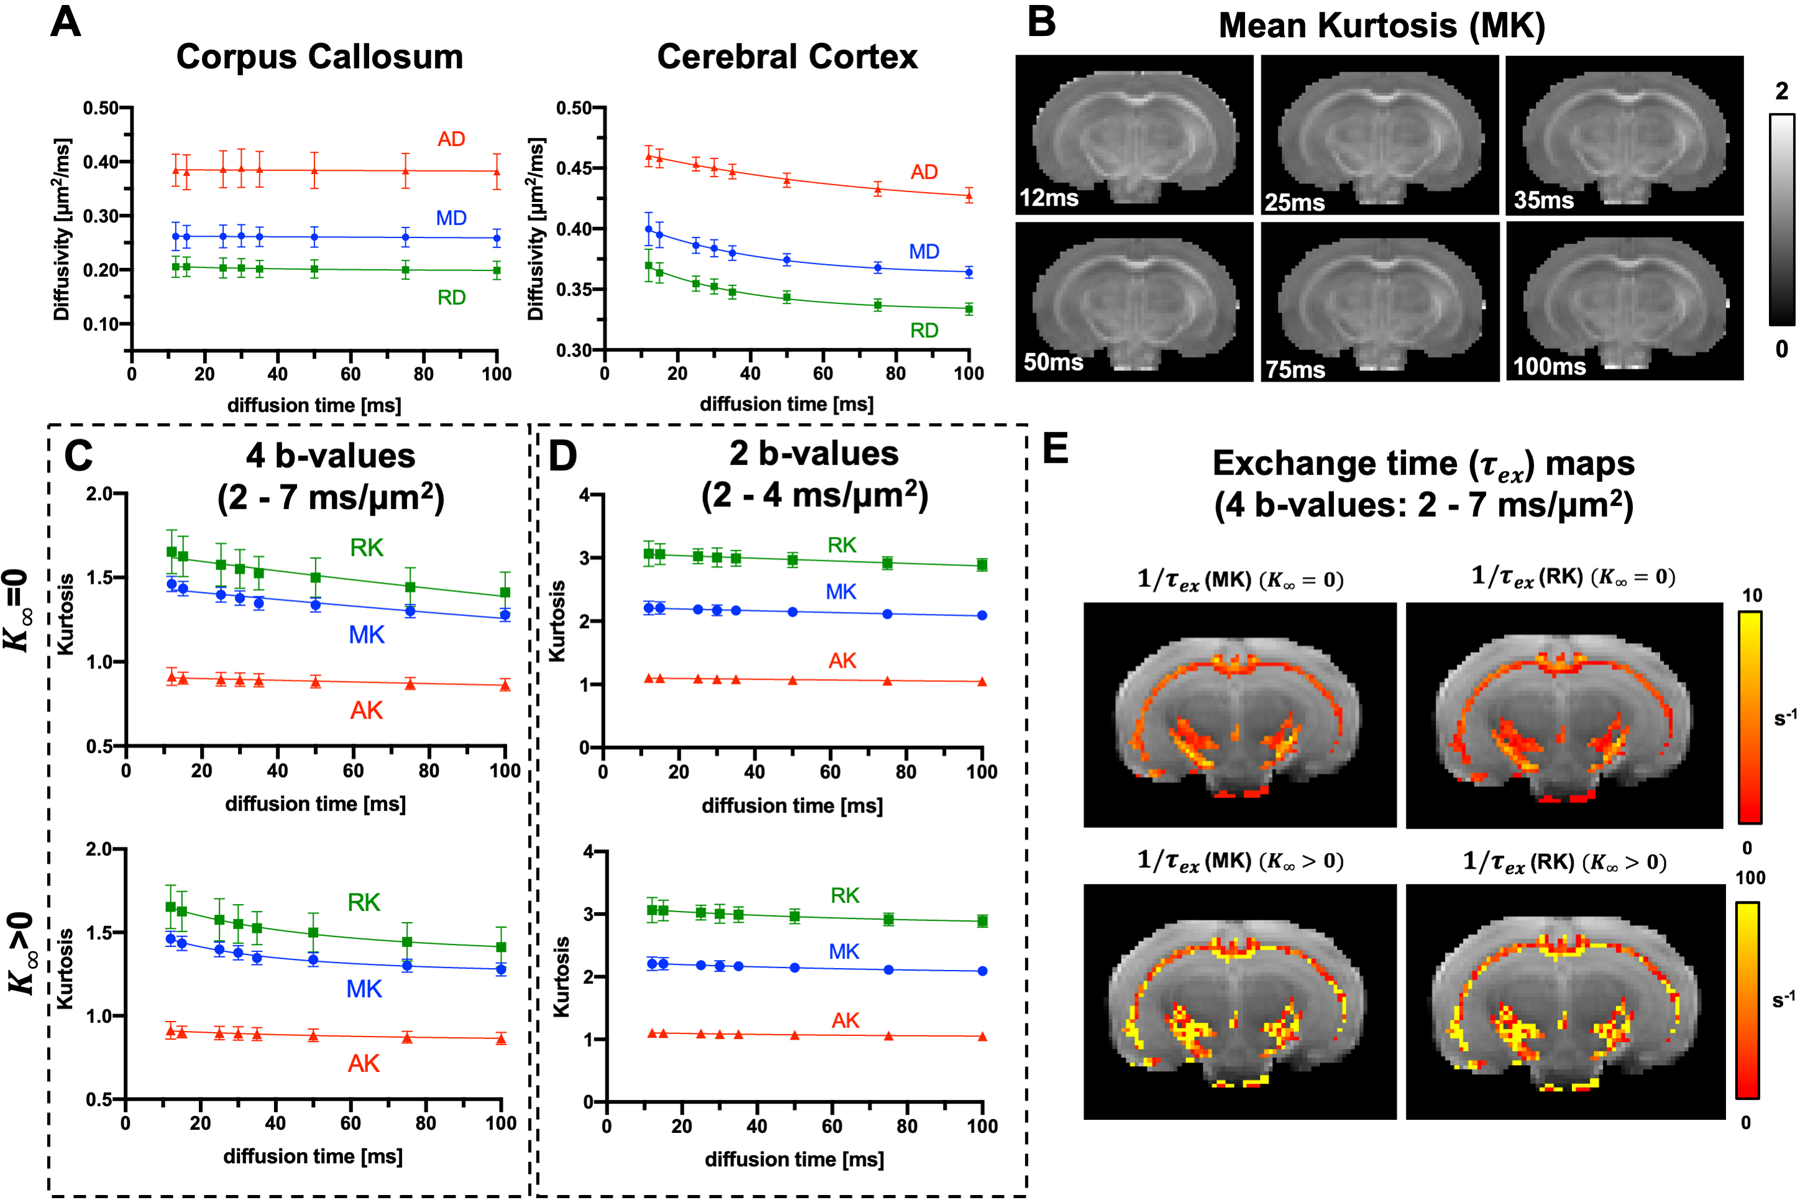
DKI(t) based exchange measurements in the ex vivo mouse brain. A: MD, AD, and RD values of the cerebral cortex and corpus callosum (n=7). B: Representative MK maps for diffusion times ranging from 12 to 100 ms. C: t-dependence of axial, radial and mean diffusivity in corpus callosum and the exchange time estimated by fitting the time-dependent kurtosis to Equation 2 with K∞ = 0 and K∞ > 0. D: voxel-wise of τex and 1/ τex maps based on MK and RK in white matter regions.
Kurtoses in the corpus callosum estimated using data with b values up to 7 ms/μm2 showed strong t-dependence (Fig. 7C). The estimated τex using two-parameter fitting (Eq [2], K∞ = 0) of MK(t) and RK(t) were 232.4±16.0 ms and 184.8±19.9 ms, respectively, longer than τex estimated via three-parameter fit (Eq [3], K∞ > 0): τex =17.6±10.5 ms and 17.2±8.2 ms for MK and RK, respectively. F-tests showed the Eq [2] fitted the data better than a constant model (i.e. K(t) = constant), and Eq [2] and Eq [3] fitted the data equally well (Supporting Information Table S3). Kurtoses estimated using data with b-values up to 4 ms/μm2 showed no apparent t-dependence (Fig. 7D) and were not used in subsequent analyses. Maps of 1/ τex in white matter voxels (FA > 0.4) are shown in Fig. 7E. Estimating τex in the cortex is less straightforward due to t-dependency of its diffusivities, i.e., incomplete coarse-graining. To satisfy the conditions for using Eq 2, as described in Lee et al (26), we excluded kurtosis data acquired at diffusion times less than 30 ms, and the results are shown in Supporting Information Figure S2.
To further assess whether the measured t-dependence has any microstructural effect from incomplete coarse-graining in each compartment, we analyze D(t) and K(t) using the power-law tails ~ t−ϑ of the instantaneous diffusivity (22), where the exponent ϑ = d/2 corresponds to the short-range structural disorder universality class in spatial dimensions d = 1, 2, 3. These power-law tails translate into three distinct t-dependences of the PGSE-measured cumulative D(t) and K(t) (22,24,45), with the exponent ϑ > 1 reflected in the 1/t behavior of D(t) and K(t), as summarized by Lee et al (26) (Fig. 8). F-tests showed no significant difference among the three types of t-dependences when fitted to the data (Supporting Information Table S4). RMSEs of the fits can be found in Supporting Information Table S5). In general, the matching power law tails of D(t) and K(t) indicate an incomplete coarse-graining due to residual microstructural effects. In the corpus callosum, with no apparent t-dependence of RD(t) (Fig. 8), the observed t-dependence of RK(t) suggests complete coarse-graining and exchange as the predominant underlying mechanism. In comparison, the cortex shows t-dependence in both diffusivity and kurtosis (Fig. S2 in the Supplemental Materials), implying incomplete coarse-graining and the mixed effects of microstructure and exchange at the range of diffusion times used here. With the complex microstructure in the cortex, it is possible that all three structural disorder classes exist simultaneously.
Fig. 8:
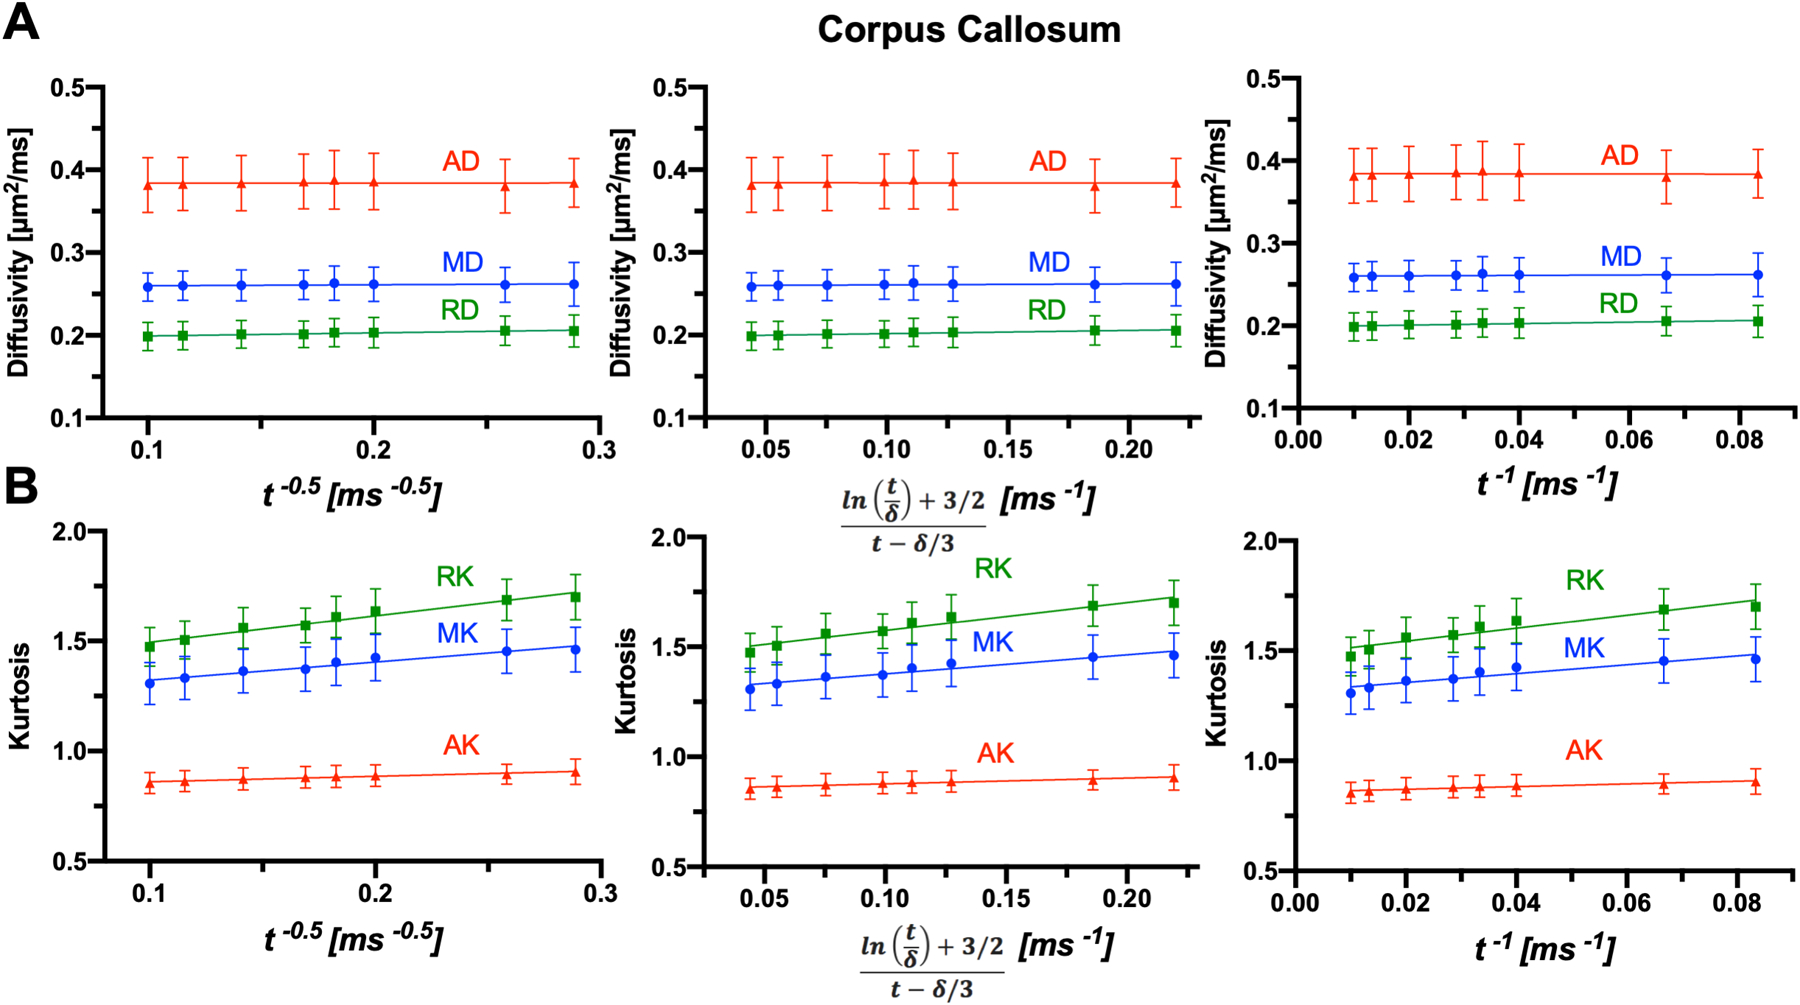
Power-law behaviors of diffusivity and kurtosis under three structural disorder classes. The diffusivity (A) and kurtosis measurements (B) in ex vivo corpus callosum are plotted as functions of t−1/2 for d = 1 (45), for d = 2 (24), and t−1 for d = 3 (22), respectively.
We then compared AXR and 1/τex from the corpus callosum. AXR based on RD showed a significant correlation with 1/τex estimated from RK using Eq [2] (Fig. 9B). Between AXRs based on MD and 1/ τex values estimated from MK using Eq [2], no significant correlation was observed. No correlation was found between AXRs and 1/ τex values estimated from either MK or RK using Eq [3].
Fig. 9:
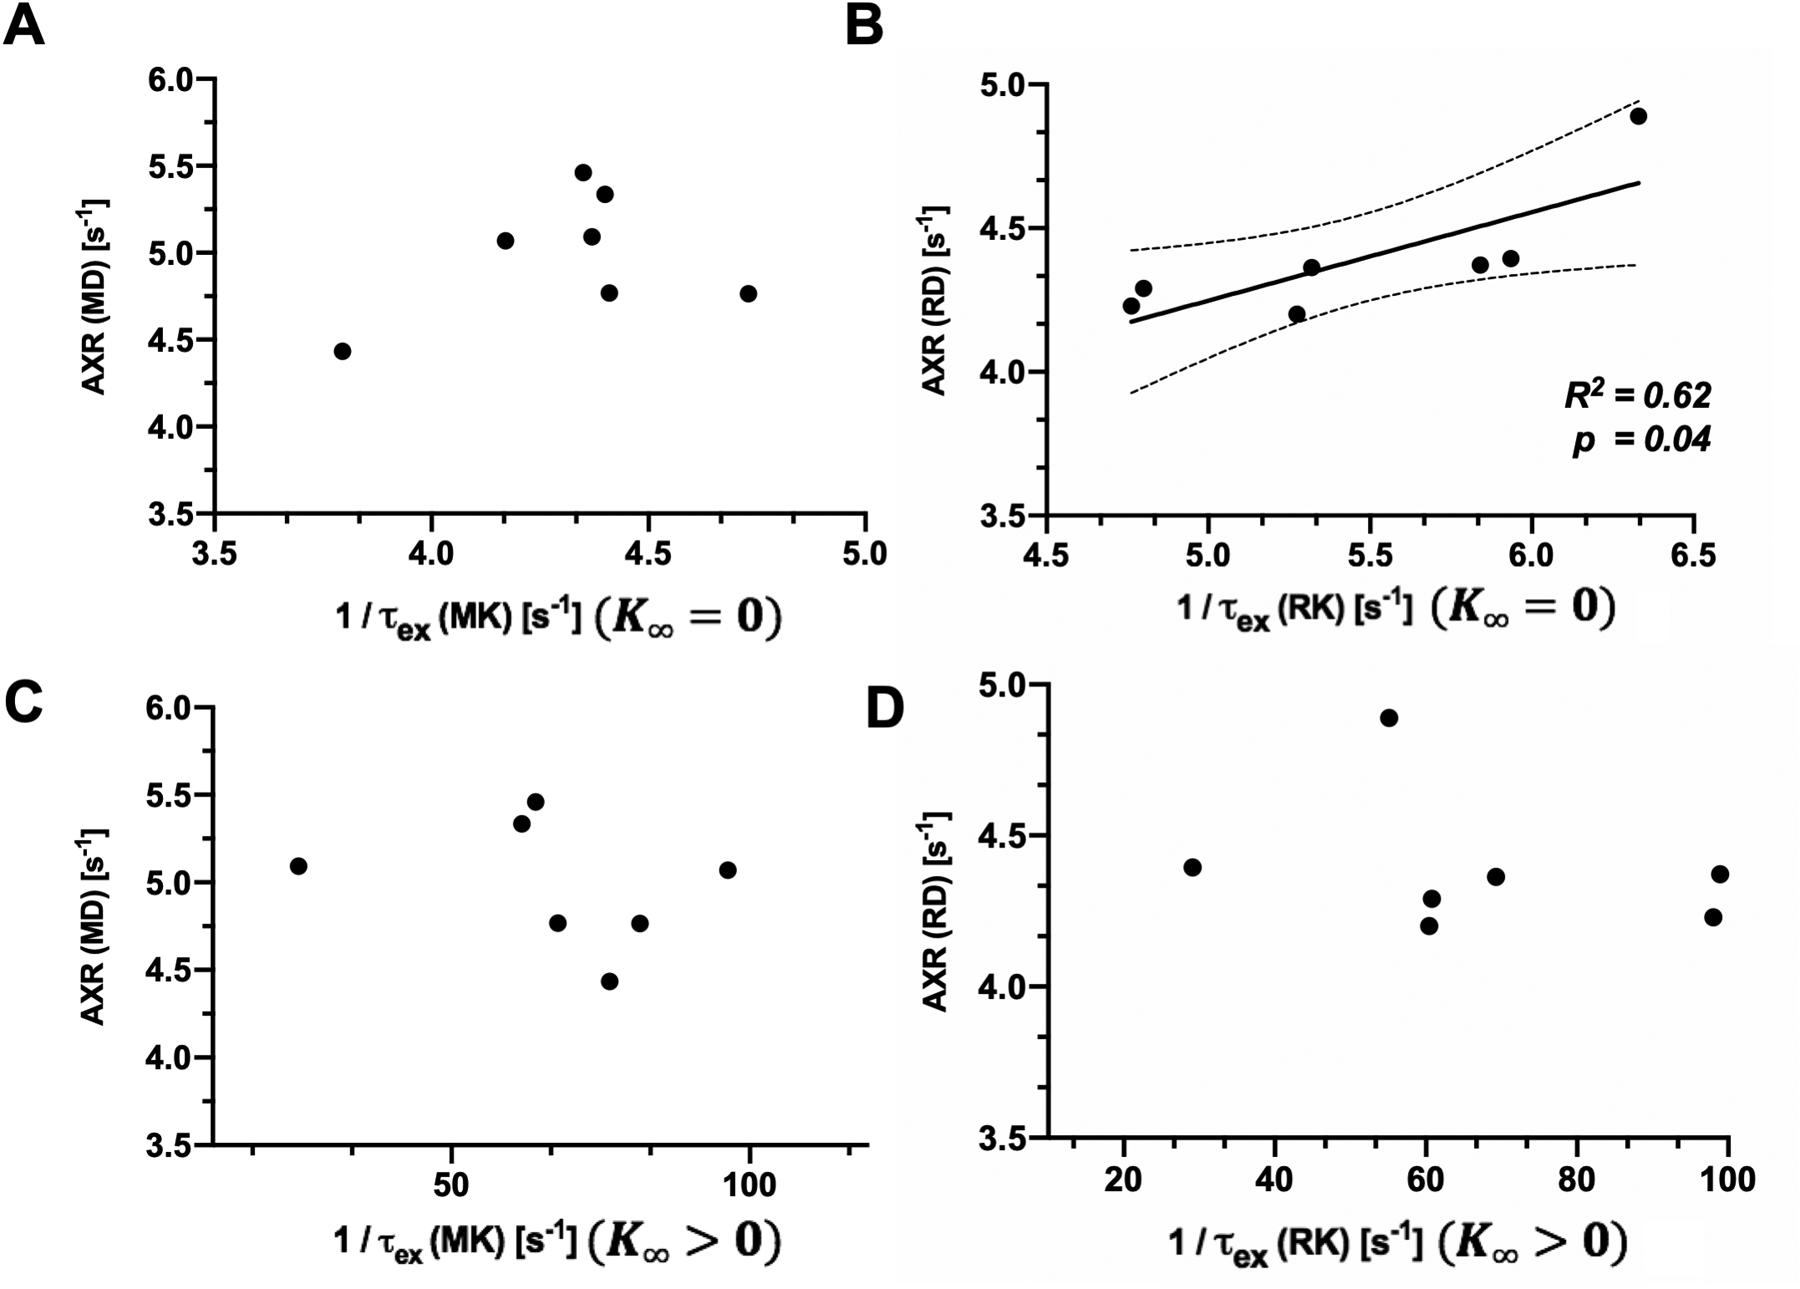
Scatter plots of FEXI and DKI(t) based exchange measures of the ex vivo mouse corpus callosum. A-B: Scatter plots of AXR from mean/radial diffusivities and 1/ τex from two-parameter fitting of mean/radial kurtoses, respectively. C-D: Scatter plots of AXR from mean/radial diffusivities and 1/ τex from three-parameter fitting of mean/radial kurtoses, respectively. Each point corresponds to measurements from one subject (n = 7).
5. Discussion
5.1. Technical considerations of FEXI and DKI(t) experiments on preclinical MRI systems:
Strong imaging gradients are frequently used in preclinical MRI experiments in order to visualize small anatomical structures with sufficient details, and special considerations are therefore needed to minimize the effects of imaging gradients on FEXI and DKI(t) experiments as described before (34,35). Here, we show that negative slice prewinder gradients can reduce the effects of imaging gradients for mixing times below 100 ms but need to be used together with phase cycling to remove unwanted signal pathways. For in vivo FEXI implementation, 4-step phase cycling is time consuming and challenging due to phase instability associated with animal motions, physiology, and instrument instability.
The combination, however, did not completely remove the effects of imaging gradient for long mixing times (Fig. 4B), and the effects will also affect DKI(t), causing additional signal attenuation. One likely cause is microscopic background gradients, which, in interaction with diffusion and imaging gradients, can cause dephasing for water molecules that undergo exchange during tm and are difficult to remove completely in biological tissues via shimming. The conventional FEXI sequence with two spin-echo diffusion encoding blocks (32)(29) should be less susceptible to microscopic background gradients than the modified FEXI sequence implemented in this study due to the 180° refocusing pulses, but will necessitate a more complex phase-cycling scheme if negative slice prewinder gradients are employed. This will pose an obstacle for experiments at high magnetic fields that require long mixing times.
Previously, Li et al. (46) reported that, in live human brain white matter, AXR values measured with both the filter and detection gradients perpendicular (AXR┴) to the axons were higher than AXR values measured with both gradients parallel to the axons (AXR║). In comparison, we found higher axial AXRs than radial AXRs in the ex vivo mouse corpus callosum (Fig. 6A). Besides the potential large differences in microstructure and water exchange between live human brains and ex vivo mouse brains, this discrepancy may also be explained by differences in the methods used to obtain AXR║ and radial AXR. In our study, instead of placing the filter and detection gradients along the same direction, we kept the filter gradient direction perpendicular to axons in the corpus callosum and varied the detection gradients along 30 non-colinear directions. This allowed us to examine estimated AXRs along multiple directions under the same filtered condition (i.e. the same spin pool being suppressed), which will inevitably be altered by changing the filter gradient direction in anisotropically organized white matter region. In addition, we found lower filter efficiency for AD(tm) than those for RD(tm) in the ex vivo mouse corpus callosum, potentially due to less difference in AD between the two compartments than in RD, whereas Li et al. reported similar filter efficiency along parallel and perpendicular directions, which was explained by introducing a glial compartment. This evidence suggests that AXR║ and radial AXR are not the same physical entity and therefore not comparable. Numerical simulations in Li et al. suggested that AXR┴, which was acquired in the same fashion as radial AXR here, is more sensitive to transmembrane water exchange in white matter than AXR║, which may help explaining why correlation between AXR and 1/ τex was only found along the radial direction, as they may be sensitive to the same exchange process.
Reported differences between live and chemically fixed tissues suggest that further optimization of the imaging parameters is necessary for in vivo studies. For example, the strong filter gradient diffusion weightings used in this study (4 μm2/ms) can be reduced for in vivo studies as diffusivities in live tissues at body temperature are higher than ex vivo samples at room temperature. Significant differences in tissue water exchange between in vivo and ex vivo tissues, due to lack of functional aquaporin channels and active exchange processes (Na+-K+-ATPase pump), as well as the temperature difference (room vs body temperature), also require adjusting the range of mixing times accordingly.
5.2. Comparing FEXI and DKI(t)
The comparison between FEXI and DKI(t) revealed advantages and limitations of both techniques. When the targeted tissue has well defined compartments and large differences in diffusivities, FEXI provides a clear physical interpretation. From a practical point of view, for white matter tracts, the filter direction in FEXI ideally should be placed perpendicular to the axons, whereas DKI(t) does not require such special consideration and is more practical when multiple white matter structures are of interest. In addition, FEXI experiments at high magnetic fields typically have lower SNR than DKI(t) experiments as a result of the signal attenuation introduced by the filtering blocks as well as the long TE needed to accommodate the filtering and detection blocks.
The exchange rates/times from previous reports (Fig.1) cover a large range(20,29,30,33,38,47–59), and the estimated AXR and τex from two parameters fitting in this study are comparable to these reports. Although we found a correlation between AXR and 1/ τex from two-parameter fitting in the corpus callosum along the radial direction, the AXR values were generally lower than 1/ τex. This difference may be explained by the residual effects of imaging and background gradients on FEXI measurements, which reduced the estimated AXRs, as well as residual microstructural effects from incomplete coarse-graining, which biased the estimated AXR and τex. The greater difference between AXR and 1/τex values in the cortex than in the corpus callosum likely reflected the even stronger effects from incomplete coarse-graining (Fig. 8B). In addition, while the effects of exchange became more apparent with stronger diffusion weightings (Fig. 3B), the diffusion weightings used for DKI(t) in this study (up to 7 ms/μm2) were much higher than those used by similar studies and could also introduce bias in the estimated τex due to non-considered higher order terms. In comparison, constant gradient SDE method does not have this limitation, and future studies comparing FEXI, DKI(t), and the constant gradient SDE method will provide additional information on the strengths and limitations of each method.
One limitation of the study is that the sensitivity of FEXI and DKI(t) to exchange was not examined. A recent report by Ning et al. (60) used numerical simulations to evaluate the sensitivity of SDE and double diffusion encoding (DDE) methods to exchange and suggested the sensitivity of SDE method (the basis of DKI(t)) surpass that of DDE methods at long mixing or diffusion time with respect to the exchange rate. Such prediction suits both FEXI and DKI(t) as DKI(t) prefers long diffusion time to reduce the influence of microstructure whereas the effects of background gradient or other factors make short mixing time FEXI measurements more reliable. Further studies using animal models with altered membrane permeability via aquaporin channels (61–63) will allow us to evaluate these diffusion MRI based techniques to map tissue exchange.
5.3. DKI(t) with a non-zero K∞
Given that the kurtosis is overall ≈ 1, we went beyond the simple two-compartment exchange model and introduced a non-zero K∞ in the fitting. Remarkably, this shortened the estimated τex by an order of magnitude (Fig. 7C), and practically removed the correlation between AXR and 1/τex. This intriguing finding prompts further investigation and is discussed next in more detail.
Generally, a non-zero K∞ indicates the existence of additional heterogeneity, e.g, the presence of partial-volume (macroscopic) contributions of tissues with different diffusivities, that can be seen as extra non-exchanging compartments within a voxel. In this case, one can think that the Kärger model describes the exchange between only two compartments (out of many), and it would fail if there exist multiple exchange processes between three or more compartments. Furthermore, the meaning of the coefficients K0 and K∞ is as follows: their sum corresponds to the total variance of diffusivities of all compartments at short times, whereas a nonzero K∞ corresponds to the variance of macroscopic compartments’ diffusivities at long times, at which point the coarse-graining and exchange processes have occurred over microscopic compartments within the attainable diffusion times (in our case, ~100 ms), but the time to coarse-grain over the whole voxel remains prohibitively long. Such a situation can occur in a voxel with microscopic anisotropy, e.g., due to orientationally dispersed 2-compartment “fascicles”, where exchange has already occurred between intra- and extra-neurite spaces in each fascicle yet the water molecules have not yet managed to probe different local fascicle orientations over the whole macroscopic voxel. Hence, the signal at t ≫ tex is a sum of anisotropic Gaussian signals (from each fascicle) that are differently oriented; such signal is non-Gaussian. As an example, in Appendix of (50) such a residual nonzero K∞ was calculated for the isotropic distribution of identical 2-compartment fascicles.
Two recent studies reported comparable K∞ values from DKI(t) data collected with a range of diffusion times similar to those in this study, in human brain gray matter (26) and in live rat cortex. Interestingly, in those studies the introduction of finite K∞ has also dramatically lowered the estimated exchange time: from about 250 ms to 11 ms in (26) and from about 20 ms to ~1 ms in (50). Another recent report by Olesen et al. (53) included an immobile non-exchanging compartment to fit diffusion MRI signals from ex vivo rat brain and found that immobile fraction was only about 1%, hence its contribution to K∞ should be negligible. However, this in principle does not exclude the finite K∞ due to macroscopic voxel heterogeneity, also discussed in (50). Reliable determination of K∞ and K0, as well as establishing whether there exist different exchange time scales between more than two compartments, would require DKI(t) data within a range longer than 100 ms.
It is important to note that the relationship between the total exchange rate 1/τex and the compartment residence times is modulated by the corresponding compartment fractions obeying the detailed-balance relationship. Hence, the changes in 1/τex may occur either due to membrane permeability or due to changes in volume fractions as demonstrated recently by Ludwig et al (64). Under pathological conditions, changes in tissue microstructure and transmembrane water exchange may happen simultaneously, as in the case of ischemic stroke. Whether FEXI and DKI(t) can still measure exchange under such conditions remains to be investigated.
5.4. Separating exchange and microstructure in DKI(t)
In DKI(t), the t-dependent diffusivity and kurtosis changes are potentially due to the “interference” between exchange and the competing restrictive effects of tissue microstructure as the diffusion time increases. Different from fixed diffusion time or gradient methods, DKI(t) can separate these two effects in certain cases, and the model-selection tree of DKI(t) data described by Lee et al (26) provides a guide on choosing the range of diffusion time appropriate for the Kärger model.
When exchange time tex is much longer than the correlation time associated with the correlation length scale lc of local tissue microstructure, it is possible to separate the two effects by driving the diffusion time into the regime t ~ tex ≫ tc. This physically means that for the diffusion times t used to probe tex, the microstructure has been fully coarse-grained. With no t-dependence of diffusivity due to the completeness of coarse-graining, the t-dependence of kurtosis mainly comes from exchange between compartments at t ~ tex, as shown by our result from the corpus callosum (Fig. 7).
However, when the time scales of restrictions and exchange are of the same order (tex ~ tc), it remains difficult to separate exchange from an incomplete coarse-graining in DKI(t) data. Examining the power law behaviors of diffusivities and kurtosis can provide useful information on whether coarse-graining is complete (22–24,26). For example, both the observed t-dependence in diffusivities from cortex (Fig. 7A) and following power law analysis (Fig. S3 in Supplemental Materials) indicated the presence of microstructural effects on measuring exchange in cortex at the diffusion timescale we used. The biasing effect of incomplete coarse-graining will in general be different for the FEXI and DTI(t) exchange parameters, and this can explain the reduced or absent correlation between the observed exchange rates, as we observe in gray matter. The theory of such “interference” between coarse-graining and exchange still remains to be developed.
In summary, we demonstrated optimized FEXI and DKI(t) of ex vivo mouse brains on a preclinical MR system. The correlation between radial AXR and 1/ τex from two-parameter fitting suggests that both are sensitive to the underlying exchange processes in the corpus callosum. However, if macroscopic compartment heterogeneity is present (causing a finite K∞), the mismatch between FEXI and DKI(t) points at potentially multiple exchange processes and/or the residual effects of the structural disorder (incomplete coarse-graining), and the need for more exquisite modeling. We hope this investigation will help building a connection between these two diffusion techniques and offer new perspectives for optimal image implementation strategies to model and estimate exchange processes in brain regions behind the blood brain barrier.
Supplementary Material
Supporting Information Figure S1: Sagittal MD maps acquired in the FEXI experiment with phase cycling and positive/negative crusher gradients (slice thickness of 1, 1.5 and 3mm for mixing time from 35ms to 100ms).
Supporting Information Figure S2 t-dependent kurtosis changes in the ex vivo mouse cerebral cortex. A: t-dependence of mean, radial and axial kurtosis in the cortex. B-C: Estimated exchange parameters using two and three-parameter fittings.
Supporting Information Figure S3: Power-law behaviors of diffusivity (A) and kurtosis (B) under three structural disorder classes in the cerebral cortex. The diffusivity and kurtosis measurements are plotted as functions of t−1/2 for d = 1, for d = 2, and t−1 for d = 3, respectively, respectively.
Supporting Information Table S1: MRI-based estimates of tissue water exchange rate and time in the literature.
Supporting Information Table S2: The propagation of noise from raw data to estimated FEXI and DKI parameters. The FEXI and DKI(t) parameters from raw data without added noise (SNR = 123 in the non-diffusion-weighted b0 images, n=7) are compared to parameters from raw data with added noise (SNR = 77 and 52, n=7, 10 repetitions per subjects).
Supporting Information Table S3: F-test result to compare three models (Kärger model, modified Kärger model and constant model) of kurtosis fitting in corpus callosum of ex vivo mouse brains.
Supporting Information Table S4: F-test result to compare three classes (d=1,2 and 3) of structural disorders in corpus callosum of ex vivo mouse brains.
Supporting Information Table S5: Root mean square errors (RMSE) of fitting for three classes (d=1, 2, 3) of structural disorders in corpus callosum and cerebral cortex.
Acknowledgement:
The project was supported by the National Institute of Health (NIH) R01 HD 074593, R01 NS 102904 and R01 NS088040, and was performed using shared resource supported by NIH 1S10OD018337-01, 5P30CA016087, and P41 EB017183.
REFERENCES:
- 1.Stillwell W An introduction to biological membranes: composition, structure and function: Elsevier; 2016. [Google Scholar]
- 2.Verkman AS, van Hoek AN, Ma T, Frigeri A, Skach WR, Mitra A, Tamarappoo BK, Farinas J. Water transport across mammalian cell membranes. Am J Physiol 1996;270(1 Pt 1):C12–30. [DOI] [PubMed] [Google Scholar]
- 3.MacAulay N Molecular mechanisms of brain water transport. Nat Rev Neurosci 2021;22(6):326–344. [DOI] [PubMed] [Google Scholar]
- 4.Bortner CD, Cidlowski JA. Ions, the Movement of Water and the Apoptotic Volume Decrease. Front Cell Dev Biol 2020;8:611211. [DOI] [PMC free article] [PubMed] [Google Scholar]
- 5.Herscovitch P, Raichle ME, Kilbourn MR, Welch MJ. Positron emission tomographic measurement of cerebral blood flow and permeability-surface area product of water using [15O]water and [11C]butanol. J Cereb Blood Flow Metab 1987;7(5):527–542. [DOI] [PubMed] [Google Scholar]
- 6.Springer CS Jr. Using (1)H2O MR to measure and map sodium pump activity in vivo. J Magn Reson 2018;291:110–126. [DOI] [PubMed] [Google Scholar]
- 7.Zhou J, Wilson DA, Ulatowski JA, Traystman RJ, van Zijl PC. Two-compartment exchange model for perfusion quantification using arterial spin tagging. J Cereb Blood Flow Metab 2001;21(4):440–455. [DOI] [PubMed] [Google Scholar]
- 8.Zhang J, Kim SG. Estimation of cellular-interstitial water exchange in dynamic contrast enhanced MRI using two flip angles. NMR Biomed 2019;32(11):e4135. [DOI] [PMC free article] [PubMed] [Google Scholar]
- 9.Rooney WD, Li X, Sammi MK, Bourdette DN, Neuwelt EA, Springer CS Jr. Mapping human brain capillary water lifetime: high-resolution metabolic neuroimaging. NMR Biomed 2015;28(6):607–623. [DOI] [PMC free article] [PubMed] [Google Scholar]
- 10.Bae J, Zhang J, Wadghiri YZ, Minhas AS, Poptani H, Ge Y, Kim SG. Measurement of blood-brain barrier permeability using dynamic contrast-enhanced magnetic resonance imaging with reduced scan time. Magn Reson Med 2018;80(4):1686–1696. [DOI] [PMC free article] [PubMed] [Google Scholar]
- 11.Dortch RD, Harkins KD, Juttukonda MR, Gore JC, Does MD. Characterizing inter-compartmental water exchange in myelinated tissue using relaxation exchange spectroscopy. Magn Reson Med 2013;70(5):1450–1459. [DOI] [PMC free article] [PubMed] [Google Scholar]
- 12.van Gelderen P, Duyn JH. White matter intercompartmental water exchange rates determined from detailed modeling of the myelin sheath. Magn Reson Med 2019;81(1):628–638. [DOI] [PMC free article] [PubMed] [Google Scholar]
- 13.Harkins KD, Dula AN, Does MD. Effect of intercompartmental water exchange on the apparent myelin water fraction in multiexponential T2 measurements of rat spinal cord. Magn Reson Med 2012;67(3):793–800. [DOI] [PMC free article] [PubMed] [Google Scholar]
- 14.Kärger J Der Einfluß der Zweibereichdiffusion auf die Spinechodämpfung unter Berücksichtigung der Relaxation bei Messungen mit der Methode der gepulsten Feldgradienten. Annalen der Physik 1971;482(1):107–109. [Google Scholar]
- 15.Kärger J NMR self-diffusion studies in heterogeneous systems. Advances in Colloid and Interface Science 1985;23:129–148. [Google Scholar]
- 16.KÄRGER J, Pfeifer H, Heink W. Principles and application of self-diffusion measurements by nuclear magnetic resonance. Advances in Magnetic and optical resonance. Volume 12: Elsevier; 1988. p 1–89. [Google Scholar]
- 17.Niendorf T, Dijkhuizen RM, Norris DG, van Lookeren Campagne M, Nicolay K. Biexponential diffusion attenuation in various states of brain tissue: implications for diffusion-weighted imaging. Magn Reson Med 1996;36(6):847–857. [DOI] [PubMed] [Google Scholar]
- 18.Stanisz GJ, Szafer A, Wright GA, Henkelman RM. An analytical model of restricted diffusion in bovine optic nerve. Magn Reson Med 1997;37(1):103–111. [DOI] [PubMed] [Google Scholar]
- 19.Meier C, Dreher W, Leibfritz D. Diffusion in compartmental systems. I. A comparison of an analytical model with simulations. Magn Reson Med 2003;50(3):500–509. [DOI] [PubMed] [Google Scholar]
- 20.Meier C, Dreher W, Leibfritz D. Diffusion in compartmental systems. II. Diffusion-weighted measurements of rat brain tissue in vivo and postmortem at very large b-values. Magn Reson Med 2003;50(3):510–514. [DOI] [PubMed] [Google Scholar]
- 21.Latour LL, Svoboda K, Mitra PP, Sotak CH. Time-dependent diffusion of water in a biological model system. Proc Natl Acad Sci U S A 1994;91(4):1229–1233. [DOI] [PMC free article] [PubMed] [Google Scholar]
- 22.Novikov DS, Jensen JH, Helpern JA, Fieremans E. Revealing mesoscopic structural universality with diffusion. Proc Natl Acad Sci U S A 2014;111(14):5088–5093. [DOI] [PMC free article] [PubMed] [Google Scholar]
- 23.Fieremans E, Burcaw LM, Lee HH, Lemberskiy G, Veraart J, Novikov DS. In vivo observation and biophysical interpretation of time-dependent diffusion in human white matter. Neuroimage 2016;129:414–427. [DOI] [PMC free article] [PubMed] [Google Scholar]
- 24.Burcaw LM, Fieremans E, Novikov DS. Mesoscopic structure of neuronal tracts from time-dependent diffusion. Neuroimage 2015;114:18–37. [DOI] [PMC free article] [PubMed] [Google Scholar]
- 25.Jespersen SN, Olesen JL, Hansen B, Shemesh N. Diffusion time dependence of microstructural parameters in fixed spinal cord. Neuroimage 2018;182:329–342. [DOI] [PMC free article] [PubMed] [Google Scholar]
- 26.Lee HH, Papaioannou A, Novikov DS, Fieremans E. In vivo observation and biophysical interpretation of time-dependent diffusion in human cortical gray matter. Neuroimage 2020;222:117054. [DOI] [PMC free article] [PubMed] [Google Scholar]
- 27.Fieremans E, Novikov DS, Jensen JH, Helpern JA. Monte Carlo study of a two-compartment exchange model of diffusion. NMR Biomed 2010;23(7):711–724. [DOI] [PMC free article] [PubMed] [Google Scholar]
- 28.Novikov DS, Fieremans E, Jespersen SN, Kiselev VG. Quantifying brain microstructure with diffusion MRI: Theory and parameter estimation. NMR Biomed 2019;32(4):e3998. [DOI] [PMC free article] [PubMed] [Google Scholar]
- 29.Nilsson M, Latt J, van Westen D, Brockstedt S, Lasic S, Stahlberg F, Topgaard D. Noninvasive mapping of water diffusional exchange in the human brain using filter-exchange imaging. Magn Reson Med 2013;69(6):1573–1581. [DOI] [PubMed] [Google Scholar]
- 30.Bai R, Li Z, Sun C, Hsu YC, Liang H, Basser P. Feasibility of filter-exchange imaging (FEXI) in measuring different exchange processes in human brain. Neuroimage 2020;219:117039. [DOI] [PubMed] [Google Scholar]
- 31.Lampinen B, Szczepankiewicz F, van Westen D, Englund E, P CS, Latt J, Stahlberg F, Nilsson M. Optimal experimental design for filter exchange imaging: Apparent exchange rate measurements in the healthy brain and in intracranial tumors. Magn Reson Med 2017;77(3):1104–1114. [DOI] [PMC free article] [PubMed] [Google Scholar]
- 32.Lasic S, Nilsson M, Latt J, Stahlberg F, Topgaard D. Apparent exchange rate mapping with diffusion MRI. Magn Reson Med 2011;66(2):356–365. [DOI] [PubMed] [Google Scholar]
- 33.Tian X, Li H, Jiang X, Xie J, Gore JC, Xu J. Evaluation and comparison of diffusion MR methods for measuring apparent transcytolemmal water exchange rate constant. J Magn Reson 2017;275:29–37. [DOI] [PMC free article] [PubMed] [Google Scholar]
- 34.Lundell H, Alexander DC, Dyrby TB. High angular resolution diffusion imaging with stimulated echoes: compensation and correction in experiment design and analysis. NMR Biomed 2014;27(8):918–925. [DOI] [PMC free article] [PubMed] [Google Scholar]
- 35.Lasic S, Lundell H, Topgaard D, Dyrby TB. Effects of imaging gradients in sequences with varying longitudinal storage time-Case of diffusion exchange imaging. Magn Reson Med 2018;79(4):2228–2235. [DOI] [PubMed] [Google Scholar]
- 36.Khateri M, Reisert M, Sierra A, Tohka J, Kiselev VG. What Does FEXI Measure? NMR Biomed 2022:e4804. [DOI] [PubMed] [Google Scholar]
- 37.Shepherd TM, Thelwall PE, Stanisz GJ, Blackband SJ. Aldehyde fixative solutions alter the water relaxation and diffusion properties of nervous tissue. Magn Reson Med 2009;62(1):26–34. [DOI] [PMC free article] [PubMed] [Google Scholar]
- 38.Sonderby CK, Lundell HM, Sogaard LV, Dyrby TB. Apparent exchange rate imaging in anisotropic systems. Magn Reson Med 2014;72(3):756–762. [DOI] [PubMed] [Google Scholar]
- 39.Jara H, Wehrli FW. Determination of background gradients with diffusion MR imaging. J Magn Reson Imaging 1994;4(6):787–797. [DOI] [PubMed] [Google Scholar]
- 40.Zhong JH, Kennan RP, Gore JC. Effects of Susceptibility Variations on Nmr Measurements of Diffusion. Journal of Magnetic Resonance 1991;95(2):267–280. [Google Scholar]
- 41.Szczepankiewicz F, Westin CF, Nilsson M. Maxwell-compensated design of asymmetric gradient waveforms for tensor-valued diffusion encoding. Magn Reson Med 2019;82(4):1424–1437. [DOI] [PMC free article] [PubMed] [Google Scholar]
- 42.Kinchesh P, Kleinnijenhuis M, Miller K, Smart S. Minimizing diffusion encoding of slice selection in stimulated echo imaging. In Proceedings of the 23rd Annual Meeting of ISMRM. Toronto, Canada, 2015. p 2791. [Google Scholar]
- 43.Veraart J, Poot DH, Van Hecke W, Blockx I, Van der Linden A, Verhoye M, Sijbers J. More accurate estimation of diffusion tensor parameters using diffusion Kurtosis imaging. Magn Reson Med 2011;65(1):138–145. [DOI] [PubMed] [Google Scholar]
- 44.Veraart J, Sijbers J, Sunaert S, Leemans A, Jeurissen B. Weighted linear least squares estimation of diffusion MRI parameters: strengths, limitations, and pitfalls. Neuroimage 2013;81:335–346. [DOI] [PubMed] [Google Scholar]
- 45.Papaioannou A, Novikov DS, Fieremans E, Boutis GS. Observation of structural universality in disordered systems using bulk diffusion measurement. Phys Rev E 2017;96(6–1):061101. [DOI] [PMC free article] [PubMed] [Google Scholar]
- 46.Li Z, Pang Z, Cheng J, Hsu YC, Sun Y, Ozarslan E, Bai R. The direction-dependence of apparent water exchange rate in human white matter. Neuroimage 2022;247:118831. [DOI] [PubMed] [Google Scholar]
- 47.Nilsson M, Latt J, Nordh E, Wirestam R, Stahlberg F, Brockstedt S. On the effects of a varied diffusion time in vivo: is the diffusion in white matter restricted? Magn Reson Imaging 2009;27(2):176–187. [DOI] [PubMed] [Google Scholar]
- 48.Quirk JD, Bretthorst GL, Duong TQ, Snyder AZ, Springer CS Jr., Ackerman JJ, Neil JJ. Equilibrium water exchange between the intra- and extracellular spaces of mammalian brain. Magn Reson Med 2003;50(3):493–499. [DOI] [PubMed] [Google Scholar]
- 49.Pfeuffer J, Provencher SW, Gruetter R. Water diffusion in rat brain in vivo as detected at very large b values is multicompartmental. MAGMA 1999;8(2):98–108. [DOI] [PubMed] [Google Scholar]
- 50.Jelescu IO, de Skowronski A, Geffroy F, Palombo M, Novikov DS. Neurite Exchange Imaging (NEXI): A minimal model of diffusion in gray matter with inter-compartment water exchange. Neuroimage 2022;256:119277. [DOI] [PMC free article] [PubMed] [Google Scholar]
- 51.Scher Y, Reuveni S, Cohen Y. Constant gradient FEXSY: A time-efficient method for measuring exchange. J Magn Reson 2020;311:106667. [DOI] [PubMed] [Google Scholar]
- 52.Williamson NH, Ravin R, Benjamini D, Merkle H, Falgairolle M, O’Donovan MJ, Blivis D, Ide D, Cai TX, Ghorashi NS, Bai R, Basser PJ. Magnetic resonance measurements of cellular and sub-cellular membrane structures in live and fixed neural tissue. Elife 2019;8. [DOI] [PMC free article] [PubMed] [Google Scholar]
- 53.Olesen JL, Ostergaard L, Shemesh N, Jespersen SN. Diffusion time dependence, power-law scaling, and exchange in gray matter. Neuroimage 2022;251:118976. [DOI] [PMC free article] [PubMed] [Google Scholar]
- 54.Pfeuffer J, Flogel U, Leibfritz D. Monitoring of cell volume and water exchange time in perfused cells by diffusion-weighted 1H NMR spectroscopy. NMR Biomed 1998;11(1):11–18. [DOI] [PubMed] [Google Scholar]
- 55.Pfeuffer J, Flogel U, Dreher W, Leibfritz D. Restricted diffusion and exchange of intracellular water: theoretical modelling and diffusion time dependence of 1H NMR measurements on perfused glial cells. NMR Biomed 1998;11(1):19–31. [DOI] [PubMed] [Google Scholar]
- 56.Bai R, Springer CS Jr., Plenz D, Basser PJ. Fast, Na(+) /K(+) pump driven, steady-state transcytolemmal water exchange in neuronal tissue: A study of rat brain cortical cultures. Magn Reson Med 2018;79(6):3207–3217. [DOI] [PubMed] [Google Scholar]
- 57.Yang DM, Huettner JE, Bretthorst GL, Neil JJ, Garbow JR, Ackerman JJH. Intracellular water preexchange lifetime in neurons and astrocytes. Magn Reson Med 2018;79(3):1616–1627. [DOI] [PMC free article] [PubMed] [Google Scholar]
- 58.Benjamini D, Komlosh ME, Basser PJ. Imaging Local Diffusive Dynamics Using Diffusion Exchange Spectroscopy MRI. Phys Rev Lett 2017;118(15):158003. [DOI] [PMC free article] [PubMed] [Google Scholar]
- 59.Cai TX, Benjamini D, Komlosh ME, Basser PJ, Williamson NH. Rapid detection of the presence of diffusion exchange. J Magn Reson 2018;297:17–22. [DOI] [PMC free article] [PubMed] [Google Scholar]
- 60.Ning L, Nilsson M, Lasic S, Westin CF, Rathi Y. Cumulant expansions for measuring water exchange using diffusion MRI. J Chem Phys 2018;148(7):074109. [DOI] [PMC free article] [PubMed] [Google Scholar]
- 61.Ibata K, Takimoto S, Morisaku T, Miyawaki A, Yasui M. Analysis of aquaporin-mediated diffusional water permeability by coherent anti-stokes Raman scattering microscopy. Biophys J 2011;101(9):2277–2283. [DOI] [PMC free article] [PubMed] [Google Scholar]
- 62.Debacker C, Djemai B, Ciobanu L, Tsurugizawa T, Le Bihan D. Diffusion MRI reveals in vivo and non-invasively changes in astrocyte function induced by an aquaporin-4 inhibitor. PLoS One 2020;15(5):e0229702. [DOI] [PMC free article] [PubMed] [Google Scholar]
- 63.Mukherjee A, Wu D, Davis HC, Shapiro MG. Non-invasive imaging using reporter genes altering cellular water permeability. Nat Commun 2016;7:13891. [DOI] [PMC free article] [PubMed] [Google Scholar]
- 64.Ludwig D, Laun FB, Ladd ME, Bachert P, Kuder TA. Apparent exchange rate imaging: On its applicability and the connection to the real exchange rate. Magn Reson Med 2021;86(2):677–692. [DOI] [PubMed] [Google Scholar]
Associated Data
This section collects any data citations, data availability statements, or supplementary materials included in this article.
Supplementary Materials
Supporting Information Figure S1: Sagittal MD maps acquired in the FEXI experiment with phase cycling and positive/negative crusher gradients (slice thickness of 1, 1.5 and 3mm for mixing time from 35ms to 100ms).
Supporting Information Figure S2 t-dependent kurtosis changes in the ex vivo mouse cerebral cortex. A: t-dependence of mean, radial and axial kurtosis in the cortex. B-C: Estimated exchange parameters using two and three-parameter fittings.
Supporting Information Figure S3: Power-law behaviors of diffusivity (A) and kurtosis (B) under three structural disorder classes in the cerebral cortex. The diffusivity and kurtosis measurements are plotted as functions of t−1/2 for d = 1, for d = 2, and t−1 for d = 3, respectively, respectively.
Supporting Information Table S1: MRI-based estimates of tissue water exchange rate and time in the literature.
Supporting Information Table S2: The propagation of noise from raw data to estimated FEXI and DKI parameters. The FEXI and DKI(t) parameters from raw data without added noise (SNR = 123 in the non-diffusion-weighted b0 images, n=7) are compared to parameters from raw data with added noise (SNR = 77 and 52, n=7, 10 repetitions per subjects).
Supporting Information Table S3: F-test result to compare three models (Kärger model, modified Kärger model and constant model) of kurtosis fitting in corpus callosum of ex vivo mouse brains.
Supporting Information Table S4: F-test result to compare three classes (d=1,2 and 3) of structural disorders in corpus callosum of ex vivo mouse brains.
Supporting Information Table S5: Root mean square errors (RMSE) of fitting for three classes (d=1, 2, 3) of structural disorders in corpus callosum and cerebral cortex.