

Abstract
BACKGROUND/AIMS:
Although T-cell intrinsic expression of G9a has been associated with murine intestinal inflammation, mechanistic insight into the role of this methyltransferase in human T-cell differentiation is ill defined, and manipulation of G9a function for therapeutic use against inflammatory disorders is unexplored.
METHODS:
Human naive T cells were isolated from peripheral blood and differentiated in vitro in the presence of a G9a inhibitor (UNC0642) before being characterized via the transcriptome (RNA sequencing), chromatin accessibility (assay for transposase-accessible chromatin by sequencing), protein expression (cytometry by time of flight, flow cytometry), metabolism (mitochondrial stress test, ultrahigh performance liquid chromatography–tandem mas spectroscopy) and function (T-cell suppression assay). The in vivo role of G9a was assessed using 3 murine models.
RESULTS:
We discovered that pharmacologic inhibition of G9a enzymatic function in human CD4 T cells led to spontaneous generation of FOXP3+ T cells (G9a-inibitors–T regulatory cells [Tregs]) in vitro that faithfully reproduce human Tregs, functionally and phenotypically. Mechanistically, G9a inhibition altered the transcriptional regulation of genes involved in lipid biosynthesis in T cells, resulting in increased intracellular cholesterol. Metabolomic profiling of G9a-inibitors–Tregs confirmed elevated lipid pathways that support Treg development through oxidative phosphorylation and enhanced lipid membrane composition. Pharmacologic G9a inhibition promoted Treg expansion in vivo upon antigen (gliadin) stimulation and ameliorated acute trinitrobenzene sulfonic acid–induced colitis secondary to tissue-specific Treg development. Finally, Tregs lacking G9a expression (G9a-knockout Tregs) remain functional chronically and can rescue T-cell transfer–induced colitis.
CONCLUSION:
G9a inhibition promotes cholesterol metabolism in T cells, favoring a metabolic profile that facilitates Treg development in vitro and in vivo. Our data support the potential use of G9a inhibitors in the treatment of immune-mediated conditions including inflammatory bowel disease.
Keywords: Regulatory T Cells, Cholesterol, Lipid Metabolism, Inflammatory Bowel Disease
Graphical Abstract

Cell fate decisions determining adaptive T-cell differentiation are critical to immune-mediated disease, including inflammatory bowel diseases (IBD).1 Chronic intestinal inflammation seen in IBD patients results from both functional and quantitative disturbances in resident effector and regulatory cells.2 Modern immunotherapies targeting cytokine or cell trafficking are insufficiently effective in approximately two thirds of patients, resulting in a significant unmet clinical need.3 Therefore, precise therapies targeting in vivo adaptive T-cell development to generate immunoregulatory cellular phenotypes would be a considerable advancement for the field.
Regulatory T cells (Tregs) are a subset of CD4 T cells responsible for the establishment and maintenance of immune tolerance. The development and function of Tregs rely on the expression of the lineage-defining transcription factor X chromosome–encoded forkhead domain-containing protein (FOXP3).4 FOXP3 expression is induced upon stimulation of the T-cell receptor (TCR) and the costimulatory molecule CD28 in the presence of Treg-promoting cytokines, namely, interleukin (IL) 2 and transforming growth factor beta (TGF-β).5 In addition to a well-characterized transcriptional program driving regulatory function, Tregs have a metabolic signature distinct from other CD4+ T-cell subsets.6 Tregs efficiently use triglycerides and cholesterol esters stored in lipid droplets (LDs) for mitochondrial respiration, whereas other proinflammatory subtypes undergo aerobic glycolysis to fulfill their bioenergetic needs.7 Evidence now indicates that these metabolic pathways are not simply the outcome of the transcriptional program defining T-cell phenotype (e.g., T helper [Th] type 17 vs Treg) but have a more global role that actively contributes to transcriptional regulation, phenotypic derivation, and function.8 However, mechanistic links among environmental cues, intracellular metabolic sensors, and the epigenetic regulators of the gene expression program driving the Treg development are markedly limited.
Enzyme-mediated posttranslational modifications of histones provide epigenetic information to regulate chromatin configuration and gene transcription. Dimethylation of histone H3 lysine 9 (H3K9me2), catalyzed by the histone methyltransferase G9a and its related G9a-like protein (GLP), has been shown to inhibit gene expression via recruitment of heterochromatin proteins (HP1) that impair chromatin accessibility.9 Recently, T-cell–intrinsic G9a expression has been linked to T-cell differentiation fates and induction of colitis.10,11 However, limited mechanistic insight into its modulation of immune function exists, and harnessing this epigenetic regulator for therapeutic intent for immune-mediated diseases offers a potential novel approach.
In the current study, we investigated the role of G9a in human induced Treg (iTreg) development through genomic, metabolic, functional, and in vivo assays. We discovered that pharmacologic G9a inhibition initiates spontaneous iTreg derivation, both in vitro and in vivo. Integrated genome-wide transcriptional (RNA sequencing [RNA-seq]), chromatin accessibility (assay for transposase-accessible chromatin by sequencing [ATAC-seq]), and metabolomic data converged on G9a-mediated regulation of genes involved in cholesterol biosynthesis during Treg development, thereby facilitating iTreg differentiation and function. To assess the potential of these findings for therapeutic benefit, we have demonstrated that G9a inhibition leads to Treg derivation in vivo and that these cells can control acute and chronic colitis. The data presented here advance our mechanistic knowledge of the role of G9a in cholesterol biosynthesis and Treg biology, as well as support the use of G9a inhibitors in the development of cell-based therapies for immune-mediated diseases, including IBD.
Materials and Methods
Isolation of Naive T Cells from Human Peripheral Blood Mononuclear Cells
Human peripheral blood mononuclear cells (PBMCs) were isolated from blood obtained from the Department of Pathology and Laboratory Medicine, Mayo Clinic. CD4+CD45RA+ cells were isolated using the human CD4+ T Cell Isolation kit (Miltenyi Biotec) and CD45RA Microbeads (Miltenyi Biotec) (Supplementary Methods).
Primary Cell Cultures, Differentiation of CD4+ T Cells, and Pharmacologic G9a Inhibition
After bead isolation, naive T cells (nT cells) were cultured for up to 7 days in cRPMI media, plate-bound anti-human CD3 (2 μg/mL), soluble anti-human CD28 (2 μg/mL), stimulating cytokines (IL2, 10 ng/mL and TGF-β1, 5 ng/mL) and UNC0642 (2 μmol/L). During the differentiation process, media was replaced on day 3, and cells were replated on day 5 in cRMPI with soluble anti-CD28 on freshly coated anti-CD3 24-well plates until day 7 for harvest. Anti–human TGF-β1 neutralizing antibodies (2.5 μg/mL) and the 3-hydroxy 3-methylglutaryl coenzyme A (HMG-CoA) inhibitor simvastatin (5 μmol/L) were added to cultures to address specific experimental questions. Reagents are summarized in Supplementary Table 1.
T-Cell Suppression Assay
As previously described,12 mixed leukocyte reactions were performed in round-bottom 96-well plates using CD4+CD25− T responder cells irradiated (3300 rad) T-cell–depleted antigen-presenting cells isolated from the same PBMCs. Experimentally differentiated T cells were added to the cell culture at titrations of 1:8 to 1:1 in RMPI 10% fetal calf serum medium, with soluble anti-human CD3 (2.5 μg/mL) and anti-human CD28 (2.5 μg/mL). Proliferation was read at day 7 upon addition of 1 μCi tritiated thymidine.
Flow Cytometry
Cell surface, transcription factors, and intracellular lipid contents were directly stained with the indicated antibodies in stain buffer. For intracellular staining, cells were fixed and permeabilized with buffer and then stained with relevant fluorochrome conjugated antibodies. Antibodies used for human studies can be found in Supplementary Table 2. Cells were washed with permeabilization buffer to remove unbound antibodies. Finally, cells were subjected to flow cytometry and electronically gated on live cells for analysis.
Cytometry by Time of Flight
High-dimensional mass cytometry was used to assess T-cell surface markers and intracellular cytokines under the guidance of the Mayo Clinic Immune Monitoring Core. Each sample was fixed and individually barcoded with a unique combination of palladium isotopes. All samples were pooled and stained with a custom panel of 20 heavy metal conjugated antibodies (Supplementary Table 3), and data were obtained on a Helios mass cytometer (Fluidigm). Data analysis was performed using CytoBank.
Immunoblotting
Primary human T cells were harvested, washed with cold phosphate-buffered saline (PBS) and lysed with RIPA lysis buffer containing 50 mmol/L Tris-HCL; pH 7.4, 1% NP-40, 150 nmol/L NaCl, and 2 mmol/L EDTA. Protein was detected by Western blot using the antibodies indicated in Supplementary Table 2.
Labeling of Cholesterol and Neutral Lipids in Regulatory T Cells
To visualize intracellular cholesterol ester, cells were pulse loaded with 7.5 μmol/L Bodipy FL C12 cholesteryl ester for 2 hours at 37°C before fixation in 3.7% paraformaldehyde. Staining of free cholesterol was performed in fixed cells using 50 μg/mL filipin for 30 minutes at 37°C in PBS. Staining of neutral lipids was performed with LipidTox used at 1:1000 concentration according to the manufacturer’s recommended protocol. Images were acquired on a Zeiss LSM780 confocal microscope using a 40× oil 1.4 NA objective lens.
RNA Isolation, Complementary DNA Synthesis, and Quantitative Real-Time Polymerase Chain Reaction
Total RNA was extracted using the RNeasy Mini Kit (Qiagen), and complementary DNA was synthesized using the SuperScript Kit III First-Strand (Invitrogen). Reverse transcription products were amplified in a 96-well thermal cycler with Express SYBR Green ER Quantitative PCR Supermaster Mix (Invitrogen) and the primers in Supplementary Table 4.
RNA Sequencing
RNA was isolated from cells harvested after 24 hours of differentiation, and library preparation was performed using Illumina TruSeq Stranded messenger RNA (mRNA) prep according to the manufacturer’s description (catalog no. 20020594). Sequencing and bioinformatics analysis were conducted with the Mayo Medical Genomics Facility, as described in the Supplementary Method (Gene Expression Omnibus [GEO] Super Series: GSE196904).
Assay for Transposase-Accessible Chromatin by Sequencing
A total of 100,000 cells harvested after 24 hours of differentiation were submitted for ATAC-seq following the published protocol.13 Amplified libraries were purified and sequenced to 51 base pairs from both ends on an Illumina HiSeq 4000 instrument in the Mayo Clinic Center for Individualized Medicine Medical Genomics Facility. Bioinformatic analysis is detailed in the Supplementary Methods (GSE196903).
Metabolomics: Ultrahigh Performance Liquid Chromatography–Tandem Mass Spectroscopy
Metabolomics was conducted in partnership with Metabolon’s proprietary analysis as previously described.14 All methods used a Waters Acquity ultrahigh performance liquid chromatograph and a Thermo Fisher Scientific Q-Exactive high-resolution/accurate mass spectrometer interfaced with a heated electrospray ionization (HESI-II) source and Orbitrap mass analyzer operated at 35,000 mass resolution. Raw data files are archived, extracted, and analyzed as described in the Supplementary Methods. Data are available on Metabolomics workbench (ID 3079).
Mitochondrial Stress Test
XFe-96 Extracellular Flux Analyzers (Seahorse Bioscience, Agilent Technologies) were used to define OCRs in real time. Then, 300,000 cells/well were seeded in XF96 Cell Culture Microplates before perturbation experiments. Mitochondrial perturbation experiments with cells were carried out in XF media containing glucose (25 mmol/L), pyruvate (2 mmol/L) and l-glutamine (0.5 mmol/L) by sequential addition of 1 μmol/L oligomycin (Sigma-Aldrich), 1 μmol/L carbonyl cyanide 4-(trifluoromethoxy)phenylhydrazone (FCCP) (Sigma-552 Aldrich), and 0.5 μmol/L rotenone/antimycin A (Sigma-Aldrich). Data presented are representative of 3 independent experiments from biological replicates, and mean ± standard error of the mean values are from at least 6–12 technical replicates.
Animal Models
All animal and experimental work was done in accordance with and approved by the Mayo Clinic Institutional Animal Care and Use Committee, protocol A00001268-16-R19.
Gliadin Immunization Model.
NOD.DQ8.ABo transgenic mice lacking endogenous class II molecules have previously been characterized.15 Briefly, animals were immunized with pepsin trypsin–digested gliadin injected subcutaneously into the base of the tail and treated with UNC0642 (10 mg/kg) delivered intraperitoneally (IP) starting 3 days before immunization and continued for a total of 10 days before being killed. Lumbar lymph nodes and spleens were harvested for lymphocyte isolation using murine magnetic bead isolation kits (Supplementary Table 1).16 Immunofluorescence was performed as previously described,17 using anti-H3K9me2 antibodies followed by secondary antibody staining.
Trinitrobenzene Sulfonic Acid Colitis Model.
Wild-type (WT) mice were briefly anesthetized via isoflurane and received either intracolonic saline (0.05–0.1 mL) (control) or trinitrobenzene sulfonic acid (TNBS) (5 mg in 0.1 mL 30% ethanol) via blunt flexible polyethylene catheter. Starting 3 days before enema induction, mice were treated with UNC0642 (10 mg/kg) or vehicle (PBS) IP injections daily for the duration of the experiment. At the end of 10 days, or prior if >15% of body weight was lost, mice were killed for organ harvest and analysis. To visualize FOXP3 within spinal and intestinal tissues, immunohistochemistry was performed as previously described,18 using antibodies as outlined in Supplementary Table 2.
T-Cell Transfer Model of Chronic Colitis.
Chronic colitis was induced via adoptive transfer of naive CD4+CD45RBhigh T cells derived from WT donors using our previously published method.16 Briefly, 5 × 10⁵ CD45RBhigh cells sorted from spleens harvested from WT mice were injected into RAG-1 mice (The Jackson Laboratory) at day 0 to induce colitis. GFP+ Treg cells were sorted from the spleens of either WT or G9a-knockout (G9aKO) mice, and 2.5 × 10⁵ GFP+ cells were injected IP for prevention (day 0) or rescue (week 3). The histologic disease activity (MCHI) and disease activity index (including stool consistency, hunching posture, degree of wasting, and colonic stiffness) were determined by a pathologist and lab personnel blinded to the study conditions.
Mouse Strains.
FOXP3-CRE (B6-Tg[Foxp3EGFP-cre]) 1cJbs/J mice were initially purchased from The Jackson Laboratory and back-crossed to a C57BL/6 background in conventional housing conditions in the Mayo Clinic Animal Facility. The EHMT2-floxed mice were kindly provided by Dr Gwen Lomberk and crossed with FOXP3-CRE to generate the Treg G9aKO referred to earlier.19
Statistical Analysis
Data are expressed as mean ± standard error of the mean unless otherwise specified. Statistical analysis was performed using GraphPad Prism Software (GraphPad Software, Inc). Analysis of variance with Bonferroni post test for multiple groups/timepoints and/or Student t test were used with P < .05 in 2-tailed analysis.
Transcript Profiling
Data sets used for RNA-seq and ATAC-seq analyses have been uploaded to the GEO under the Super Series accession number GSE196904. RNA-seq data can be found under the accession number GSE196226 (https://www.ncbi.nlm.nih.gov/geo/query/acc.cgi?acc=GSE196226). ATAC-seq data can be found under accession number GSE196903 (https://www.ncbi.nlm.nih.gov/geo/query/acc.cgi?acc=GSE196903). Metabolomic data have been uploaded to the metabolomics workbench under data track ID 3079 (www.metabolomicsworkbench.org).
Data Transparency Statement
In addition to the publicly available data sets mentioned, additional data sets generated during and/or analyzed during the current study are available from the corresponding author on reasonable request.
Results
G9a Inhibition Leads to Robust FOXP3 Expression in Human CD4+ T Cells
To understand the epigenetic regulation of T-cell fate decisions, we characterized the changes in chromatin accessibility as human naive CD4 T cells (nT cells), obtained from healthy PBMCs, differentiate into iTregs by performing hierarchical clustering on all ATAC peaks in both conditions (Figure 1A). We identified differences in open (25,031) and closed (11,454) ATAC regions in iTregs compared to nT cells. We subsequently performed pathway analysis using the gene list associated with chromatin regions gained or lost during iTreg differentiation (Figure 1A, red and green, respectively). Intriguingly, in addition to several expected immunologic pathways, H3K9 methylation emerged as a significantly associated biological process for the lost chromatin regions (Figure 1B). Congruently, we found that human Treg cells show a decrease in global H3K9me2 during the differentiation from nT cells over 5 days (Figure 1C). Our findings linking levels of H3K9 methylation with Treg developmental biology in human T cells are consistent with mouse-derived data in which G9a, a key regulator of this histone mark, was implicated in murine Treg development.11
Figure 1.
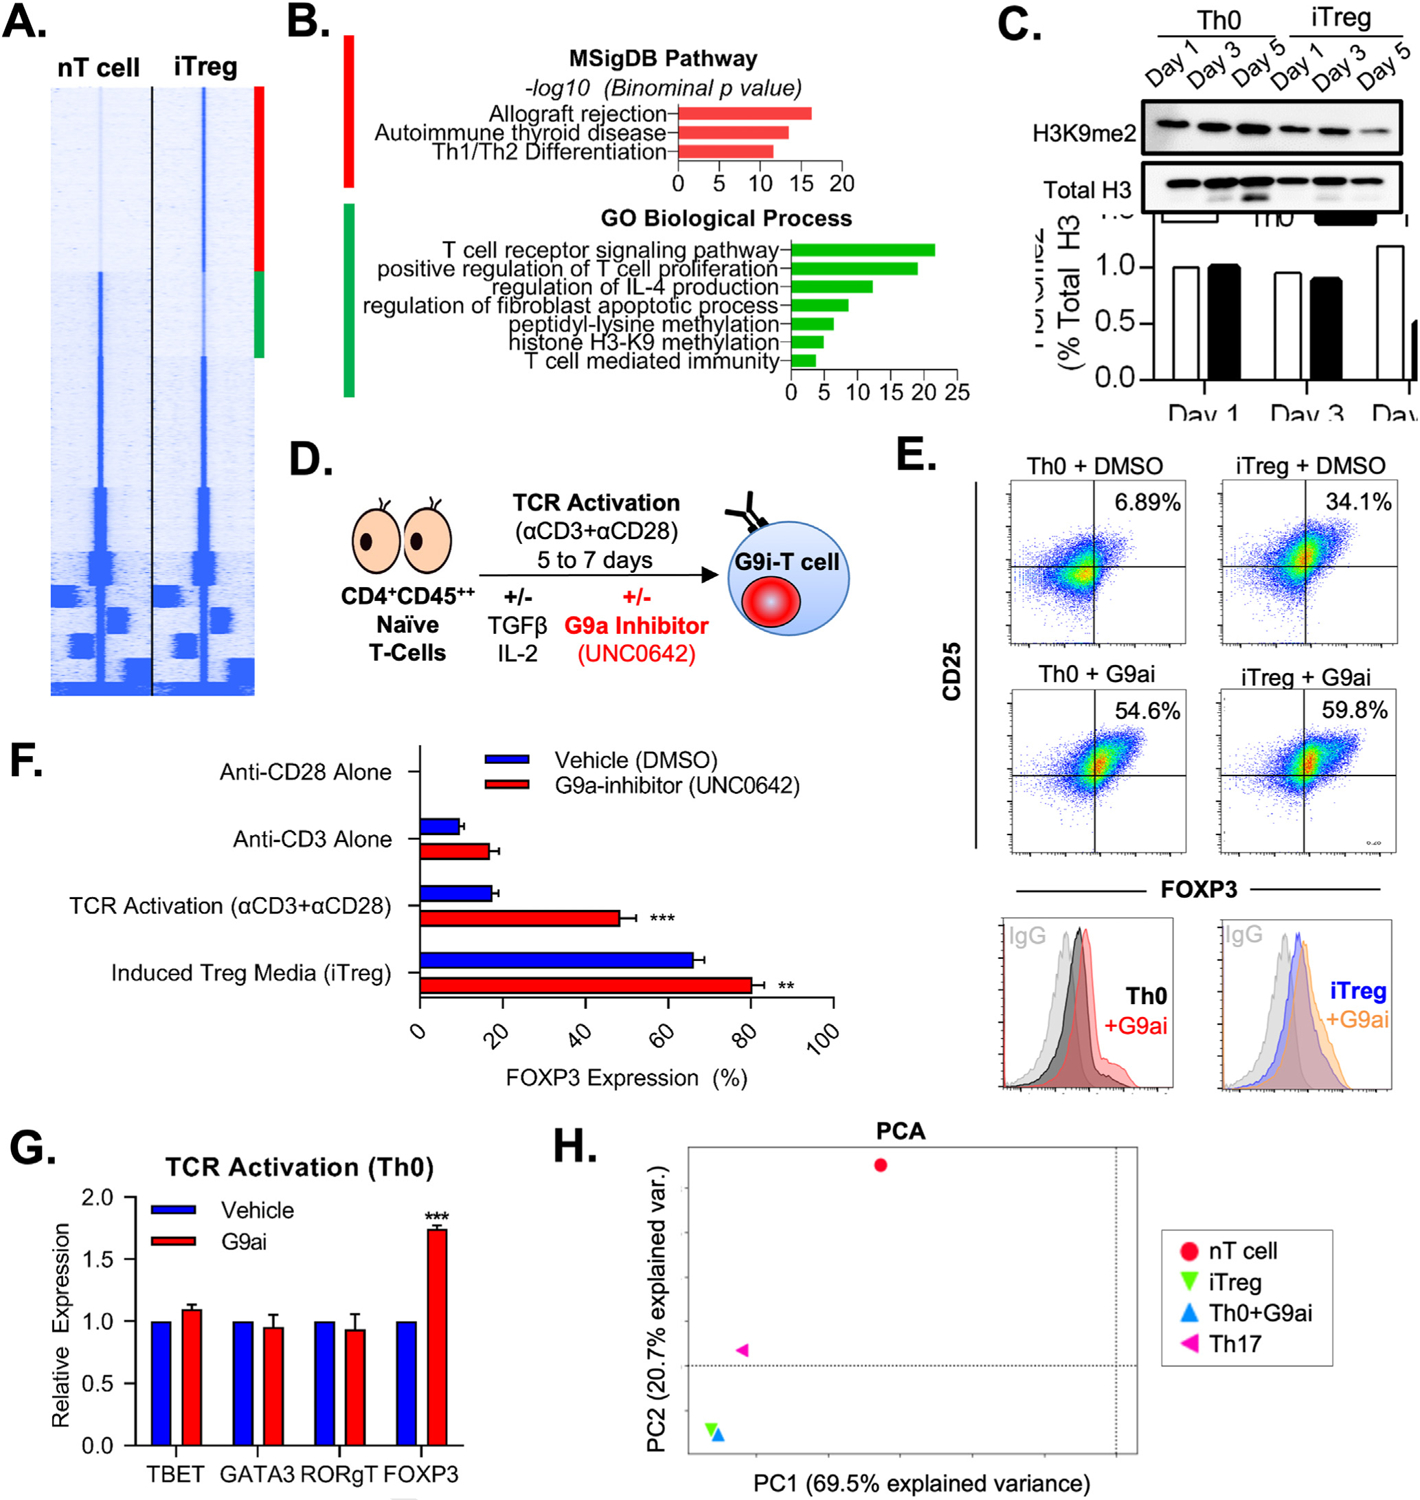
G9a inhibition spontaneously drives FOXP3 expression in T cells. (A) Heat map of ATAC-seq comparing human nT cells and iTregs shows 2 distinct clusters of open (red) and closed (green) chromatin. (B) Pathway analysis shows that H3K9 methylation is an important biologic process within distinct chromatin landscape peaks between nT cells and iTregs. (C) Immunoblotting confirmed a decrease in H3K9me2 during iTreg development. (D) nT cells were treated in the presence of G9ai (UNC0642) under Th0 (anti-CD3 and anti-CD28 costimulation) iTreg conditions (supplementary TGFβ and IL2). (E) Representative flow cytometry of FOXP3 and CD25 characterizing increased Treg differentiation under G9ai, which occurred even in the absence of stimulating cytokines (Th0+G9ai). Representative histograms display FOXP3 expression per group compared to immunoglobulin G isotype control. (F) Quantification by flow cytometry confirms significantly higher FOXP3 expression in UNC0642-treated cells in either the absence or presence of external cytokines but not with anti-CD28 or anti-CD3 stimulation alone. (G) Th0+G9ai cells show increased protein expression of FOXP3 but not other T-cell lineage–specific transcription factors. (H) Principal component analysis of ATAC-seq performed at the end differentiation shows that Th0+G9ai have a chromatin landscape signature identical to that of iTregs and contrastingly different from that of Th17 and nT+cells. **P < .01, ***P < .001. DMSO, dimethyl sulfoxide; PC, principal component; PCA, principal component analysis.
To examine the role of G9a during human Treg differentiation, we exposed nT cells to experimental conditions in the presence of various G9a inhibitors (G9ai). We used the inhibitor UNC0642 given its high selectivity for the G9a/GLP complex and established in vivo bioavailability (Figure 1D).20 Treatment of nT cells with G9ai under iTreg-stimulating conditions (media containing TGF-β, IL2, and TCR stimulation and costimulation) increased FOXP3 protein expression when compared with vehicle (dimethyl sulfoxide)–treated cells. Notably, we found that nT cells spontaneously polarized to a Treg phenotype upon G9a inhibition and full TCR activation (Th0: anti-CD28 and anti-CD3 antibodies) in the absence of external TGF-β1 and IL2 supplementation (Figure 1E). TCR stimulation and costimulation together (Th0, +G9ai: 48.4% vs vehicle: 17.6%; P = .001), but not independently (only anti-CD28, +G9ai: 0.3% vs vehicle: 0.1%; only anti-CD3, +G9ai: 17.0% vs vehicle: 9.7%; P > .05), were required to promote FOXP3 expression in the setting of G9a inhibition (Figure 1F). Moreover, treatment of nT cells with G9ai and full TCR activation (Th0+G9ai), did not lead to expression of other lineage-specific transcription factors, including TBET, GATA3, and RORgT, demonstrating specificity to FOXP3 (Figure 1G).
To understand the impact of G9a inhibition on T-cell chromatin accessibility, we compared inhibitor-generated FOXP3+ cells (Th0+G9ai) to our previously published ATAC-seq data derived from Treg, Th17, and nT cells.16 Chromatin accessibility of fully differentiated Th0+G9ai cells overlapped that of iTregs; however, it was remarkably distinct from nT cells and Th17 (Figure 1H). Interestingly, although changes in FOXP3 mRNA expression occurred at as early as 24 hours of G9a inhibition, distinct from observations in mice, we did not observe loss in H3K9me2 at the FOXP3 core promoter (Supplementary Figure 1A and B).11 Because FOXP3 did not appear to be directly regulated by G9a-mediated H3K9me2 during the early stages of iTreg differentiation, we assessed T-cell global transcriptional changes in response to G9ai.
Cholesterol Metabolism in T Cells Is Regulated by the Histone Methyltransferase Activity of G9a
We performed RNA-seq of CD4 T cells after 24 hours of G9a inhibition. In Figure 2A, the heat map indicated a total of 194 differentially expressed genes (DEGs) of inhibitor-and vehicle-treated T cells, either under Th0 or iTreg conditions. Although the dominant effect of G9ai was down-regulated genes (126/194), we have focused on the set of up-regulated DEGs (68/194) after UNC0642 treatment, because the canonical function of G9a has been described to be primarily a repressor of genes.9 Indeed, Ingenuity Pathway Analysis implicated up-regulated DEGs in numerous cholesterol biosynthesis pathways (Figure 2B). Gene set enrichment analysis supported these findings because genes associated with G9ai-treated conditions were enriched within cholesterol homeostasis (Figure 2C and Supplementary Figure 2A) and other lipogenic pathways, including mTORC signaling (Supplementary Figure 2B). Notably, genes encoding for key enzymes of the mevalonate pathway (HMGCS1, HMGCR, FDPS, FDFT1, and SQLE) and other important lipogenic genes (ACAT2, FSAN, and SCD) are up-regulated in G9ai-treated conditions (Figure 2D and Supplementary Figure 2C). EHMT2 transcripts themselves did not change between conditions. These findings suggest an important role for G9a enzymatic function in the expression of genes regulating lipid metabolism in Treg cells.
Figure 2.
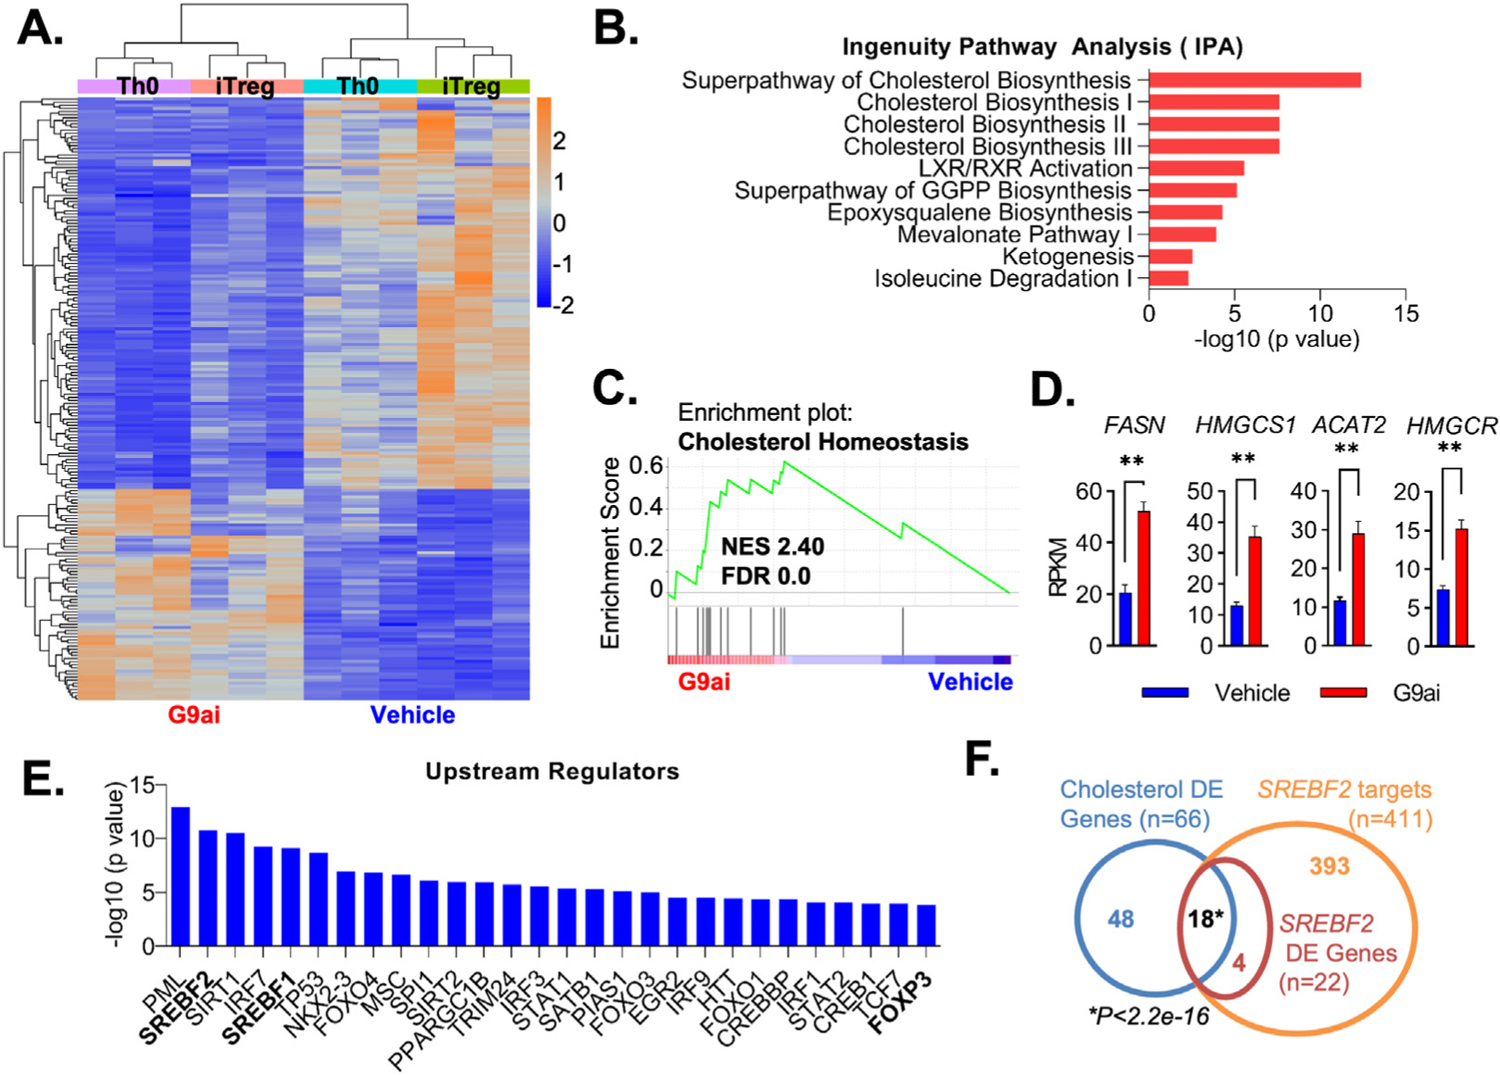
Inhibition of G9a methyltransferase activity promotes cholesterol metabolism pathways during T-cell development. (A) Heatmap from RNA-seq performed in differentiating human nT cells showing clustering DEGs in G9ai-treated vs vehicle conditions. (B) Ingenuity pathway analysis highlighting differentially up-regulated genes under G9ai are associated with cholesterol metabolism pathways. (C) Gene set enrichment analysis further supported differentially up-regulated genes on G9ai conditions are significantly linked to cholesterol homeostasis. (D) Differential expression of individual genes enriched within the cholesterol homeostasis pathway highlights key lipogenic enzymes. (E) Analysis of the top upstream regulators of G9ai-associated genes shows a list of transcription factors that includes FOXP3 and the master lipogenic regulators SREBF1 and SREBF2. (F) Overlap of a list of cholesterol genes differential expressed (blue circle) in G9ai-treated conditions with a publicly available list of SREBF2 targets (orange circle) shows that the significant majority of differentially expressed SREBP2 targets (red circle) are involved in regulating cholesterol metabolism. **P < .01, analyzed using the Mann-Whitney test. DE, differentially expressed; FDR, false discovery rate; NES, XXXX; RPKM, reads per kilobase per million mapped reads.
To identify relevant key transcriptional complexes controlling G9a-regulated Treg cell fate specification, we performed upstream regulatory analysis of our up-regulated DEG set. This analysis revealed 2 main drivers of our DEG set to be SREBF1 and SREBF2. Congruent with the effect of G9ai to drive Treg development, the master lineage transcription factor FOXP3 itself is also present in the list of key regulators (Figure 2E). Encoded by SREBF1 and SREBF2 genes, SREBP1 and 2 function as master transcriptional regulators of genes controlling intracellular cholesterol and other key components of lipid metabolism.21 SREBP2 sustains cellular levels of cholesterol by inducing the expression of enzymes within the mevalonate pathway, including HMGCR, which is necessary for cholesterol biosynthesis.21 Of all 393 SREBF2 known targets (yellow circle, Venn diagram in Figure 2F), 22 were differentially expressed in G9ai T cells (red circle), and the majority of these (18/22) were significantly associated with metabolic gene networks controlling cholesterol biosynthesis differential expression under G9ai inhibition (66/194, blue circle). Collectively, enzymatic inhibition of G9a modulates transcriptional networks of key genes involved in cholesterol biosynthesis, supporting Treg development.
G9a Histone Methyltransferase Activity Is Linked to Lipids Supporting Membrane Development and T Regulatory Cell Bioenergetics
Given that different forms of cholesterol have distinct cellular functions, we performed high-throughput metabolomics to measure the abundance or enrichment of various species of metabolites in G9ai-Tregs. When compared to conventional iTregs (Figure 3A), most differential metabolites in G9ai-treated T cells were indeed within the lipid super class (Th0+G9ai: 49%, iTreg+G9ai: 38%), followed by amino acids (Th0+G9ai: 20%; iTreg+G9ai: 21%). Within lipid subclasses (Figure 3B), G9ai-treated T cells showed a predominance of metabolites associated with cell membrane composition, including sphingomyelins (Th0+G9ai: 17%; iTreg: 13%), ceramides (Th0+G9ai: 15%; iTreg+G9ai:38%), and phosphatidylcholine (Th0+G9ai: 11%; iTreg+G9ai: 4%). This was further confirmed with analysis done at the individual metabolite level (Figure 3C) with congruent changes in specific membrane lipids (ceramide and sphingomyelin) and cholesterol byproducts (eg, cholesterol sulfate). To identify the major pathways affected by G9a inhibition with the highest confidence, we evaluated the combined transcriptomic and metabolic signatures of genes and metabolites, which subsequently was used for pathway enrichment (Supplementary Figure 3A and C). Common pathways enriched in all G9ai-treated (Figure 3D) included steroid and terpenoid backbone biosynthesis, both dependent on the mevalonate pathway of cholesterol homeostasis (Figure 3E and Supplementary Figure 3B). The differential changes that we identified in membrane-associated lipids and cholesterol homeostasis in response to G9ai are important because cholesterol composition influences membrane fluidity and has been shown to modulate the strength of TCR signaling, a function clearly relevant to Treg development.22
Figure 3.
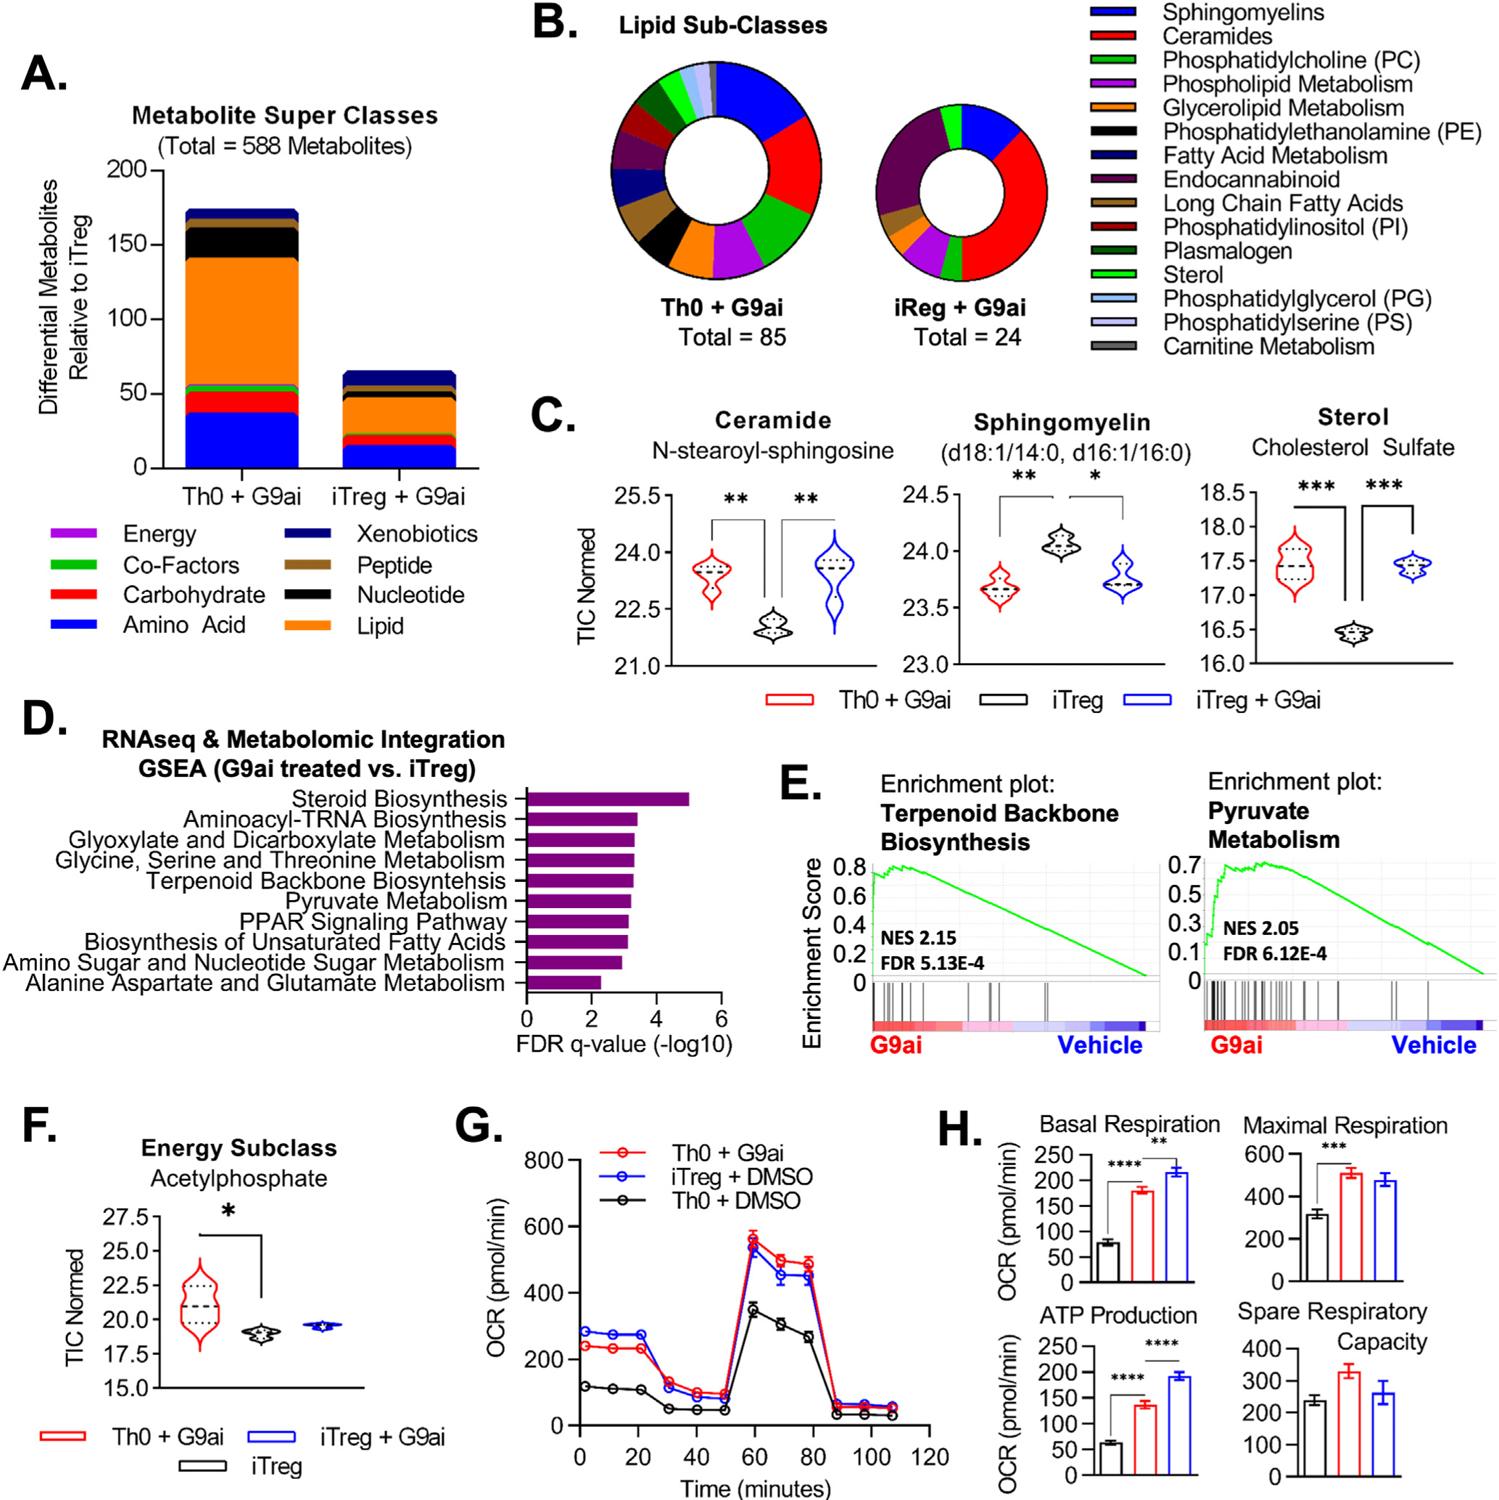
G9a modulates lipid metabolism in T cells, supporting membrane development and a phenotypic Treg energy profile. (A) Summary of differential metabolites evaluated via ultrahigh performance liquid chromatography–tandem mass spectroscopy in inhibitor-treated conditions compared to standard human iTregs. (B) Focused lipid subclasses associated with differential metabolites in G9ai-treated conditions highlighted membrane-associated lipids. (C) Congruent changes were seen in G9ai cells at the individual level of lipid metabolites. (D) Integration of metabolomic and transcriptomic (RNA-seq) data generated a combined database of both genes and metabolites, which was used for pathway enrichment. (E) Top pathways enriched in both G9ai-treated conditions included terpenoid backbone biosynthesis, dependent on the mevalonate pathway of cholesterol biosynthesis, and pyruvate metabolism, which is associated with bioenergetic support. (F) Subanalysis within the energy superclass revealed that acetylphosphate, a precursor of acetyl-CoA, was enriched in Th0+G9ai. **P < .01, *P < .05. (G) Mitochondrial stress test showed that Th0+G9ai cells have increased OXPHOS capacity with equivalent levels to iTregs. (H) When compared to Th0 cells, Th0+G9ai had higher basal respiration levels (P < .0001), adenosine triphosphate-linked respiration levels after challenge with oligomycin (P < .0001), and maximal respiration capacity (P < .001) upon addition of FCCP but no significant differences in spare respiratory capacity after rotenone/antimycin A. OCR, XXXX; TIC, total ion current.
Pathways supporting mitochondrial metabolism were also enriched upon G9a inhibition, including pyruvate metabolism (Figure 3E and Supplementary Figure 3D). Indeed, acetylphosphate, a common intermediary of acetyl-CoA associated with mitochondrial activity,23 was enriched in Th0+G9ai cells (Figure 3F). This is important because membrane lipids (and cholesterol in particular) are critical sources of acetyl-CoA, which, in turn, supports mitochondrial oxidation.24 Thus, both the transcriptome and metabolome of G9ai-Tregs suggest a central role for lipid synthesis and mitochondrial metabolism in the mechanism of G9ai-induced Treg development.
To validate our bioinformatic data, we directly measured oxidative consumption of G9ai-induced Tregs. G9ai-generated FOXP3+ T cells showed identical metabolic bioenergetics when compared to iTregs (Figure 3G). Increased oxidative phosphorylation (OXPHOS) is evident at basal levels but also upon increased demands after challenge with oligomycin, FCCP, and rotenone/antimycin A, resulting in increased adenosine triphosphate production (Figure 3H). Because it is a characteristic of Tregs to preferentially favor OXPHOS and fatty acid oxidation, these findings confirm our bioinformatic data that enriched lipid signatures after G9a inhibition support a phenotypic Treg energy profile. In sum, the integration of metabolic and transcription signatures suggests that G9a regulates a complex metabolic network, predominantly lipids, resulting in changes in membrane composition and supporting a mitochondrial bioenergetic profile, which favors Treg development.
Cholesterol Synthesis Is Required for G9a-Mediated T Regulatory Cell Differentiation
Given our collective results indicating an association between lipid biosynthetic pathways, including cholesterol, and the metabolic byproducts of excess membrane cholesterol (sphingomyelin and ceramides) with G9a methyltransferase activity, we performed confirmatory biochemical assessment of cholesterol within G9ai-treated cells. Confocal-based microscopy analysis of filipin staining and the corresponding stain intensity heatmap on day 5 of differentiation showed a marked increase in intracellular cholesterol, including at the level of the plasma membrane (Figure 4A). The increase in membrane cholesterol in response to G9a inhibition further supports our metabolomic inference that enhanced lipid composition of the cellular bilayer is positively associated with Treg differentiation. A general increase in LDs was also seen in G9ai-treated cells via LipidTox staining, and notably, the majority of the differences were attributed cholesterol-laden LDs (as shown by Bodipy C12 staining [Figure 4A]). Furthermore, quantitatively as measured by flow cytometry, both intracellular cholesterol and neutral lipids in LDs were shown to be increased in G9ai-treated conditions (Figure 4B). This is important because LDs are known to function as energy storage organelles, which can be used to support Treg development and function,25 again establishing the relevance of the bioenergetic pathways highlighted in our metabolomic screen.
Figure 4.
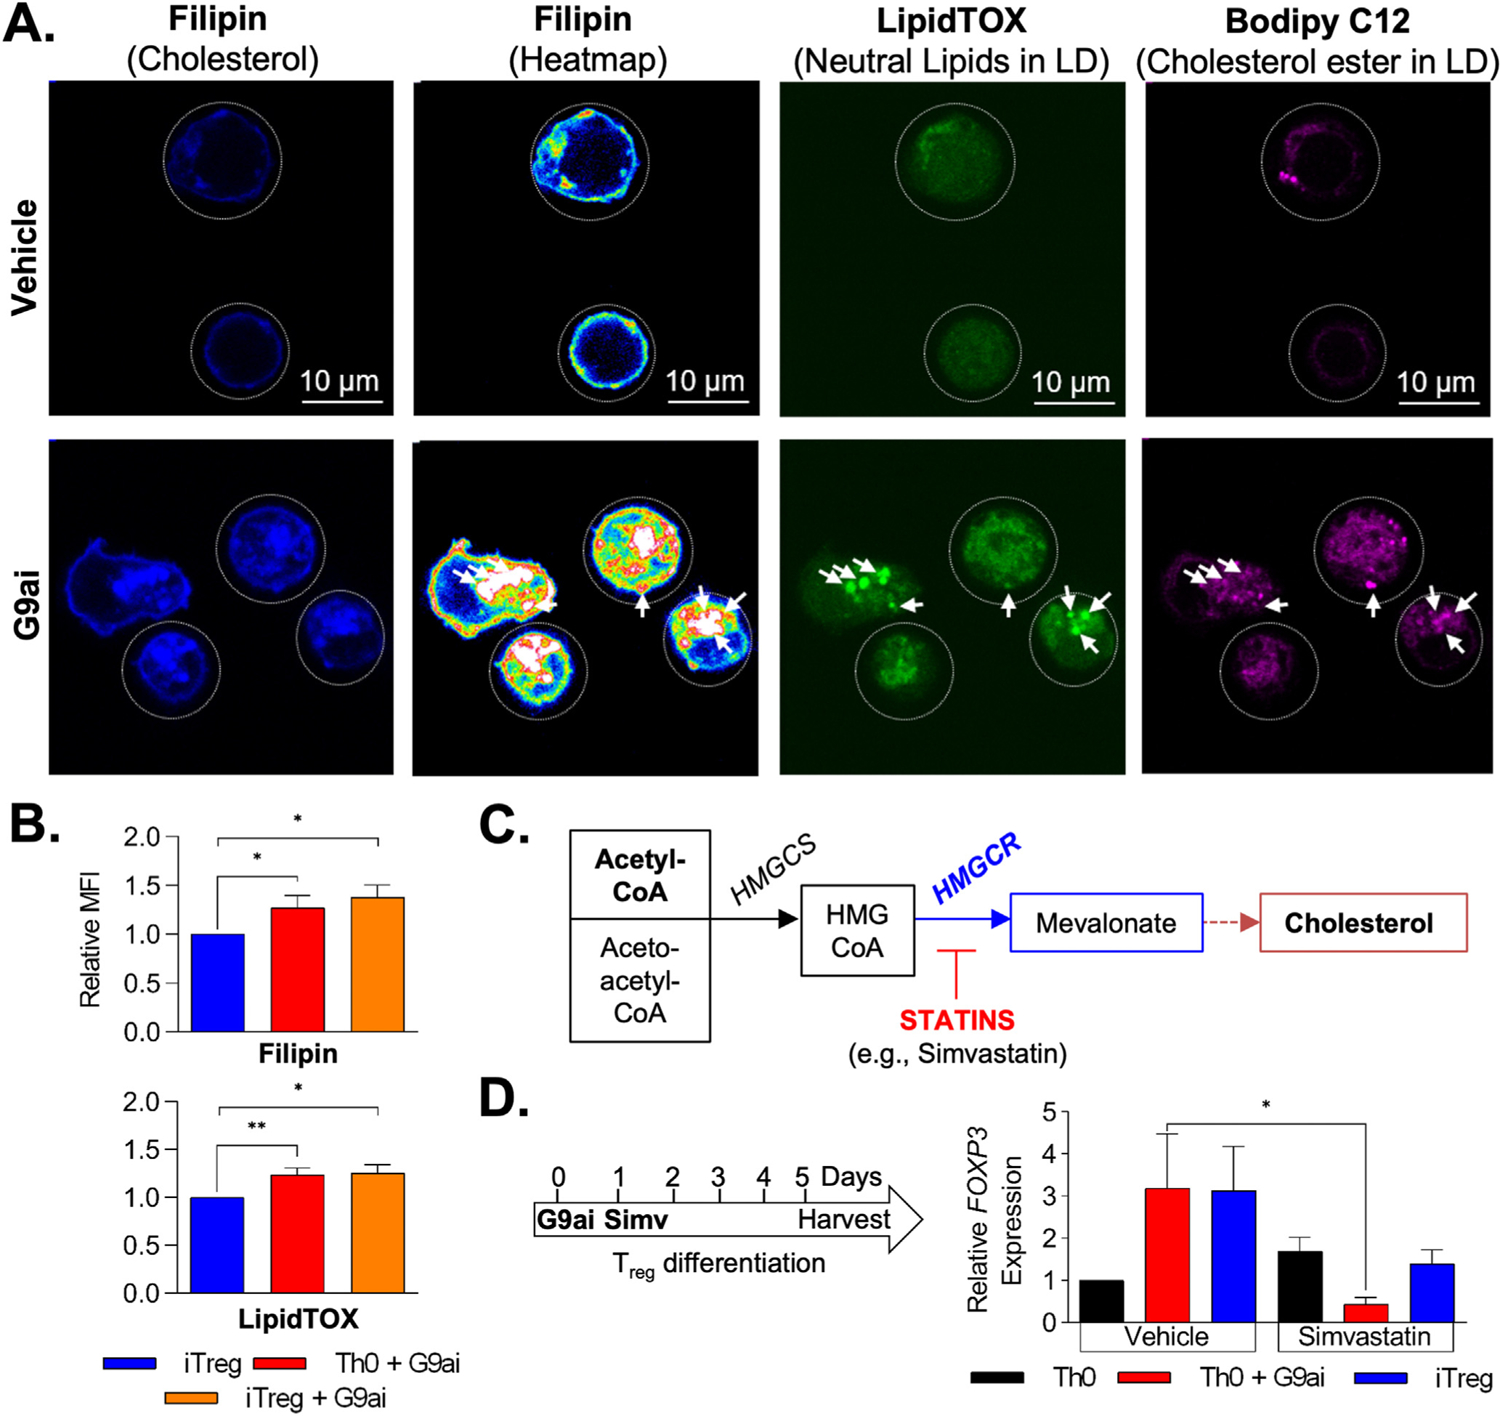
Increase in intracellular cholesterol is required for G9a-mediated Treg development. (A) Confocal microscopy after lipid staining during differentiation confirms increased intracellular cholesterol (filipin) in G9ai–T cells when compared to vehicle-treated cells. Heatmap shows an increase of membrane-bound cholesterol as well as at the level of cholesterol-laden LDs, outlined via LipidTox and Bodipy C12 staining. (B) Flow cytometry quantification confirmed increased intracellular cholesterol (filipin) and neutral lipids within LDs (LipidTOX) in G9ai-treated conditions. (C) Simplified representation of the mevalonate pathway of cholesterol biosynthesis showing key enzymes, HMGCS and HMGCR, that are differentially expressed in G9ai-treated conditions and can be inhibited upstream by statins. (D) Addition of simvastatin (Simv, 5 μmol/L) significantly suppresses G9a-mediated FOXP3 expression. *P < .05 and **P < .01. HMGCR, HMG-CoA synthase reductase; HMGCS, HMG-CoA synthase; MFI, mean fluorescent intensity.
To mechanistically confirm the role of cholesterol in Treg development in the context of G9a inhibition, we cotreated Tregs with an inhibitor (simvastatin) of HMG-CoA reductase, the rate-limiting step of cholesterol biosynthesis (Figure 4C). Although FOXP3 expression was induced in the Th0+G9ai population (3-fold change) as previously shown (Figure 1F), inhibition of cholesterol biosynthesis with simvastatin impeded activation of FOXP3 expression (Figure 4D). In addition, simvastatin also inhibited FOXP3 expression during conventional iTreg derivation, further highlighting the importance of cholesterol in Treg development. In summary, T cells differentiated in the presence of G9ai display increased intracellular cholesterol both at the level of the membrane and within LDs, which is required to support G9a-mediated Treg development.
G9a Inhibitor–Generated FOXP3+ T Cells Are Functional and Supported by Intrinsic Transforming Growth Factor β Production
To understand the functional significance of this lipid-rich metabolic signature, we characterized G9ai-Tregs (Th0+G9ai) based on their phenotype and function. First, we used cytometry time of flight to characterize the expression of key Treg surface markers and intracellular cytokines in the context of G9a inhibition. G9ai-treated T cells had identical cell surface marker expression patterns as conventional iTregs (Figure 5A). Although most intracellular cytokines remained unchanged after treatment with G9ai, endogenous TGF-β levels were significantly increased over vehicle treatment in all G9ai-treated conditions (Figure 5A and Supplementary Figure 4A and B). High-dimensional clustering of cells based on surface marker expression (viSNE analysis) revealed that TGF-β production correlates with increased FOXP3 expression (Figure 5B and Supplementary Figure 4C). These data suggest that G9a inhibition alters cell intrinsic TGF-β production.
Figure 5.
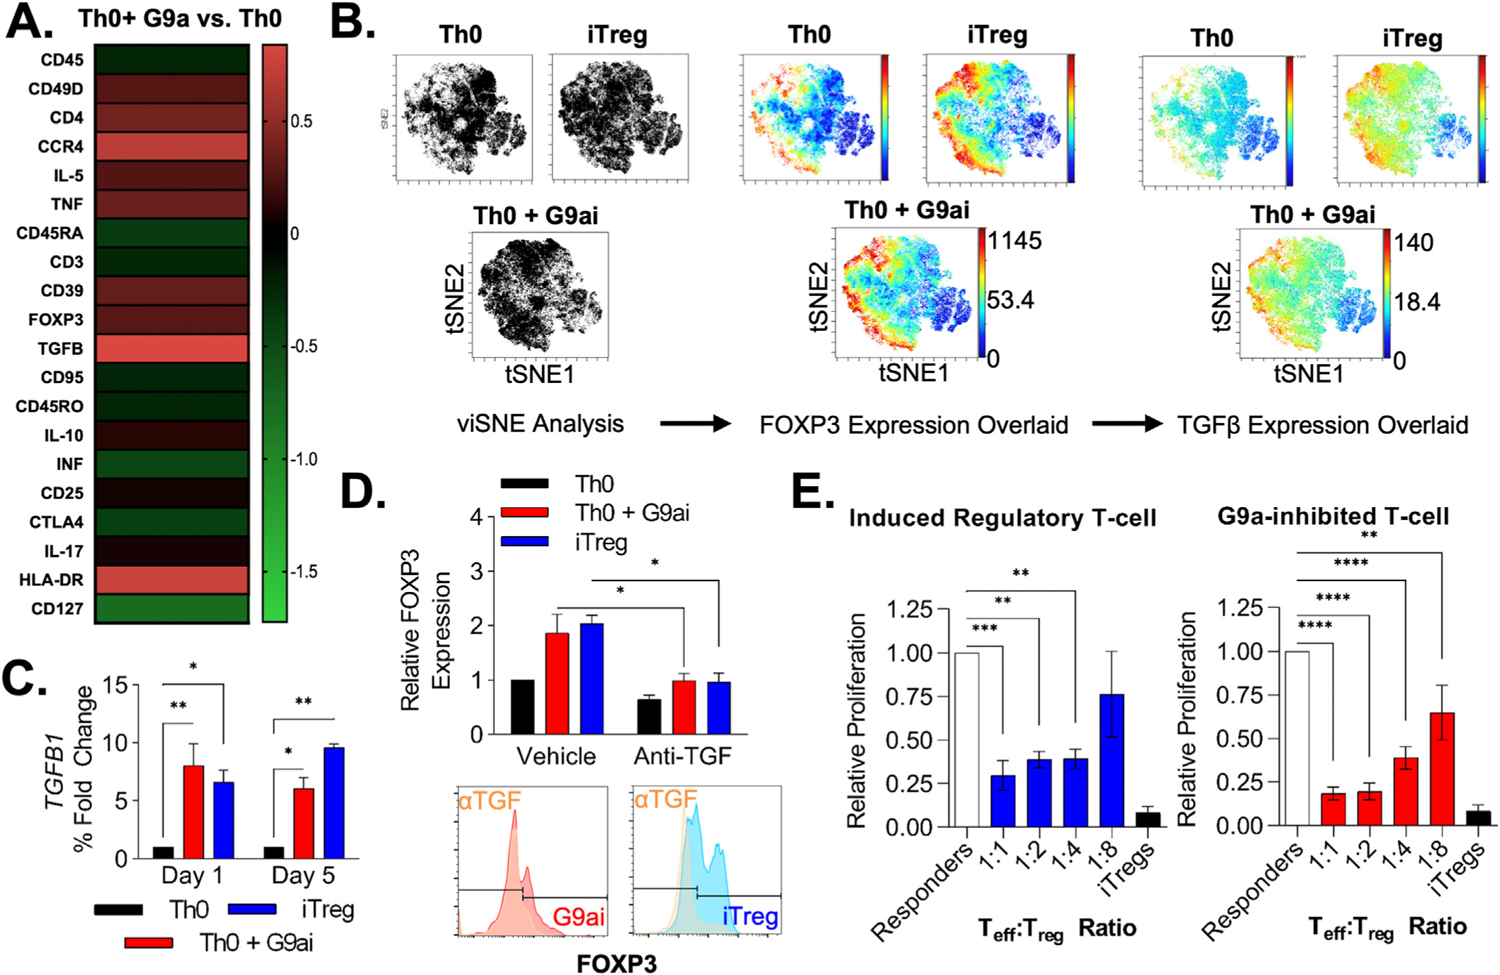
G9ai-generated FOXP3+ T cells are phenotypically similar to iTregs with enhanced intrinsic TGF-β production. (A) Heatmap showing phenotypical cytometry time-of-flight characterization of Th0+G9ai T cells based on cell surface marker and intracellular cytokine expression. (B) Representative viSNE clustering of CD4+ cells identifies a distinct subset population of FOXP3+, similarly seen in both iTreg and Th0+G9ai conditions, with heightened TGF-β production. (C) Changes in TGF-β expression by quantitative polymerase chain reaction are noted as early as 24 hours after the addition of UNC0642 during differentiation and peak at the end of 5 days. (E) Similar to iTregs, concomitant treatment with anti–TGF-β antibodies decreases FOXP3 expression in Th0+G9ai and iTregs, showing that Treg differentiation is dependent on TGF-β signaling. (F) Functional characterization using T-cell thymidine–based suppression assay shows that Th0+G9ai cells are capable of suppressing effector T-cell proliferation just as efficiently as iTregs. *P < .01, ***P < .001, and ****P < .0001. Teff, T effector cell.
Indeed, mRNA quantification via quantitative reverse-transcription polymerase chain reaction of iTregs and Th0+G9ai across 7 days of differentiation showed that expression levels of both FOXP3 and TGFB1 were observed as early as 24 hours, with significantly higher TGFB1 levels with G9ai treatment (Figure 5C). Because TGF-β responsiveness in cultured cells is directly influenced by cholesterol composition within the membrane, these data suggest a potential mechanism for Treg development upon G9a inhibition through cholesterol-induced autocrine TGF-β signaling.26 Cotreatment with neutralizing anti–TGF-β antibodies abrogated FOXP3 protein expression in both iTreg and G9ai conditions (Figure 5D). Furthermore, pharmacologic inhibition of the TGF-β receptor kinase preventing SMAD phosphorylation also blocked FOXP3 protein expression—these data suggesting that endogenous TGF-β production is also an important mediator of the G9a inhibitory effect in Treg differentiation (Supplementary Figure 5A and B). The fact that Th0+G9ai cells were differentiated in-the absence of exogenous cytokines suggests that G9a inhibition stimulates intrinsic TGF-β production to support FOXP3 expression in an autocrine fashion, as previously shown in other systems.27
To evaluate the effect of G9ai on the suppressive function of Tregs, we performed an in vitro suppression assay coculturing with different ratios of effector T cells stimulated with irradiated antigen-presenting cells and TCR activation (anti-CD3 and anti-CD28 antibodies). G9ai-Tregs were shown to suppress effector T-cell proliferation in vitro at least as efficiently as iTregs, showing that the activation of the FOXP3 network is functional after enzymatic G9a inhibition (Figure 5E). Taken together, our data indicate that G9ai-Tregs faithfully recapitulate iTregs both functionally and phenotypically.
G9a Inhibition Controls Immune-Mediated Colitis by Facilitating Functional T Regulatory Cell Development In Vivo
Next, we explored the therapeutic benefit of G9a inhibition and Treg development. We tested the capacity of antigen stimulation and concomitant G9a inhibition to produce antigen-specific Tregs in vivo. We used a model of gluten sensitivity (NOD-DQ8 mice expressing HLA-DQ8, a major histocompatibility complex II allele associated with celiac disease, which is triggered by the gliadin fraction of gluten) to assess the impact of G9ai upon T-cell expansion in vivo (Figure 6A). Immunization of NOD-ABo DQ8 mice with pepsin trypsin–digested gliadin alongside UNC0642 resulted in increased numbers of peripheral FOXP3+-expressing cells at the level of both the spleen and lumbar lymph nodes (Figure 6B and Supplementary Figure 6A). Peripheral lymphocytes from G9ai-treated animals displayed a corresponding decrease in global H3K9me2 (Figure 6C), confirming the on-target effect of UNC0642 to promote in vivo Treg development upon antigen stimulation.
Figure 6.
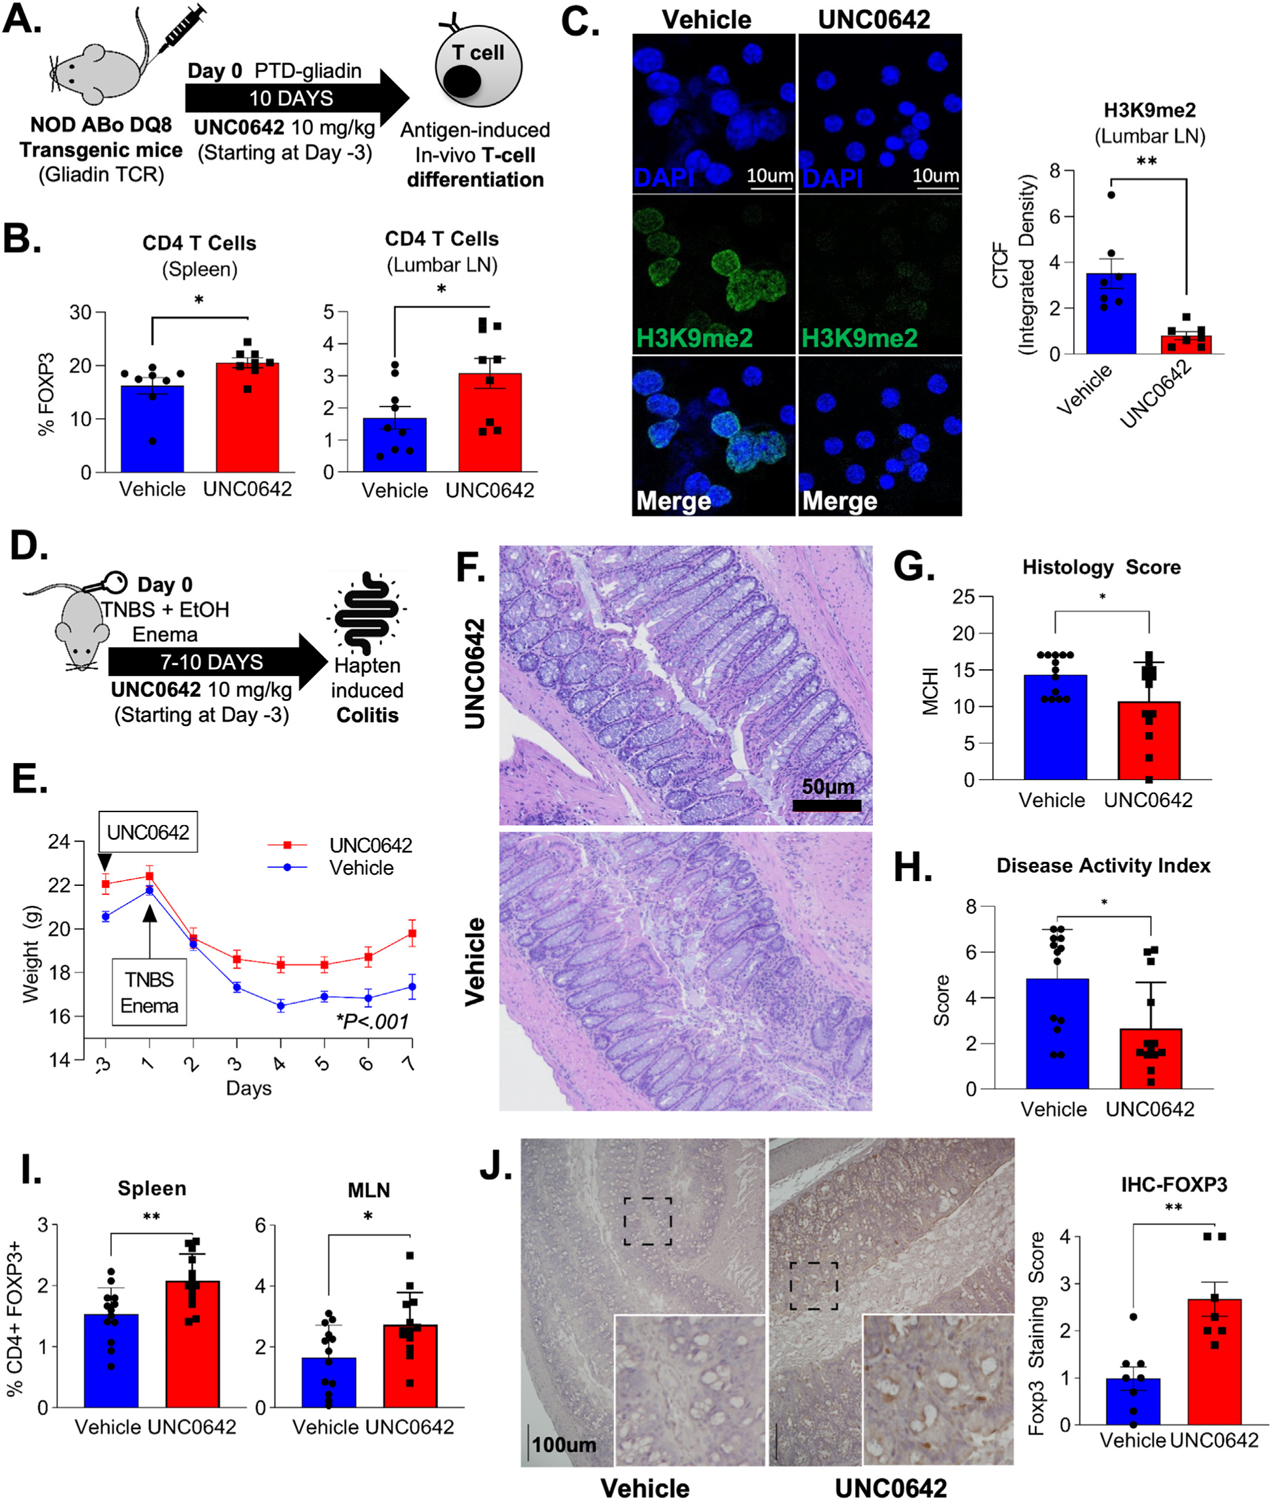
Pharmacologic inhibition of G9a upon antigen stimulation promotes Treg development in vivo and ameliorates hapten-induced colitis. (A) Immunization model using NOD Abo DQ8 mice expressing HLA-DQ8, which is triggered by the gliadin fraction of gluten, was used to assess the impact of G9a-inhibition (UNC0642) in T-cell differentiation in vivo. (B) Flow cytometric of murine T cells isolated from spleen (20.6 vs 16.2; P = .03) and lumbar lymph nodes (3.1% vs 1.7%; P = .03) confirmed an increase in peripherally induced FOXP3+CD4+ T cells in UNC0642-treated animals. (C) Immunofluorescence shows a correspondent decrease in the H3K9me2 within CD4+ T cells isolated from lumbar lymph nodes after G9ai, as (D) quantified by corrected total cell fluorescence (0.8 vs 3.5 id; P = .002). (D) Mice were treated with UNC0642 for a total of 10 days after colitis induction with enema containing ethanol and TNBS to promote hapten-induced colitis. (E) UNC0642-treated animals showed a less severe colitis phenotype highlighted by reduced weight loss and (F, G) improved histologic (14.3 vs 10.7; P = .03) and (H) disease activity scores (4.8 vs 2.6; P = .01). (I) An increase in the percentage of peripheral FOXP3+ was observed in murine cells isolated from spleen (vehicle: 1.5 vs UNC: 2.1%; P = .003) and mesenteric lymph nodes (vehicle: 1.6 vs UNC: 2.7%; P = .01) at the end of the experiment. (J) An increase in FOXP3+ cells was also seen at the mucosa of G9ai of treated mice via immunohistochemistry (vehicle 1 vs UNC: 2.3 median score; P = .003 using the Mann-Whitney test). *P < .05, **P < .01, ***P < .001. CTCF, XXXX; IHC, immunohistochemistry; LN, lymph node; MCHI, XXXX; PTD, XXXX.
Because the gluten sensitivity model is limited to cell proliferation without a strong mucosal inflammatory phenotype, we evaluated the use of G9ai as therapy for acute immune-mediated colitis.11 We used TNBS to promote hapten-induced activation of mucosal immune cells after barrier disruption by ethanol (Figure 6D). UNC0642-treated mice exhibited less weight loss at the end of 7 days (UNC0642 19.8 g vs vehicle 17.4 g; P = .002) (Figure 6C). We observed less colitis when compared to controls as shown by preserved macroscopic structure (Figure 6F), histologic (Figure 6G) and disease activity scores (Figure 6H), and reduced levels of the circulating proinflammatory cytokines (eg, tumor necrosis factor [TNF] α and interferon gamma) (Supplementary Figure 6B). Higher percentages of FOXP3+CD4+ T cells were found in both the spleen and mesenteric lymph nodes harvested from UNC0642-treated animals (Figure 6I). These findings suggest the improved phenotype of G9ai-treated animals was a result of increased peripheral conversion of nT cells to Tregs, which was validated by FOXP3 immunohistochemistry on intestinal specimens (Figure 6J). Overall, these 2 distinct experimental models show that the in vitro effects of G9a inhibitors on T cells can be exploited to generate antigen-specific Tregs in vivo that are capable of suppressing acute inflammation in targeted tissues.
Finally, to explore G9a biology in chronic colitis, we chose the adoptive T-cell transfer model of colitis. Because repetitive subcutaneous dosing of UNC0642 led to dermatitis, we generated a conditional knockout of G9a (G9aKO) in FOXP3-expressing CD4+ lymphocytes (FOXP3-Cre; EHMT2fl/fl). Using this novel mouse model as a donor of G9a-deficient cells, we were able to study both the prevention and treatment of chronic colitis. The treatment model is particularly important because multiple laboratories including ours have observed proinflammatory FOXP3+ cells within the inflammatory milieu of human IBD.16 We initially performed the control experiment to confirm that G9KO cells prevent chronic colitis, and indeed these cells function at least as well as WT Treg cells in the prevention of disease (Supplementary Figure 7A–F). To specifically test the function of G9aKO Tregs in the setting of active inflammation, we treated Rag1−/− animals after CD45RBhighCD25low T-cell transfer with either G9aKO Tregs, WT Tregs, or no cells at week 3, when the initial signs of weight loss and stool consistency changes were observed (Figure 7A). Although control animals that did not receive Treg cells (RbHi control) continued to lose weight, both G9aKO and WT groups recovered from the initial weight loss (Figure 7B). At the end of 7 weeks, improvement in histology (Figure 7D and E) and disease activity index (Figure 7F) as well as decreased concentration of serum inflammatory cytokines (Figure 7G) were seen in both rescue groups. These findings suggest that Tregs lacking G9a expression are capable of treating established colitis. Collectively, our pharmacologic and genetic experimentation models position G9a as a critical pathway to be explored therapeutically in the context of intestinal inflammation, either through systemic pharmacologic inhibition or, potentially, cell-based therapies after ex vivo expansion.
Figure 7.
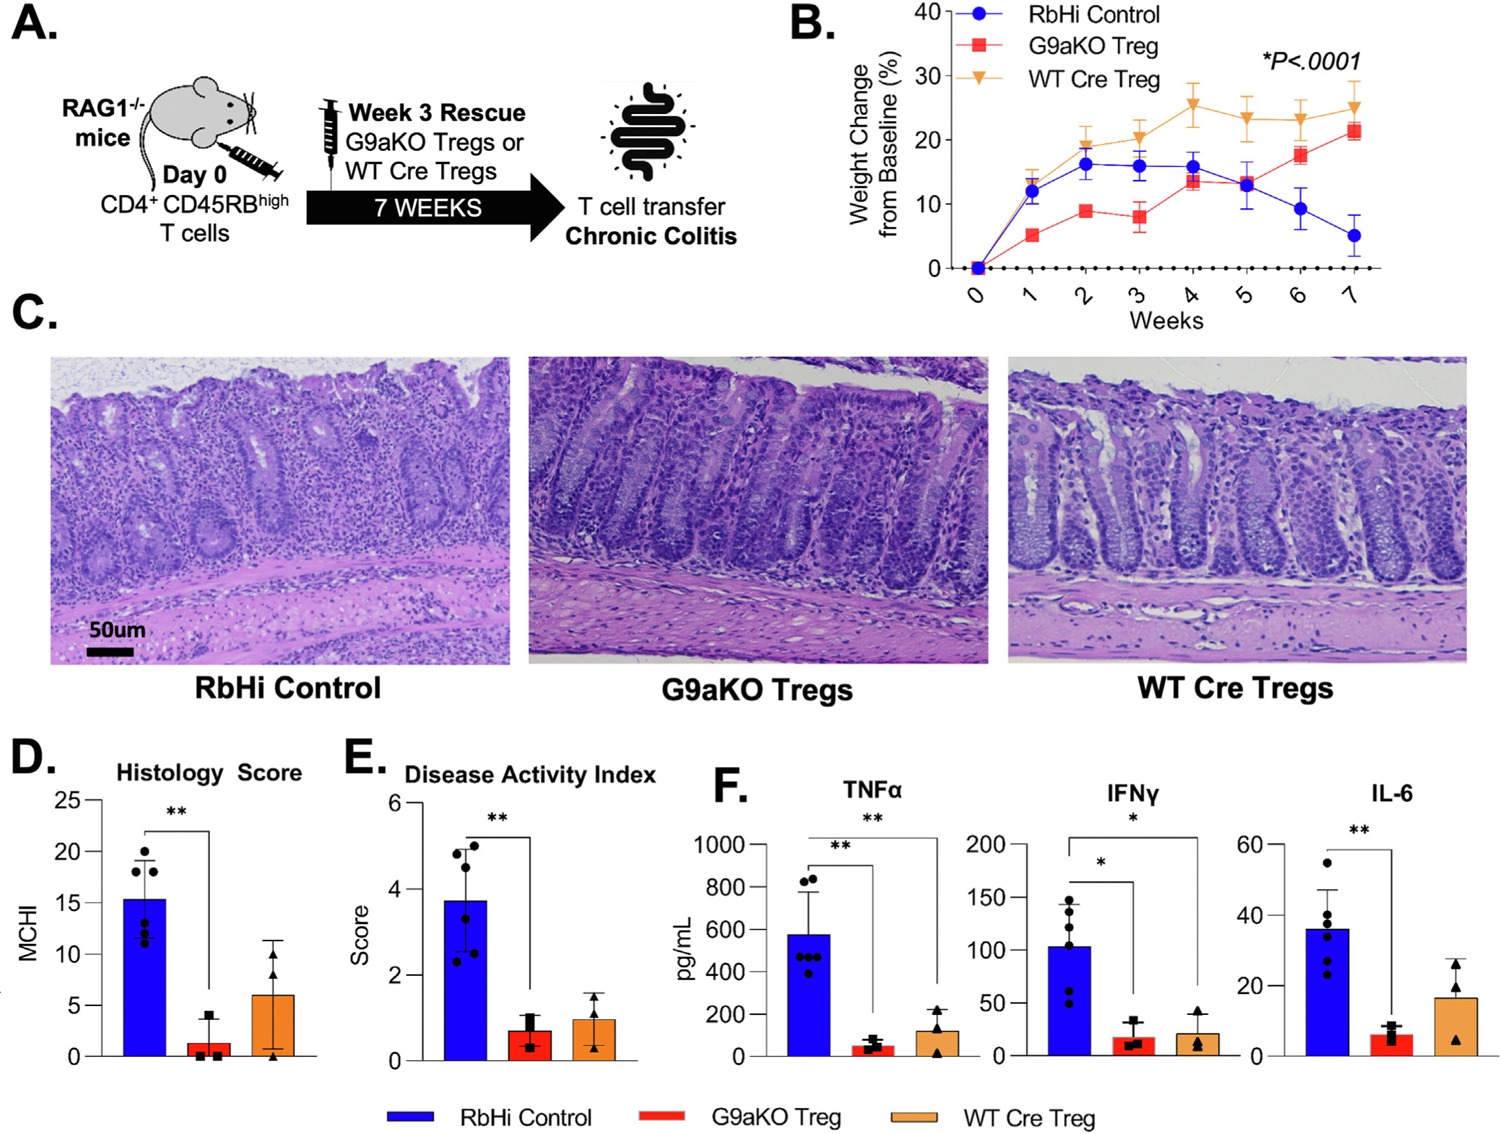
Regulatory T cells lacking G9a expression maintain suppressive function to rescue chronic colitis. (A) CD45RBhighCD25low T cells were sorted from WT mice and transferred to RAG−/− immunodeficient mice at day 0. Upon initial signs of colitis in week 3, GFP+ G9aKO cells or WT Cre Tregs were transferred for rescue with an RbHi control group not receiving cells. (B) Weight trends show that Tregs from G9aKO can equally rescue weight loss when compared to WT Tregs (P < .0001 using 2-way analysis of variance). Animals that received G9aKO Tregs showed a decrease in (C) immune infiltrates with equally improved histologic (RbHi: 15.3 vs G9aKO: 1.3 vs WT Treg: 6.0; P = .001) and disease activity (RbHi: 3.7 vs G9aKO: 0.7 vs WT Treg: 1.0; P = .002) scores when compared to RbHi control. Decreased levels of serum cytokines were also equally seen in animals receiving both G9aKO and WT Tregs when compared to RbHi control: TNF-α (RbHi: 575.7 vs G9aKO: 53.1 vs WT Treg: 120.1 pg/mL; P = .002), interferon gamma (RbHi: 103.2 vs G9aKO: 17.8 vs WT Treg: 21.0 pg/mL) and IL6 (RbHi: 36.0 vs G9aKO: 6.3 vs WT Treg: 16.6 pg/mL; P = .005). **P < .01, ***P < .001. TNF, tumor necrosis factor; IFN, interferon.
We did specifically assess the G9a pathway in T cells isolated from IBD patients. We used publicly available single-cell data to assess the expression of G9a itself and its associated genes in Tregs obtained from inflamed intestinal biopsy samples when compared to noninflamed adjacent tissue.28 G9a (EHMT2) expression itself is not different between segments (Supplementary Figure 7A), yet the signature of G9a inhibition (Figure 2) was significantly enriched (P < .0001) on Tregs located on non inflamed adjacent tissue when compared to inflamed segments (Supplementary Figure 7B), suggesting that G9a-dependent genes in Tregs may be regulated in IBD.
Discussion
The current study establishes a mechanistic link between G9a methyltransferase activity, cholesterol synthesis, and human Treg development. We demonstrate that inhibition of G9a methyltransferase activity after TCR activation in vitro is sufficient to generate FOXP3+ cells (G9ai-Tregs) that faithfully reproduce iTregs functionally and phenotypically. Mechanistically, for the first time, our findings implicate G9a in the transcriptional regulation of lipid metabolism in T cells, as evidenced by comprehensive metabolic profiling and intracellular cholesterol imaging. These results suggest that G9a inhibition leads to increased intracellular and membrane-bound cholesterol, facilitating Treg development through supportive bioenergetics and enhanced cholesterol membrane composition, respectively. Furthermore, immunization of mice in the presence of pharmacologic G9a inhibition leads to the derivation of Tregs in vivo capable of attenuating TNBS colitis. Finally, we demonstrate that Tregs lacking G9a expression remain functional and can rescue chronic intestinal inflammation, findings that highlight the therapeutic potential of G9a inhibition in the management of immune-mediated human diseases.
Although G9a is primarily regarded as an epigenetic repressor, its role as a coactivator of several transcription factors has recently emerged.29 Although the canonical repressor function of the complex is dependent on its enzymatic function that catalyzes methylation of histones and other substrates, activation of gene expression by G9a appears to be independent of its methyltransferase activity.30 Activation-related properties of G9a involve recruitment to the promoter or enhancer regions of its target genes where its N-terminal domain either directly serves as a scaffold for other coactivator transcription factors (eg, glucocorticoid receptor) or binds to RNA polymerase in the early establishment of transcriptional complexes (eg, β-globulin gene).29,31 Therefore, distinct from experiments based on genetic depletion, our focus on effects driven by G9a methyltransferase activity in immune cells is a strength of the current study and a unique contribution to the field. Indeed, many pharmacologic inhibitors of G9a methyltransferase activity have been successfully used in preclinical cancer studies and could be repurposed for the treatment of immune-mediated conditions, such as IBD.32 Nonetheless, further information on the long-term use of these inhibitors in humans is still needed.
Effector and regulatory cells display distinct metabolic phenotypes.6 There is uncertainty in the field as to whether the FOXP3-mediated Treg transcriptional program drives the distinct Treg metabolic signature or vice versa. Depending on the experimental system, the data support both circumstances. FOXP3 transcriptional activity is sufficient to program up-regulation of multiple electron transport components and enzymes linked to fatty acid β-oxidation, which results in selective protection from proapoptotic effects of intracellular lipids.33 In support of lipid metabolism driving the Treg program, oleic acid has been shown to amplify Treg fatty acid oxidation/OXPHOS, creating a positive feedback mechanism that induces the expression of FOXP3 and enhances phosphorylation of STAT5 to stabilize and increase Treg suppressive functions.34 Our data best support the temporal sequence of G9ai-induced cholesterol loading of the membrane leading to heightened positive feedback of endogenous TGF-β and resultant FOXP3 gene activation. The resultant FOXP3-driven transcriptional program confers protection to the intracellular accumulation of lipids that occurs upon G9a inhibition and promotes its use for energy purposes. Further characterization of specific cholesterol and other lipid byproducts required for Treg development and function is still needed.
Recent studies have proposed that alterations in lipid and energy metabolism can distinguish IBD patients and healthy control individuals.35 It has been shown that statins can alleviate experimental colitis including TNBS; however, systemic therapy in the in vivo models runs the risk of overinterpretation of the results, particularly when attributed to individual cell types.36 These observations are relevant to our data describing G9a as modulator of lipid metabolism in Tregs, opening a promising therapeutic avenue focused on immunometabolism. Even though Treg therapy is currently being investigated in the context of IBD, this remains dependent on ex vivo expansion of cells.37 The concomitant use of G9a inhibitors to drive ex vivo Treg expansion cultures could improve the yield of this ongoing investigational approach. Moreover, based on our experimental data, we also propose a new “immunization-based” drug delivery approach that would minimize the systemic effect of epigenetic inhibitors and promote Treg development in vivo. Identification of gut-specific antigens (eg, flagellin present in enteric bacteria) that can generate gut-homing Tregs when administered concomitantly with G9a inhibitors is a promising concept to ultimately control intestinal inflammation supported by our study.
In summary, we have described, for the first time, the role of methyltransferase G9a in the transcriptional regulation of lipid metabolism in T cells. The increased intracellular and membrane-bound cholesterol generated upon G9a inhibition promotes Treg development by supportive bioenergetics and serving as the backbone of membrane signaling structures, notably evidenced by enhanced intrinsic TGF-β that ultimately supports FOXP3 expression in an autocrine fashion. Our novel experimental immunization-based drug delivery model shows that pharmacologic inhibition of G9a leads to in vivo Treg derivation and could serve as a potential therapeutic avenue to control intestinal inflammatory disorders, including IBD and celiac disease.
Supplementary Material
WHAT YOU NEED TO KNOW.
BACKGROUND AND CONTEXT
The mechanisms underlying the role of G9a in CD4 T-cell development are poorly understood, and manipulation of G9a function to treat inflammation is unexplored.
NEW FINDINGS
G9a regulates lipid biosynthesis in CD4 T cells. Pharmacologic inhibition of G9a enzymatic function facilitates Treg development and attenuates intestinal inflammation in vivo.
LIMITATIONS
Further characterization of specific lipid byproducts required for Treg development and function is still needed.
IMPACT
Our findings support the potential use of G9a inhibition for the treatment of immune-mediated gastrointestinal conditions, including inflammatory bowel and celiac disease.
Acknowledgments
We thank Mayo Clinic Microscopy and Cell Analysis, Mayo Clinic Metabolomics Core, and Mayo Clinic Immune Monitoring Core for their experimental and technical assistance.
Funding
This work was supported by National Institute of Allergy and Infectious Diseases R01 grant AI089714 and the Leona Helmsley Charitable Trust (to William A. Faubion); National Cancer Institute R01 grant CA247898 and National Institute of Diabetes and Digestive and Kidney Diseases R01 grant DK052913 (to Gwen Lomberk); and National Institute of Diabetes and Digestive and Kidney Diseases grant K01DK124358, the Pilot & Feasibility Award by the Center for Cell Signaling in Gastroenterology (P30DK084567), the Mayo Clinic Center for Biomedical Discovery Career Development Award, and the David F. and Margaret T. Grohne Cancer Immunology and Immunotherapy Research Fellowship Award (to Adebowale O. Bamidele).
Abbreviations used in this paper:
- ATAC-seq
assay for transposase-accessible chromatin by sequencing
- DEG
differentially expressed gene
- FCCP
carbonyl cyanide 4-(trifluoromethoxy)phenylhydrazone
- FOXP3
forkhead domain–containing protein
- G9ai
G9a inhibitor
- G9aKO
G9a knockout
- GEO
Gene Expression Omnibus
- GLP
G9a-like protein
- H3K9me
methylation of histone H3 lysine 9
- HMG-CoA
3-hydroxy 3-methylglutaryl coenzyme A
- HMGCR
3-hydroxy 3-methylglutaryl coenzyme A reductase
- IBD
inflammatory bowel disease
- IL
interleukin
- IP
intraperitoneally
- iTreg
induced T regulatory cell
- LD
lipid droplet
- mRNA
messenger RNA
- nT cell
naive T cell
- OXPHOS
oxidative phosphorylation
- PBMC
peripheral blood mononuclear cell
- PBS
phosphate-buffered saline
- RNA-seq
RNA sequencing
- SREBP
sterol regulatory element-binding protein
- TCR
T-cell receptor
- TGF-β
transforming growth factor beta
- Th
T-helper
- TNBS
trinitrobenzene sulfonic acid
- TNF
tumor necrosis factor
- Treg
regulatory T cell
- WT
wild type
Footnotes
Supplementary Material
Note: To access the supplementary material accompanying this article, visit the online version of Gastroenterology at www.gastrojournal.org, and at https://doi.org/10.1053/j.gastro.2022.10.011.
CRediT Authorship Contributions
Guilherme Piovezani Ramos, MD (Conceptualization: Lead; Data curation: Lead; Formal analysis: Lead; Investigation: Lead; Methodology: Lead; Writing – original draft: Lead; Writing – review & editing: Lead); Adebowale O. Bamidele, PhD (Data curation: Supporting; Funding acquisition: Supporting; Investigation: Supporting; Methodology: Supporting; Writing – original draft: Supporting; Writing – review & editing: Supporting); Emily E. Klatt (Data curation: Supporting; Investigation: Supporting; Writing – review & editing: Supporting); Mary R. Sagstetter (Data curation: Supporting; Formal analysis: Supporting; Methodology: Supporting; Writing – review & editing: Supporting); Ahmed T. Kurdi, MD (Investigation: Supporting; Methodology: Supporting; Writing – review & editing: Supporting); Feda H. Hamdan, PhD (Formal analysis: Supporting; Investigation: Supporting; Methodology: Supporting; Writing – review & editing: Supporting); Robyn Laura Kosinsky, PhD (Formal analysis: Supporting; Investigation: Supporting; Writing – review & editing: Supporting); Joseph M. Gaballa (Formal analysis: Supporting; Investigation: Supporting; Writing – review & editing: Supporting); Asha Nair, PhD (Data curation: Supporting; Formal analysis: Supporting); Zhifu Sun, PhD (Formal analysis: Supporting; Methodology: Supporting); Surendra Dasari, PhD (Data curation: Supporting; Formal analysis: Supporting; Methodology: Supporting); Ian R. Lanza, PhD (Methodology: Supporting; Writing – review & editing: Supporting); Cody N. Rozeveld, (Investigation: Supporting); Micah B. Schott, PhD (Data curation: Supporting; Investigation: Supporting; Methodology: Supporting; Writing – review & editing: Supporting); Guillermo Urrutia, PhD (Data curation: Supporting; Formal analysis: Supporting; Investigation: Supporting; Writing – review & editing: Supporting); Maria S. Westphal, (Investigation: Supporting); Benjamin D. Clarkson, PhD (Data curation: Supporting; Investigation: Supporting; Methodology: Supporting; Writing – review & editing: Supporting); Charles L. Howe, PhD (Methodology: Supporting; Writing – review & editing: Supporting); Eric V. Marietta, PhD (Investigation: Supporting; Methodology: Supporting); David H. Luckey, PhD (Investigation: Supporting; Methodology: Supporting); Joseph A. Murray, MD (Methodology: Supporting; Writing – review & editing: Supporting); Michelle Gonzalez, MD (Investigation: Supporting; Methodology: Supporting; Writing – review & editing: Supporting); Manuel B. Braga Neto, MD, PhD (Investigation: Supporting; Methodology: Supporting; Writing – review & editing: Supporting); Hunter R. Gibbons, PhD (Investigation: Supporting; Writing – review & editing: Supporting); Thomas C. Smyrk, MD (Investigation: Supporting); Steven Johnsen, PhD (Conceptualization: Supporting; Formal analysis: Supporting; Methodology: Supporting; Writing – original draft: Supporting; Writing – review & editing: Supporting); Gwen Lomberk, PhD (Conceptualization: Equal; Funding acquisition: Supporting; Methodology: Supporting; Writing – original draft: Supporting; Writing – review & editing: Equal); William A. Faubion, MD (Conceptualization: Equal; Funding acquisition: Lead; Methodology: Equal; Project administration: Lead; Supervision: Lead; Writing – original draft: Equal; Writing – review & editing: Equal).
Conflicts of interest
The authors disclose no conflicts.
References
- 1.Smids C, Horjus Talabur Horje CS, Drylewicz J, et al. Intestinal T cell profiling in inflammatory bowel disease: linking T cell subsets to disease activity and disease course. J Crohns Colitis 2018;12:465–475. [DOI] [PubMed] [Google Scholar]
- 2.Jaeger N, Gamini R, Cella M, et al. Single-cell analyses of Crohn’s disease tissues reveal intestinal intraepithelial T cells heterogeneity and altered subset distributions. Nat Commun 2021;12(1):1921. [DOI] [PMC free article] [PubMed] [Google Scholar]
- 3.Singh S, Murad MH, Fumery M, et al. Comparative efficacy and safety of biologic therapies for moderate-to-severe Crohn’s disease: a systematic review and network meta-analysis. Lancet Gastroenterol Hepatol 2021;6:1002–1014. [DOI] [PMC free article] [PubMed] [Google Scholar]
- 4.Sakaguchi S. Naturally arising Foxp3-expressing CD25+CD4+ regulatory T cells in immunological tolerance to self and non-self. Nat Immunol 2005;6:345–352. [DOI] [PubMed] [Google Scholar]
- 5.Ohkura N, Kitagawa Y, Sakaguchi S. Development and maintenance of regulatory T cells. Immunity 2013; 38:414–423. [DOI] [PubMed] [Google Scholar]
- 6.Gerriets VA, Rathmell JC. Metabolic pathways in T cell fate and function. Trends Immunol 2012;33:168–173. [DOI] [PMC free article] [PubMed] [Google Scholar]
- 7.Buck MD, O’Sullivan D, Pearce EL. T cell metabolism drives immunity. J Exp Med 2015;212:1345–1360. [DOI] [PMC free article] [PubMed] [Google Scholar]
- 8.Berod L, Friedrich C, Nandan A, et al. De novo fatty acid synthesis controls the fate between regulatory T and T helper 17 cells. Nat Med 2014;20:1327–1333. [DOI] [PubMed] [Google Scholar]
- 9.Tachibana M, Sugimoto K, Nozaki M, et al. G9a histone methyltransferase plays a dominant role in euchromatic histone H3 lysine 9 methylation and is essential for early embryogenesis. Genes Dev 2002;16:1779–1791. [DOI] [PMC free article] [PubMed] [Google Scholar]
- 10.Lehnertz B, Northrop JP, Antignano F, et al. Activating and inhibitory functions for the histone lysine methyltransferase G9a in T helper cell differentiation and function. J Exp Med 2010;207:915–922. [DOI] [PMC free article] [PubMed] [Google Scholar]
- 11.Antignano F, Burrows K, Hughes MR, et al. Methyltransferase G9A regulates T cell differentiation during murine intestinal inflammation. J Clin Invest 2014; 124:1945–1955. [DOI] [PMC free article] [PubMed] [Google Scholar]
- 12.Sarmento OF, Svingen PA, Xiong Y, et al. A novel role for Kruppel-like factor 14 (KLF14) in T regulatory cell differentiation. Cell Mol Gastroenterol Hepatol 2015; 1:188–202. [DOI] [PMC free article] [PubMed] [Google Scholar]
- 13.Buenrostro JD, Giresi PG, Zaba LC, et al. Transposition of native chromatin for fast and sensitive epigenomic profiling of open chromatin, DNA-binding proteins and nucleosome position. Nat Methods 2013;10:1213–1218. [DOI] [PMC free article] [PubMed] [Google Scholar]
- 14.Ryals J, Lawton K, Stevens D, et al. Metabolon, Inc. Pharmacogenomics 2007;8:863–866. [DOI] [PubMed] [Google Scholar]
- 15.Bodkhe R, Marietta EV, Balakrishnan B, et al. Human gut-derived commensal suppresses generation of T-cell response to gliadin in humanized mice by modulating gut microbiota. Anaerobe 2021;68:102237. [DOI] [PubMed] [Google Scholar]
- 16.Gonzalez MM, Bamidele AO, Svingen PA, et al. BMI1 maintains the Treg epigenomic landscape to prevent inflammatory bowel disease. J Clin Invest 2021;131(12): e140755. [DOI] [PMC free article] [PubMed] [Google Scholar]
- 17.Bamidele AO, Svingen PA, Sagstetter MR, et al. Disruption of FOXP3–EZH2 interaction represents a pathobiological mechanism in intestinal inflammation. Cell Mol Gastroenterol Hepatol 2019;7:55–71. [DOI] [PMC free article] [PubMed] [Google Scholar]
- 18.Clarkson BD, Walker A, Harris M, et al. Mapping the accumulation of co-infiltrating CNS dendritic cells and encephalitogenic T cells during EAE. J Neuroimmunol 2014;277:39–49. [DOI] [PMC free article] [PubMed] [Google Scholar]
- 19.Urrutia G, de Assuncao TM, Mathison AJ, et al. Inactivation of the euchromatic histone-lysine N-methyltransferase 2 pathway in pancreatic epithelial cells antagonizes cancer initiation and pancreatitis-associated promotion by altering growth and immune gene expression networks. Front Cell Dev Biol 2021;9:681153. [DOI] [PMC free article] [PubMed] [Google Scholar]
- 20.Liu F, Barsyte-Lovejoy D, Li F, et al. Discovery of an in vivo chemical probe of the lysine methyltransferases G9a and GLP. J Med Chem 2013;56:8931–8942. [DOI] [PMC free article] [PubMed] [Google Scholar]
- 21.Horton JD, Goldstein JL, Brown MS. SREBPs: activators of the complete program of cholesterol and fatty acid synthesis in the liver. J Clin Invest 2002;109:1125–1131. [DOI] [PMC free article] [PubMed] [Google Scholar]
- 22.Swamy M, Beck-Garcia K, Beck-Garcia E, et al. A cholesterol-based allostery model of T cell receptor phosphorylation. Immunity 2016;44:1091–1101. [DOI] [PubMed] [Google Scholar]
- 23.Xu WJ, Wen H, Kim HS, et al. Observation of acetyl phosphate formation in mammalian mitochondria using real-time in-organelle NMR metabolomics. Proc Natl Acad Sci U S A 2018;115:4152–4157. [DOI] [PMC free article] [PubMed] [Google Scholar]
- 24.Pietrocola F, Galluzzi L, Bravo-San Pedro JM, et al. Acetyl coenzyme A: a central metabolite and second messenger. Cell Metab 2015;21:805–821. [DOI] [PubMed] [Google Scholar]
- 25.Howie D, Ten Bokum A, Cobbold SP, et al. A novel role for triglyceride metabolism in Foxp3 expression. Front Immunol 2019;10:1860. [DOI] [PMC free article] [PubMed] [Google Scholar]
- 26.Chen CL, Huang SS, Huang JS. Cholesterol modulates cellular TGF-ß responsiveness by altering TGF-ß binding to TGF-ß receptors. J Cell Physiol 2008;215:223–233. [DOI] [PMC free article] [PubMed] [Google Scholar]
- 27.Turner JA, Stephen-Victor E, Wang S, et al. Regulatory T cell-derived TGF-ß1 controls multiple checkpoints governing allergy and autoimmunity. Immunity 2020; 53:1202–1214. [DOI] [PMC free article] [PubMed] [Google Scholar]
- 28.Martin JC, Chang C, Boschetti G, et al. Single-cell analysis of Crohn’s disease lesions identifies a pathogenic cellular module associated with resistance to anti-TNF therapy. Cell 2019;178:1493–1508. [DOI] [PMC free article] [PubMed] [Google Scholar]
- 29.Bittencourt D, Wu DY, Jeong KW, et al. G9a functions as a molecular scaffold for assembly of transcriptional coactivators on a subset of glucocorticoid receptor target genes. Proc Natl Acad Sci U S A 2012; 109:19673–19678. [DOI] [PMC free article] [PubMed] [Google Scholar]
- 30.Purcell DJ, Jeong KW, Bittencourt D, et al. A distinct mechanism for coactivator versus corepressor function by histone methyltransferase G9a in transcriptional regulation. J Biol Chem 2011;286:41963–41971. [DOI] [PMC free article] [PubMed] [Google Scholar]
- 31.Chaturvedi CP, Hosey AM, Palii C, et al. Dual role for the methyltransferase G9a in the maintenance of ß-globin gene transcription in adult erythroid cells. Proc Natl Acad Sci U S A 2009;106:18303–18308. [DOI] [PMC free article] [PubMed] [Google Scholar]
- 32.Haebe JR, Bergin CJ, Sandouka T, et al. Emerging role of G9a in cancer stemness and promises as a therapeutic target. Oncogenesis 2021;10:76. [DOI] [PMC free article] [PubMed] [Google Scholar]
- 33.Howie D, Cobbold SP, Adams E, et al. Foxp3 drives oxidative phosphorylation and protection from lipotoxicity. JCI Insight 2017;2(3):e89160. [DOI] [PMC free article] [PubMed] [Google Scholar]
- 34.Pompura SL, Wagner A, Kitz A, et al. Oleic acid restores suppressive defects in tissue-resident FOXP3 Tregs from patients with multiple sclerosis. J Clin Invest 2021;131(2): e138519. [DOI] [PMC free article] [PubMed] [Google Scholar]
- 35.Scoville EA, Allaman MM, Brown CT, et al. Alterations in lipid, amino acid, and energy metabolism distinguish Crohn’s disease from ulcerative colitis and control subjects by serum metabolomic profiling. Metabolomics 2018;14(1):17. [DOI] [PMC free article] [PubMed] [Google Scholar]
- 36.Maheshwari RA, Balaraman R, Sailor GU, et al. Protective effect of simvastatin and rosuvastatin on trinitrobenzene sulfonic acid-induced colitis in rats. Indian J Pharmacol 2015;47:17–21. [DOI] [PMC free article] [PubMed] [Google Scholar]
- 37.Raffin C, Vo LT, Bluestone JA. Treg cell-based therapies: challenges and perspectives. Nat Rev Immunol 2020; 20:158–172. [DOI] [PMC free article] [PubMed] [Google Scholar]
Associated Data
This section collects any data citations, data availability statements, or supplementary materials included in this article.