

Abstract
Background:
Traditional paper-and-pencil neurocognitive evaluations and semi-structured mental health interviews can take hours to administer and score. Computerized assessment has decreased that burden substantially, and contemporary psychometric tools such as item response theory and computerized adaptive testing (CAT) allow even further abbreviation.
New Method:
The goal of this paper was to describe the application of CAT and related methods to the Penn Computerized Neurocognitive Battery (CNB) and a well-validated clinical assessment in order to increase efficiency in assessment and relevant domain coverage. To calibrate item banks for CAT, N = 5,053 participants (63% female; mean age 45 years, range 18 - 80) were collected from across the United States via crowdsourcing, providing item parameters that were then linked to larger item banks and used in individual test construction. Tests not amenable to CAT were abbreviated using complementary short-form methods.
Results:
The final “CAT-CCNB” battery comprised 21 cognitive tests (compared to 14 in the original) and five adaptive clinical scales (compared to 16 in the original).
Comparison with Existing Methods:
This new battery, derived with contemporary psychometric approaches, provides further improvements over existing assessments that use collections of fixed-length tests developed for stand-alone administration. The CAT-CCNB provides an improved version of the CNB that shows promise as a maximally efficient tool for neuropsychiatric assessment.
Conclusions:
We anticipate CAT-CCNB will help satisfy the clear need for broad yet efficient measurement of cognitive and clinical domains, facilitating implementation of large-scale, “big science” approaches to data collection, and potential widespread clinical implementation.
Keywords: neuropsychological assessment, item response theory, clinical assessment, computerized adaptive testing, test abbreviation
1. Introduction
Due to the increasing demand for large-scale human studies in “big science” (especially genomics and brain-behavior associations; Marek et al., 2022), cognitive and clinical testing must be as efficient as possible to collect data at scale. Additionally, rapid clinical assessment for psychopathology and neurocognitive deficits could help ease both patient and care-provider burden, including reducing patient costs if billable hours can be reduced by abbreviated (yet precise) assessment.
Traditional paper-and-pencil cognitive testing can take hours to administer and score (Lezak et al., 2004), and likewise clinical interviews typically require several hours. Computerized neurocognitive testing (Gur et al., 2001; Suppes, 1966) has decreased that burden substantially with negligible impacts on validity, and abbreviated clinical interviews (e.g., Woods, Walsh, & Cannon, 2020) have resulted in similar time-saving. However, these assessments (cognitive and clinical; e.g. Weintraub et al., 2013) can be made even shorter by taking advantage of powerful psychometric tools, such as item response theory (IRT) (Embretson & Reise, 2000; Lord, 1952) and one of its most innovative applications, computerized adaptive testing (CAT) (Lord, 1970; Weiss, 1982). This approach is supported by others (Gibbons & deGruy, 2019; Weiss, 2011), and research in CAT has been advancing rapidly for decades, including cognitive and non-cognitive assessments (Gibbons et al., 2008; Mills & Stocking, 1996). However, conversion of an entire test/scale battery to CAT (and related forms) is still rare, full of potential hazards (Drasgow & Mattern, 2006; Gallagher et al., 2002), and requires many decisions for which there is still insufficient background research. Some of these “hazards”, such as limitations associated with multiple-choice response forms (Wainer et al., 2000) and vulnerability to cheating or hacking (Burke, 2009), are not directly addressed here. Others, such as multidimensionality of item response data (Green et al., 1984) and the appropriateness of CAT for different types of neurocognitive tests (Thomas et al., 2021), are carefully considered. While most of the tests discussed here are neurocognitive, there are five non-cognitive (clinical) scales included, and it is worth noting the tremendous progress made in this area by the Patient Reported Outcomes Measurement Information System (PROMIS) project (Ader, 2007; Cella et al., 2007). This project was a large multi-institutional, NIH-funded initiative to evaluate and compile item banks for use in several health-relevant areas, including fatigue, pain, sleep, emotional distress, social functioning, and others. It is unique in its size, scope, and depth of item evaluation, laying the groundwork and setting guidelines for many subsequent item-banking projects. Many of the methodological steps described below were guided by PROMIS researchers.
The goal of the present manuscript was to describe the methods used for: 1) expansion of the breadth of cognitive and clinical domains tested by the Penn Computerized Neurocognitive Battery (CNB) (Gur et al., 2001, 2010; Moore et al., 2015) and clinical assessment (GOASSESS) (Calkins et al., 2014, 2015), and 2) use of CAT and other contemporary testing methods to decrease the time necessary for administration of the full, expanded CNB and clinical assessment. Note that, while we do provide information on each test’s psychometric properties (e.g. information functions described below), validation of the adaptive/abbreviated versions using their full forms in a completely new sample is ongoing and will be presented in subsequent manuscripts. The current manuscript describes the multiple methods used to construct the CAT-CCNB, as well as preliminary investigation of psychometric properties such as expected standard error of measurement at various test/scale lengths. Although an auxiliary goal of the manuscript is to draw attention to the potential benefits of using CAT in neuropsychiatric assessment—i.e. a “general call” for introducing CAT to these types of tests—the primary goal is specific to the tests described here. Though most CAT-construction projects focus on only one (or a few) tests with a very thorough investigation of item and test properties (see Reeve et al., 2007), here we defer some of those steps (e.g. differential item functioning analysis) to later iterations (versions) of the CAT-CCNB.
2. Materials and Methods
2.1. Participants
Data were collected using online crowdsourcing performed by Dynata LLC (Connecticut, U.S.), with the target sampling population between 18 and 65 years old1, balanced for sex. Recruitment techniques used by Dynata included phone, email, internet banners, community website messaging, and others in an attempt to attract persons with a diversity of motivations for participating in research.
Due to the large number of tests and the need for a large item bank (see below for information on test linking), the final sample comprised four subsamples (N=1,367; N=1,294; N=1,197; N=1,195), with total N=5,053. The reason four sub-samples were necessary is that administration of an entire item bank (sometimes hundreds of items for a single test) is not feasible in a single sample due to examinee fatigue and practical time constraints. To circumvent this problem, separate portions of the item bank are administered to separate samples, followed by a linking procedure (described below) to put the item parameters on the same scale (Muraki et al., 2000). Supplementary Table S1 shows the demographic characteristics of the sample, where the mean ages (years) of all four samples were in the 44-46 range, and proportion female was consistently in the 0.60-0.65 range.
Data quality for the neurocognitive tests was assessed using a performance validity estimator (Scott et al., 2022) comprising metrics of feasibility of response time (RT) patterns and appropriateness of response (accuracy) patterns. The response time metric included the proportion of item (question) response times that were beyond 2 standard deviations (SDs) from the sample mean for that item, given response (in)correctness. For example, if the examinee responded correctly, the response time was compared to the sample mean and SD of other correct responses to that item; if the RT was > 2 SDs from the sample mean, that item was marked an outlier for that person. The proportion of outliers was subtracted from 1.00 such that higher values indicated more valid RT patterns. Appropriateness of correct/incorrect response patterns was assessed using two metrics of person fit (Karabatsos, 2003; Meijer & Sijtsma, 2001), which characterize the likelihood of a response pattern given the difficulty of the items. For example, if a person responds correctly to many difficult items but responds incorrectly to many easy items, that would be an indicator of low person fit, perhaps indicating random responding or external effort-affecting phenomena (e.g. lapses in attention due to intermittent distractions). Additionally (also roughly falling within the realm of “person fit”), the proportion correct on the three easiest items was incorporated into the validity estimator. Once each person had an estimated performance validity, the bottom 5% were removed before item calibration. Additional information about the validity estimator is provided in Scott et al. (2022).
2.2. Tests and Scales Composing the CAT-CCNB
Measures used in the CAT-CCNB varied widely by target domain (e.g., executive, memory, psychopathological dimension), test format (e.g., traditional self-paced multiple choice, rapidly paced tasks requiring constant attention), and strategy used for creating the adaptive (or abbreviated) form. Table 1 shows the tests and scales used, along with other relevant information such as (sub-)domain and length of the full form. There are six broad neurocognitive domains covered by the CAT-CCNB: executive functioning (four tests), memory (three tests), complex cognition/reasoning (three tests), social cognition (three tests), reward/decision-making (three tests), and sensorimotor speed (two tests); in addition, there is one test (PRA) measuring IQ, and a clinical domain (five adaptive scales). Most tests described here have been extensively described in prior publications (Gur et al., 2001, 2010; Moore et al., 2015; Calkins et al. 2015), and only brief descriptions are provided.
Table 1.
Tests and scales used in the construction of the CAT-CCNB.
| Task Full Name | Task Abbreviation | Alt. Task Abbreviation | (Sub-)Domain | Items on Full form | Final test Format (and abbreviation or calibration method) | Reference |
|---|---|---|---|---|---|---|
| Abstraction, Inhibition and Working Memory Test | AIM | n/a | Executive Control | 60 | Shorten (CAT simulation and SSIR) | Glahn et al., (2000) |
| Penn Continuous Performance Test | PCPT | n/a | Executive Control | 180 (90 letters, 90 numbers) | Shorten (CAT simulation and SSIR) | Gur et al. (2001, 2012) |
| Go-No-Go Test | GNG150 | n/a | Executive Control | 150 | Shorten (CAT simulation and SSIR) | Scott et al. (2020) |
| Digit Symbol Substitution Test | DSST | n/a | Executive Control | 170† (90 seconds) | Shorten (CAT simulation and SSIR) | Basner et al. (2015) |
| Penn Word Memory Test | CPW | PWMT | Memory | 48 | CAT (target/foil separated* unidimensional) | Gur et al. (2001, 2012) |
| Penn Face Memory Test | CPF | PFMT | Memory | 40 | CAT (target/foil separated* unidimensional) | Gur et al. (2001, 2012) |
| Visual Object Learning Test | VOLT | n/a | Memory | 20 | CAT (target/foil separated* unidimensional) | Gur et al. (2001, 2012) |
| Penn Verbal Reasoning Test | PVRT | n/a | Complex Cog | 25 | CAT (unidimensional) | Gur et al. (2001, 2012) |
| Penn Matrix Analysis Test | PMAT | PMRT | Complex Cog | 24 | CAT (bifactor) | Gur et al. (2001, 2012) |
| Penn Line Orientation Test | PLOT | n/a | Complex Cog | 24 | CAT (bifactor) | Gur et al. (2001, 2012) |
| Penn Emotion Identification Test | ER40 | PEIT | Social Cog | 40 | CAT (target/foil separated* unidimensional) | Gur et al. (2001, 2012) |
| Penn Emotion Differentiation Test | MEDF | PEDT | Social Cog | 30 | CAT (target/foil Separated* unidimensional) | Gur et al. (2001, 2012) |
| Penn Age Differentiation Test | ADT | PADT | Social Cog | 30 | CAT (target/foil separated* unidimensional) | Gur et al. (2001, 2012) |
| Penn Reading Assessment | PRA | n/a | Premorbid IQ | 60 | CAT (unidimensional) | Yudien et al. (2019) |
| Delay Discounting Test | DDISC | n/a | Reward/DM | 34 | CAT (unidimensional) | Yu et al. (2017) |
| Effort Discounting Test | EDISC | n/a | Reward/DM | 34 | CAT (unidimensional) | Prettyman et al. (2021) |
| Risk Discounting Test | RDISC | n/a | Reward/DM | 34 | CAT (bifactor) | Yu et al. (2017) |
| CAT-CCNB Anxious-Misery | AM | n/a | Clinical | 38 | CAT (unidimensional) | Calkins et al. (2015) |
| CAT-CCNB Externalizing | Ext | n/a | Clinical | 25 | CAT (unidimensional) | Calkins et al. (2015) |
| CAT-CCNB Fear | n/a | n/a | Clinical | 25 | CAT (unidimensional) | Calkins et al. (2015) |
| CAT-CCNB Psychosis | Psy | n/a | Clinical | 25 | CAT (unidimensional) | Calkins et al. (2015) |
| CAT-CCNB Personality | Pers | n/a | Clinical | 25 | CAT (unidimensional) | Krueger et al. (2013) |
Note.
Tasks shortened by Target/Foil separated unidimensional CAT had two unidimensional models run (one on the targets and one on the foils), where the terms “targets” and “foils” are used even for non-memory tests to indicate;
170 items max (number of items administered depends on speed of performance);
Alt = alternative; CAT = computerized adaptive testing; Cog = cognition; SSIR = simulated successive item removal; DM = decision-making.
2.1.1. Executive Control
Abstraction and Mental Flexibility (ABF) measured by the Abstract Matching (AM) test.
In this test (Glahn et al., 2000), participants are presented with two pairs of shapes at the top of the screen and one at the bottom, and they select whether the single shape belongs to the pair on the right or left. This pairing rests on the ability to find commonalities between the target object and the other shapes. Explicit categories were used to generate each trial and their combination determines the difficulty of pairing. A total of 60 pairs of shapes are presented 10s apart. Total task duration of the test is 10 minutes.
Attention (ATT) measured by the Penn Continuous Performance Test (PCPT).
This test (Gur et al., 2001; Kurtz et al., 2001) presents 7-segment displays of numbers and letters for 300 ms. Numbers are presented in the first half followed by letters. A total of 180 stimuli are randomly presented every second. The participant’s task is to press the space bar whenever the display forms a digit (for the first half of the test) or a letter (for the second half of the test). Total duration of the test is 5 minutes.
Inhibition (INH) measured by the Go/No-Go (GNG).
This test (Moore et al., 2019b) requires one to inhibit response to a particular low-frequency nontarget. Participants see Xs and Ys quickly displayed (300 ms) at different positions on the screen and instructed to respond if and only if an X appears in the upper half of the screen, inhibiting the impulse to respond to Xs in the lower half of the screen and Ys generally. A total of 150 stimuli are presented at the rate of 1.2 secs. Total duration of the task is 5 minutes.
Working Memory (WM) measured by the Letter-N-Back (LNB).
This test (Gur et al., 2001; Ragland et al., 2002) displays sequences of uppercase letters with stimulus duration of 500ms. In the 0-back condition, participants respond to a single target (i.e., X); in the 1-back condition they respond if the letter is identical to that preceding it; in the 2-back condition, they respond if the letter is identical to that presented two trials back. There are 30 target trials (10 per condition) and 60 foil trials (20 per condition) presented at the rate of 2.5 sec. Total duration of task is 10 minutes.
Processing Speed (PS) measured by the Digit-Symbol Substitution Test (DSST).
The DSST (Knowles et al., 2012) in its CNB implementation requires the participant to refer to a displayed legend relating each of the digits 1 through 9 to specific symbols. One of nine symbols appears on the screen paired with a number, and the participant decides whether the pairing is correct or incorrect. A total of 54 trials are presented randomly. The test duration is fixed at 1.5 minutes.
2.2.2. Episodic Memory
Verbal (Word) Memory (VME) measured by the Penn Word Memory Test (PWMT).
This test (Gur et al., 1997) presents 20 target words that are then mixed with 20 foils equated for frequency, length, concreteness, and imageability. Participants are asked to memorize the target words as they are presented (5 sec) and after the presentation of the target words they are shown targets and foils and asked whether a word presented was included in the target list on a 1 to 4 scale (definitely yes; probably yes; probably not; definitely not). Total task duration is about 3.5 minutes.
Face Memory (FME) measured by the Penn Face Memory Test (PFMT).
This test (Gur et al., 1997, 2001) presents 20 faces that are then mixed with 20 foils equated for age, sex, and ethnicity. The presentation paradigm is otherwise identical to the verbal and spatial memory tests. Total task duration is about 3.5 minutes.
Spatial Memory (SME) measured by the Visual Object Learning Test (VOLT).
This test (Gur et al., 2001, Glahn et al., 1997) uses Euclidean shapes as stimuli with the same paradigm as the word and face memory. A total of 10 shapes are presented 5 secs apart and after the presentation of the target shapes they are shown 10 targets and 10 foils and asked whether a shape presented was included in the target list on a 1 to 4 scale (definitely yes; probably yes; probably not; definitely not). Total task duration is about 3 minutes.
Relational Memory (RME) measured by the Digit Symbol Recall (DSR).
This test measures associative memory by requiring participants to associate the digits with appropriate symbols from the DSST. The task duration is about 1.5 minutes.
2.2.3. Complex Cognition
Language (Verbal) Reasoning (LAN) measured by the Penn Verbal Reasoning Test (PVRT).
This test (Gur et al., 1982, 2010) consists of verbal analogy problems. A total of 15 trials are presented. The task duration is about 3 minutes.
Nonverbal (Matrix) Reasoning (NVR) measured by the Penn Matrix Reasoning Test (PMAT).
This test (Gur et al., 2010) consists of matrices requiring reasoning by geometric analogy and contrast principles. A total of 24 trials are presented but task stops if participant makes 5 consecutive errors. The task duration is about 5 minutes.
Spatial Processing (SPA) measured by the Penn Line Orientation Test (PLOT).
This test (Gur et al., 2010) presents two lines at an angle, and participants mouse-click on a ‘button’ that makes one line rotate until they consider it to have the same angle as the other. The relative location of the lines, their sizes, and the number of degrees of rotation with each click differ across trials. A total of 24 trials with short and long line lengths and 3, 6, or 9 degree rotation are presented. The task duration is about 5 minutes.
2.2.4. Social Cognition
Emotion Identification (EID) measured by the Penn Emotion Identification Test (PEIT).
This test (Carter et al., 2009; Kohler et al., 2014) displays 40 faces expressing one of four emotions (happy, sad, anger, fear) and neutral faces, eight each. Faces are presented one at a time, and the participant selects the emotion displayed from five choices. The facial stimuli are balanced for sex, age, and ethnicity. The task duration is about 4 minutes.
Emotion Intensity Differentiation (EDI) measured by the Penn Emotion Differentiation Test (PEDT).
This test (Gur et al., 2010) presents pairs of emotional expressions, each pair from the same individual expressing the same emotion, one more intense than the other or of equal intensity. Gradations of intensity were obtained by morphing a neutral to an emotionally intense expression and the difference between pairs of stimuli ranged between 10 and 60% of mixture. The task is to click on the face that displays the more intense expression or indicate that they have equal intensity. The same emotions are used as for the PEIT, but the faces are different. A total of 36 trials are presented. The task duration is about 3 minutes.
Age Differentiation (AGD) measured by the Penn Age Differentiation Test (PADT).
This test (Gur et al., 2010) requires the participant to select which of two presented faces appears older, or if they are the same age. The stimuli were generated by morphing a young person’s face with that of an older person who has similar facial features. Stimuli vary by percent of difference in age (calculated based on the percentage contributed by the older face) and are balanced for sex and ethnicity. A total of 36 stimuli are presented. The task duration is about 3 minutes.
2.2.5. Reward Decision-Making
Delay Discounting (DD, a.k.a. Intertemporal Choice) measured by the DDISC; Effort Discounting (ED) measured by the EDISC; Risk Discounting (RD, a.k.a. Risk Aversion) measured by the RDISC.
In each task (Pehlivanova et al., 2018; Yu et al., 2017; Westbrook et al., 2013), the participant makes a series of 34 self-paced hypothetical choices, between two options: 1) a smaller amount of money at low cost (or zero delay for the DDISC, or single effort problem for the EDISC, or zero risk/100% certain reward for the RDISC), and 2) a larger amount of money at higher cost (or delay from 1 day-6 months for the DDISC, or effort 30-630 problems for the EDISC, or 50% risk/50% chance of reward for the RDISC). Across-trial variation in reward and/or cost magnitudes allows discounting parameters (reflecting reduction in subjective value of monetary reward for a particular cost) to be estimated for each participant based on their binary choices. In the EDISC, effort problems involve choosing which of two numbers is larger, a simple task designed to minimize confounding effects from cognitive or motor impairment; participants are required to perform 100 of these problems (~1.5min) prior to answering the hypothetical questions so the nature of the effort is understood. The RDISC and DDISC take about 3 minutes and EDISC task is about 6 minutes.
2.2.6. Sensorimotor Speed
Sensorimotor Praxis Speed (SM) measured by the Motor Praxis Test (MP).
This test (Gur et al., 2010) requires moving the mouse and clicking on a green square that disappears after the click. The square gets increasingly small and appears in unpredictable locations. The total task duration is 2 minutes.
Motor Speed (MOT) measured by the Finger Tapping Test (TAP).
This test (Gur et al., 2010) measures how many times a participant can press the spacebar using only the index finger in 10 seconds. Each hand receives 5 trials in counterbalanced order. The total task duration is about 2.5 minutes.
2.2.7. Clinical Measurement
GOASSESS.
The GOASSESS (Calkins et al., 2014, 2015) was abbreviated and modified from the epidemiologic version of the NIMH Genetic Epidemiology Research Branch Kiddie-SADS. Modifications included addition of the diagnostic screener from the adolescent version of the World Health Organization Composite International Diagnostic Interview (CIDI) (Merikangas et al., 2009), and, given the broad age range (8-21 years old) of the initial implementation sample (Philadelphia Neurodevelopmental Cohort, PNC), items were slightly revised as necessary for applicability to both children and adults. The psychopathology screen assesses lifetime occurrence of 13 major domains of psychopathology including mood (major depression, mania), anxiety (generalized anxiety, separation anxiety, specific phobia, social anxiety, panic, agoraphobia, obsessive-compulsive, post-traumatic stress), attention deficit/hyperactivity, and behavioral (oppositional defiant, conduct). Additionally, two screening tools to assess the psychosis spectrum were embedded within the psychopathology screen, including positive subpsychotic symptoms via the PRIME Screen-Revised (PS-R) (Kobayashi et al., 2008; Miller et al., 2004), and positive threshold psychotic symptoms (lifetime hallucinations and/or delusions) using the modified K-SADS psychosis screen. Items from the PRIME are scored on a scale of 0 to 6, while all other GOASSESS items are scored as binary (yes/no). Additionally, all items have an option of “Don’t know // Prefer not to say”, treated as missing data if endorsed.
Personality Inventory for DSM-5-Brief Form (PID-5-BF).
To complement and extend psychopathology construct coverage for the current investigation, we added the PID-5-BF-Child (Krueger et al. 2015), assessing five personality trait domains (negative affect, detachment, antagonism, disinhibition, and psychoticism). Items from the PID are scored on a scale of 0 to 3 with an additional option of “Don’t know // Prefer not to say”, treated as missing data if endorsed.
2.3. Psychometric Approaches
Construction of the CAT-CCNB proceeded in multiple steps, and the approach used depended on the type of test. Below, we describe the four approaches taken: unidimensional item response theory (IRT) modeling; multidimensional (bifactor) IRT modeling; parallel unidimensional IRT modeling; and creation of abbreviated forms using a previously established method. For the CAT methods specifically, we follow many of the recommendations laid out by Reeve et al. (2007), including evaluation of, 1) traditional item and scale properties (e.g., response frequencies, coefficient alpha, etc.), 2) assumptions of IRT models (unidimensionality, monotonicity, local independence), 3) model fit statistics, and 3) scale information functions.
2.3.1. Unidimensional IRT
The first approach—most closely resembling traditional adaptive test construction—involved estimation of a unidimensional IRT model to obtain item parameter estimates for calculating an information function for each item. The unidimensional model used here was the 2-parameter model described by Equation 1:
| (1) |
Where pi(Xi = 1 | Θ) is the probability of a correct response to item i (given θ), ai is the item discrimination for item i, bi is the item difficulty, and θ is the trait level (usually, ability level) of the person. Graphically, this function is a sigmoidal curve with a lower asymptote at 0 and an upper asymptote at 1. The discrimination parameter determines the slope of the curve at its inflection point, and the difficulty parameter determines where on the x-axis (θ) there is a 0.5 probability of endorsement or correct response. A curve shifted to the left would be an “easy” item because the examinee could be low on the trait and still have a 0.5 probability of a correct response; a curve shifted to the right would be a “difficult” item, because the examinee would have to be high on the trait before having a 0.5 probability of a correct response. Figure 1 shows three item response functions corresponding to Equation 1; the blue and red curves have equal difficulties but different discriminations, and the blue and green curves have the same discriminations but different difficulties. The item parameter estimates resulting from such a model allow the assessment of item quality. “Quality” in this case means the amount of information the item produces at any given point on the trait continuum, which is a direct function of the item parameters:
| (2) |
Where I(θ) is the information produced by the item, ai is the item discrimination, pi(θ) is the probability of a correct response, and qi(θ) is the probability of an incorrect response. This, in turn, relates to measurement error via:
| (3) |
Where SE(θ) is the standard error of measurement, meaning standard error decreases as information increases. Thus, the item produces maximum information (and minimum standard error) at the point where the probability of a correct response and incorrect response are both exactly 0.5, and information always increases with increasing ai. An implication is that an item always provides maximum information at the point where its difficulty is the same as the examinee’s trait level - i.e., an “easy” item will provide little information about a person high on the trait, and vice versa. The information function described by Equation 2 is the key feature used when a CAT algorithm is deciding how to administer items in real time. After the first item-administration (and response), the CAT algorithm estimates the examinee’s trait level, and based on this rough estimate, chooses the most appropriate next item to administer, where “most appropriate” is determined by how much information it will provide. After the next item administration (and response), the algorithm uses both item responses to estimate the examinee’s ability. Then the next most appropriate item is selected, and so on. The test stops when some stopping criterion is met - e.g., when the examinee’s standard error of measurement (SEM) reaches a predetermined lower bound. Supplementary Figure S1 shows a schematic diagram of the above steps for clarity.
Figure 1.

Example Item Characteristic Curves demonstrating how curve shape depends on item characteristics (parameters).
Note that the information provided by an item is not captured by a single value; instead, it is a function of trait level. Thus, the most appropriate second item to administer for one examinee might not be the same as the most appropriate second item for an examinee of lower or higher ability. Notably, because the IRT-based scoring algorithm used in CAT considers the difficulty of items administered, two examinees can be scored on the same scale even if they are administered completely different items. If all items in the bank were calibrated together (as was the case here), any subset of items from that bank can be used to score someone on a scale common to all others’ scores using any other subset of items from that bank. With all items calibrated and information functions estimated, the item bank is ready for use in CAT. Among tests and scales optimized for the CAT-CCNB, three neurocognitive tests (PVRT, DDISC, and EDISC) and five clinical scales (Mood-Anxiety, Phobias, Psychosis, Externalizing, and Disordered Personality) required this unidimensional IRT approach.
2.3.2. Multidimensional (bifactor) IRT
Our second approach to building item banks was similar to the first, except that multidimensional IRT (MIRT) was used (Reckase, 2009). As discussed by Smits et al. (2018), the choice of multidimensional model depends on whether one wishes to capture correlated dimensions (with or without a second-order dimension) or a single dimension with multidimensionality treated as “nuisance” to be controlled for. In all tests for which MIRT was used here, the goal was the latter—a single dimension was assessed, controlling for multidimensionality—and the bifactor model was therefore most appropriate.
Analyses of our tests have revealed that some produce multidimensional data, making the unidimensional 2-parameter model described in Approach #1 inappropriate. Using a unidimensional IRT model on multidimensional data can result in biased discrimination parameter estimates (Reise, Cook, & Moore, 2015; Reise, Moore, & Maydeu-Olivares, 2011). Thus, although we were seeking a single performance score from each test, it was nonetheless necessary to account for the multidimensionality in certain tests to ensure unbiased parameter estimates. Dimensionality was determined largely by a priori knowledge of how items would split by dimension; for example, if a test comprised “targets” and “foils” to which a person was meant to respond (or not), previous unpublished and published (Thomas et al., 2018) work on these tests suggested that the data would comprise two dimensions (one for targets and one for foils). To account for the multidimensionality, the unidimensional model (Eq. 1) can be expanded to account for multiple dimensions as follows:
| (4) |
Where pi(Xi = 1 | θ1, θ2) is the probability of a correct response to item i given two different trait dimensions (θ1 and θ2), ai1 is the item discrimination for dimension 1, ai2 is the item discrimination for dimension 2, bi1 is the item difficulty for dimension 1, and bi2 is the item difficulty for dimension 2. This model can account for as many dimensions as necessary and almost any structural configuration necessary. One method of modeling multidimensional data is bifactor modeling (Reise, 2012; Reise, Moore, & Haviland, 2010), which allows items to load on one general factor and one specific factor (depending on the sub-factor to which it belongs). An advantage of bifactor modeling is that it accounts for multidimensionality to ensure optimally estimated item parameters on the general trait of interest. This procedure ensures that the parameter estimates on the factor of interest (the general) are unbiased and can be used, in all subsequent steps, as though they were estimated in a unidimensional model. This approach was used for three neurocognitive tests (PLOT, PMAT, and RDISC).
2.3.3. Parallel Unidimensional IRT
The third test optimization method involved estimation of two unidimensional models for a single test with the goal of producing two scores that are combined in a similar manner to d-prime (Swets, Tanner, & Birdsall, 1961). An advantage of d-prime is that it accounts for both sensitivity (ability to correctly detect a signal or to correctly respond “yes”) and specificity (the ability to refrain from responding in the absence of a signal or to correctly respond “no”). This approach was necessary when the general factor from the bifactor model (see #2 above) was especially weak—i.e., too weak to generate non-negligible discrimination parameters. This phenomenon occurred when multiple dimensions of a test (usually two) were nearly orthogonal (or even correlated negatively), implying no clear underlying (general) factor to capture in a bifactor model. This is especially common in tests requiring the participant to choose between two options, such as whether they have seen a particular face in a face memory task. Relatedly, when a subject is being asked to judge between the presence or absence of something, this can generate similarly orthogonal factors. For example, on the ER40, participants are asked to identify which emotion is displayed on a face, but there is also an option for “no emotion” (neutral). This format introduces a signal-detection element because, before deciding which emotion is displayed, the subject must first decide whether there is an emotion displayed at all. The factor structure of the ER40 clearly reflects this phenomenon, whereby the emotive stimuli form one factor and the non-emotive (neutral) faces form another factor, indicating distinct abilities to identify an emotion and to “detect” absence of any emotion. These two stimulus sets (in the case of the ER40, emotive and neutral; in the case of the memory tests, targets and foils) were calibrated in separate unidimensional models to obtain two item banks. Participants still receive stimuli from each tree intermingled with the other and in a fully adaptive framework, but the order in which the two different banks are used is pseudo-random and determined beforehand (different for each form). The adaptive aspect (item-selection) occurs only within-tree, producing two scores on a z-metric. These scores are then added together and divided by the square root of two (to keep them on the z-metric after addition).
To summarize, in Sections 2.3.1 and 2.3.2, we described how either unidimensional or multidimensional models could be used to arrive at a single test score. In some cases, however, neither a unidimensional nor a bifactor model will work for obtaining a single score because the data patterns are influenced by two factors (prohibiting a unidimensional model) that are uncorrelated (prohibiting a bifactor model). Unless one is willing to accept two separate scores for the test, which is not desirable here, an alternative approach is necessary. Specifically, two (mostly uncorrelated) scores were calculated, and these two scores were combined into a single score. In most measurement scenarios, it would not make sense to combine unrelated scores, but the tests for which this method was used here are all special cases of Signal Detection (Lynn and Barrett, 2014) problems, where the ability to detect the signal (such as affirming having seen a face in the face memory test) and rejecting a foil (such as a face not seen previously) are often orthogonal but theoretically related nonetheless. This approach was used for six neurocognitive tests (CPF, CPW, VOLT, MEDF, ADT, and ER40).
2.3.4. Creation of Abbreviated Forms (“Short-Forms”)
The fourth optimization approach used here has been described in detail elsewhere (Moore et al., 2021) and involves two complementary methods with the aim of developing a short-form rather than a truly adaptive version. Many tests are not amenable to CAT because stimuli on these tests lack meaningfully different information functions, the exact parameters that determine the appropriateness of items during adaptive administration. Further, they often involve continual, rapid display of stimuli to which the examinee must respond (or not). The complex background calculations involved in CAT (e.g., re-estimating ability level after each response), could interrupt pacing of the task. With contemporary computing power, it is unlikely that CAT administration of rapid tasks is safe for unbiased measurement, especially when incorporating speed logs at the millisecond level2. It is worth noting that there are adaptive testing methods that would be appropriate for the rapid tests described here (see Yan et al., 2016), such as multistage testing (sometimes called sequential testing) where sets of items are administered before “routing” the test-taker to easier or harder sets of items. However, here, because we were limited to existing rapid tests with limited item “banks”—i.e. time and resources could not be allocated to development of new test stages for multistage tests—development of adaptive tests of this type was not feasible. The two complementary methods used here were as follows:
1. CAT simulation to determine the most appropriate short-form. As detailed in Moore et al. (2021) and used successfully in multiple cognitive (Bezdicek et al., 2020; Moore et al., 2015; Roalf et al., 2016) and non-cognitive (Lawson et al., 2020; Moore et al., 2020; Saine et al., 2020) assessments, this method involves calibrating the items using an appropriate IRT model and then simulating what would have happened if examinees had taken an adaptive form of a test. Of particular interest is which items were selected most often for administration during the CAT simulations, where the more often an item is administered, the “better” it is judged to be. Generally, items with higher discrimination parameters will be selected, but an item’s “quality” also depends on its difficulty. For example, a highly discriminating item with extremely high difficulty might actually be a sub-optimal item since very few people will be in the “extremely high” trait range. It is difficult for a psychometrician to “eyeball” a set of item parameters to determine which combination will yield the best test properties, and the CAT simulation process solves the problem.
2. Simulate successively shorter tests to determine how length affects the score’s association with external criteria and with its own full-form. Many endeavors of short-form creation use variations of this method (Basner, Mollicone, & Dinges, 2011; Cerin et al., 2006; Nenkov et al., 2008) because the benefits of using external validity criteria to evaluate the quality of a short form are obvious. Indeed, proof of validity implies reliability, because it is possible for a test to be reliable and not valid but impossible for a test to be valid and not reliable. For this method, a short-form was created by removing one item—either the last item or a random item, depending on how the stimuli are selected from the bank—and the score of that short-form was related to some criteria (e.g., other cognitive tests in the battery) and to its own full-form. The sizes of these relationships were recorded, and the process was repeated after removing two items, and then three, and so on. The above process was repeated 500 times to obtain 95% confidence intervals3 (CIs) around the effect size (correlation) estimates, and these intervals were used in combination with a pre-set rule to determine when the test had been shortened “too much”. For example, the rule for full-form-short-form correlation was that it had to be at least 0.95, so if the 95% CIs included 0.95, the short-form was considered “too short”. Note that some tests did not have randomness built into them—e.g., the NBACK has fixed-order stimuli and the short form was investigated by removing successively more items from the end of the test—meaning repeating the above process 500 times would yield identical results each time. In these cases, randomness was created by bootstrapping subjects each time (sample N participants with replacement). This approach was used for five tests (CPT, NBACK, DSST, GNG, AIM). In cases where the targets and foils on each test formed distinct uncorrelated factors, the third approach described above was used—i.e., targets and foils were modeled separately, and the mean recommended length was taken as optimal for the whole short-form.
2.3.5. Clinical Battery: Unidimensional and Graded Response IRT
For the clinical battery, the first approach above (unidimensional IRT) was used. Previous analyses (Moore et al., 2019a; Shanmugan et al., 2016) of the clinical item responses from the Philadelphia Neurodevelopmental Cohort (Calkins et al., 2015) revealed a clear multidimensional structure comprising four factors, consistent with Krueger’s three factors (Mood-Anxiety, Phobias, and Externalizing) (Krueger, 1999) plus Psychosis. As anticipated from the above research using the same items, the adaptive clinical battery produced four scores—Anxious-Misery, Psychosis, Externalizing, and Fear—each modeled as its own unidimensional trait. Additionally, there was a separate clinical factor related to personality traits, which was also modeled unidimensionally. Note that, because the subthreshold psychosis and personality scales included some ordered/Likert-type items, we had to use an expansion of the 2-parameter model called the graded response model (GRM) (Samejima, 1969) for polytomous (ordered/Likert) responses. The graded response model works in the same way as the 2-parameter model, but with the addition of extra difficulty parameters reflecting the “thresholds” along theta (trait) where the probability of responding in one Likert category (e.g., the lowest) is overtaken by the probability of responding in the next category (e.g., the second-lowest).
| (5) |
Where pxij(Xij ≥ bij | θ) is the probability of responding above threshold bi on item j (given θ), aj is the item discrimination for item j, bij is the location along the trait continuum of the threshold, and θ is the trait level of the person. Each item has multiple bi parameters, one for each boundary between response options; for example, an item with four response options would have three bi parameters, representing the three locations along the trait continuum where each response option becomes more probable than the response below it. Application of IRT to develop adaptive versions of clinical scales has a long history, and readers are directed to Gibbons et al. (2008) and Thissen et al (2007) for review, as well as Gibbons et al. (2016) for further advances in such testing beyond unidimensional IRT. The above literature guided the creation of our five clinical scales presented here.
2.4. Test linking
A crucial step in the item calibration process was linking of item parameters across test forms. To build a large item bank, administration to a single group is not feasible. An alternative is to administer parts of the item bank to several samples. To approximate what the item parameter estimates would be if administered to a single group, we used an IRT-based method called “linking”. The first step was to break the item bank into groups of items, each to be administered to a different sample, while ensuring that some items remain constant across groups. Figure 2 illustrates this process: the item bank comprises 8 items, which are broken into two parts (items 1-5 and items 4-8), where items 4 and 5 are the linking items. Once the item parameters are estimated (separately) for items 1-5 and 4-8, the linking items can be used to estimate metric transformation coefficients (MTCs), which are then used to link the item parameters from group 1 to those from group 2 (or vice versa). Specifically:
| (6) |
Where ξ* is the adjusted parameter estimate (discrimination or difficulty), ξ” is the original (unadjusted) parameter estimate, and ς and κ are the MTCs. MTCs are obtained for each parameter estimate to be adjusted. With all estimates on the same scale, the linked item bank can be used as though it were estimated in a single sample using a single model. Note that in all tests administered for this study, linking items composed at least 30% of the test, and MTCs were estimated concurrently across forms (as opposed to separately for each pair of forms); see Hanson & Beguin (2002) and Kim & Cohen (2002) for more information on the optimal number of linking items.
Figure 2.

Example of an item linking framework whereby most items are administered to only some examinees while other (“linking”) items are administered to all examinees.
2.5. CAT Test Construction
The above sections described the theoretical basis and statistical procedures necessary for creating CAT-CCNB test forms. In addition to these steps, there was the practical “engineering” step of actually building the tests. This introduced practical problems such as which software platform to use (beyond the present scope) and deciding whether to administer and score the CATs in real time, item-by-item. For the tests and scales that are truly adaptive/CAT (PVRT, DDISC, EDISC, RDISC, PLOT, PMAT, PRA, CPF, CPW, VOLT, MEDF, ADT, ER40, and all clinical measures), test administration followed a “decision-tree” procedure to avoid the need for on-the-fly calculations of examinee trait level, standard error, and next item. For example, the maximum length for most tests used here (beyond which there is no gain from the increased complexity of CAT) is twelve items, meaning every possible response pattern (along with trait level, standard error, and item administered) can be hard-coded in a pre-made table with only 212 = 4,096 rows. No matter what response pattern the examinee gives, s/he will remain on one of the 4,096 “branches” in the decision tree, ultimately resulting in a single score corresponding to the 12-item pattern given. Because standard error and trait level at each step are included in the tree, it is possible to stop the test/scale at any time between 2 and 12 items (e.g., depending on whether speed or precision is to be emphasized). The main weakness of this approach is that the size of the “decision-tree” table can become prohibitively large, even for moderate-length tests. For example, if items are polytomous/Likert, the set of all possible response vectors grows very fast with each additional item. The psychosis and personality scales used here included polytomous items, limiting us to nine items total (instead of twelve), with the trees comprising 227,795 and 260,363 rows, respectively. Even in dichotomous cases, it might be that twelve items are not enough (e.g., due to low discriminations). The ER40 used here had to be extended to fifteen items, resulting in 215 = 32,768 possible response vectors. If it were necessary to lengthen tests much more (especially the three mentioned here), the “decision-tree” approach might not be feasible, possibly necessitating on-the-fly scoring. This relates to a second weakness of the “tree” approach taken here, which is that, if the test does not reach a sufficiently low standard error by the end of the tree, there are no further items that can be administered. This means that examinees will differ in their standard errors by the end of assessment, depending on how much information was obtained in the administration. The reason for this approach, despite the limitation, is that we anticipate that the CAT-CCNB will usually use a “fixed-length” stopping rule (rather than a SEM-based stopping rule), making the administration time more predictable for large-scale data collection planning. The “fixed-length” rule, stopping after 12 items, will still outperform 12-item short-forms because the 12 items administered will be catered to the examinee (maximizing information) rather than administering the same 12 items to all examinees.
Finally, note that the “tree-based” approach to administering the tests described here is not to be confused with tree-based methods of test development and scoring that are alternatives to IRT-based methods (see, e.g. Yan et al., 2004). Here, all adaptive testing is IRT-based, with “trees” being used only in the administration step; by contrast, methods such as those presented in Yan et al. (2004) are alternatives to IRT altogether.
3. Results
3.1. Scale characteristics, item fit, and IRT assumptions
Supplementary Table S2 shows classical test characteristics, IRT model fit, and tests of IRT assumptions (unidimensionality, monotonicity, local dependency) for each test. Fifty-two of the 70 Cronbach’s alpha values (74.3%) fall within the acceptable range of 0.70-1.00. Sixty-five of the 70 CFI values (92.9%) are ≥ 0.90. Fifty of the 70 1st:2nd Eigenvalue ratios (71.4%) are ≥ 3.0. 62 of the 70 TLI values (88.6%) are ≥ 0.90. Sixty-seven of the 70 RMSEA values (95.7%) are < 0.08. Sixty-six of the 70 SRMSR values (94.3%) are < 0.08. Fifty of the 70 proportions of monotonicity violations (71.4%) are ≤ 0.10. Fifty-four of the 70 local dependency values (77.1%) are ≤ 0.10. The ER40 1 Targets has a Cronbach’s alpha of 0.69, 1st:2nd Eigenvalue ratio of 2.3, CFI of 0.80, TLI of 0.79, and 18.8% of items have monotonicity violations, violating these five IRT assumptions. SVOLT 1 Targets fails four IRT assumptions with a Cronbach’s alpha of 0.5, 1st:2nd Eigenvalue ratio of 1.9, CFI of 0.85, and TLI of 0.81. EDISC 2 has an RMSEA of 0.100, SRMSR of 0.097, 32.4% of items have monotonicity violations, and 46% locally dependent items, also failing four IRT assumptions. These results, taken together, suggest that some of the tests may not be appropriate for CAT, which will be further investigated in a subsequent validation manuscript. Particular attention will need to be paid to the memory tests (CPW, CPF, VOLT) and the emotion recognition test (ER40).
3.2. Decreasing SEM per item administered
Table 2 shows the mean SEM for numbers of items administered, which ranges from five to twelve for all tests. All of the CAT-ed tests show a clear decrease in mean SEM as more items are administered except ER40 targets. In this set of items, the SEM increases initially, albeit only a small amount, and the SEM starts decreasing after 8 items. The ER40 is the only test that administers up to 15 items, and both the target and foil item sets showed a consistent 0.003 decrease in SEM per item administered after 12 items. The MEDF foils also show essentially no change in SEM with increasing items administered, likely due to extreme difficulty parameters. CPW foils initially increase SEM when going from five items administered to six, but then decrease with additional items administered.
Table 2.
SEM per Item Administered for CNB “CATed” Tests
| Number of Items Administered | ||||||||
|---|---|---|---|---|---|---|---|---|
| 5 | 6 | 7 | 8 | 9 | 10 | 11 | 12 | |
| ADT Targets | 0.506 | 0.501 | 0.491 | 0.482 | 0.471 | 0.462 | 0.453 | 0.445 |
| ADT Foils | 0.466 | 0.464 | 0.458 | 0.456 | 0.452 | 0.448 | 0.445 | 0.442 |
| CPF Targets | 0.463 | 0.459 | 0.450 | 0.443 | 0.435 | 0.430 | 0.422 | 0.415 |
| CPF Foils | 0.465 | 0.451 | 0.439 | 0.427 | 0.416 | 0.405 | 0.395 | 0.388 |
| CPW Targets | 0.470 | 0.463 | 0.458 | 0.451 | 0.442 | 0.435 | 0.426 | 0.420 |
| CPW Foils | 0.425 | 0.435 | 0.428 | 0.424 | 0.417 | 0.409 | 0.406 | 0.400 |
| ER40 Targets | 0.487 | 0.494 | 0.502 | 0.502 | 0.499 | 0.496 | 0.491 | 0.487 |
| ER40 Foils | 0.470 | 0.472 | 0.468 | 0.460 | 0.454 | 0.448 | 0.443 | 0.437 |
| MEDF Targets | 0.456 | 0.445 | 0.434 | 0.425 | 0.417 | 0.408 | 0.402 | 0.395 |
| MEDF Foils | 0.405 | 0.414 | 0.414 | 0.419 | 0.416 | 0.415 | 0.420 | 0.414 |
| VOLT Targets | 0.487 | 0.486 | 0.483 | 0.480 | 0.476 | 0.470 | 0.468 | 0.463 |
| VOLT Foils | 0.468 | 0.462 | 0.454 | 0.446 | 0.438 | 0.432 | 0.425 | 0.420 |
| DDISC | 0.260 | 0.241 | 0.229 | 0.217 | 0.204 | 0.194 | 0.186 | 0.179 |
| EDISC | 0.345 | 0.323 | 0.306 | 0.294 | 0.283 | 0.274 | 0.267 | 0.258 |
| PLOT | 0.514 | 0.505 | 0.493 | 0.483 | 0.473 | 0.464 | 0.457 | 0.450 |
| PMAT | 0.455 | 0.421 | 0.394 | 0.370 | 0.351 | 0.335 | 0.321 | 0.309 |
| PVRT | 0.467 | 0.450 | 0.431 | 0.413 | 0.399 | 0.387 | 0.378 | 0.369 |
| RDISC | 0.412 | 0.384 | 0.349 | 0.327 | 0.308 | 0.291 | 0.279 | 0.269 |
| CAT-CCNB Anxious-Misery | 0.386 | 0.355 | 0.336 | 0.321 | 0.308 | 0.298 | 0.288 | 0.282 |
| CAT-CCNB Externalizing | 0.399 | 0.374 | 0.357 | 0.344 | 0.333 | 0.323 | 0.314 | 0.307 |
| CAT-CCNB Fear | 0.382 | 0.366 | 0.348 | 0.334 | 0.324 | 0.315 | 0.307 | 0.299 |
| CAT-CCNB Personality | 0.395 | 0.367 | 0.343 | 0.327 | 0.311 | |||
| CAT-CCNB Psychosis | 0.510 | 0.409 | 0.367 | 0.334 | 0.314 | |||
Note: A total of 15 items are actually administered in the ER40 (SEM decreases ~0.003 for each additional item administered for both targets and foils). CAT-CCNB Personality and Psychosis scales have a maximum of 9 items.
Five of the 23 scores in Table 2 have a final expected SEM of < 0.30 (analogous to Cronbach’s alpha of 0.91)4, and 20 of the scores result in SEM < 0.45 (analogous to Cronbach’s alpha of 0.80). By some standards, alpha > 0.70 is acceptable for group-level measurement, while > 0.90 is acceptable for individual-level measurement (Reeve et al., 2007, p. S25). The CAT-CCNB is currently being designed for research purposes, where group-level measurement is a more common goal, meaning most of the tests reach a sufficiently low standard error by this standard. However, if the battery’s scores were intended for use in making decisions at the individual level (e.g. whether to administer treatment or be recommended for remedial education), many of these scores lack sufficient precision. It is therefore likely that future versions of the CAT-CCNB, if designed for individual-level decision-making, will need to be longer and/or include larger item banks.
3.3. Test Information Function (TIF) Graphs
Please see Supplement for complete test information function graphs and descriptions. An example for the Delay Discounting Task item bank is shown in Figure 3. The first thing to note is that the peak reaches extremely high information (~85), meaning someone with a trait level of 0.40 (the Theta level where the peak is) who was administered the whole item bank would receive an expected SEM of 1/sqrt(85) = 0.11, more precise than any existing high-stakes standardized test or licensure exam. For perspective, this SEM is equivalent to a Classical Test Theory Cronbach’s alpha of ~0.99, although note that most of the TIFs calculated here do not reach such a high peak (see Supplement for all TIFs, with description). The second thing to notice about Figure 3 is that the TIF remains at or above 5 (SEM = 0.45) for a large range of the trait continuum, from about −3 to >3. This means that there is no range of Theta in which one would expect high/unacceptable standard errors for the DDISC. Most tests developed here, however, are more typical in that they have some ranges of Theta where SEM might not reach acceptable levels. For example, the information function for the PLOT24 shown in Figure S8 reaches values of 5+ only between theta values of approximately −2 and 1, indicating that individuals of very high ability (e.g. 1.5+) might not achieve acceptable measurement precision for some purposes.
Figure 3.
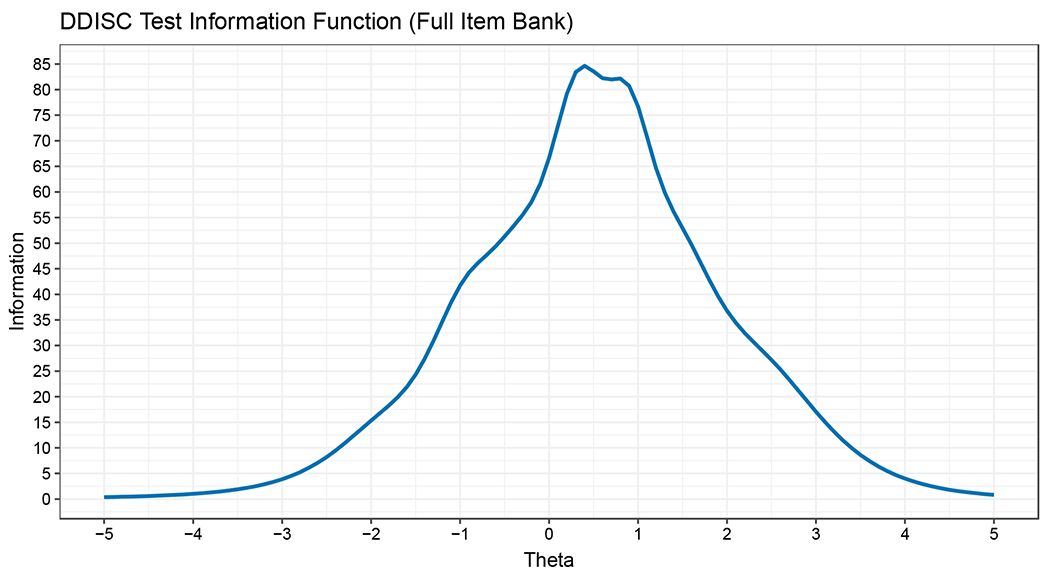
Test Information Function for the Full Delay Discounting Task (DDISC) Item Bank.
3.4. Test-Level Factor Analysis Results
For transparency, we report results of multiple exploratory methods for each test form. Because the final IRT calibration model had major implications for all downstream analyses and future research using the CAT-CCNB, we were especially thorough in exploring the factor configurations (which items load on which latent traits/factors) for each test. In cases where a unidimensional model was clearly sufficient, we report results from both tetrachoric-based 1-factor models (least-squares extraction) and the unidimensional IRT model (in factor analytic metric) ultimately used in calibration.
Please see Supplement for complete test-level EFA results and descriptions. The purpose of running exploratory itemwise analyses on the tests was to determine what type of IRT model would be optimal for calibrating the items. Through multiple preliminary analyses, we determined that no test required more than two correlated factors to model appropriately, where many require only one. Table 3 shows the results for the visual object learning (memory) test (VOLT, version 1), which required two factors to adequately explain item covariance. As can be seen, all four exploratory approaches produced similarly clean results, with items dividing into 10 targets and 10 foils and with all cross-loadings negligible.
Table 3.
Exploratory item-factor and Multidimensional IRT (MIRT) analyses of crowdsourced SVOLT v1 responses.
| Oblimin Rotation | Promax Rotation | |||||||
|---|---|---|---|---|---|---|---|---|
| EFA (tetrachorics) | Exploratory MIRT | EFA (tetrachorics) | Exploratory MIRT | |||||
| Item | F1 | F2 | F1 | F2 | F1 | F2 | F1 | F2 |
| SVOLT_QID013_CORR | 0.621 | 0.616 | 0.638 | 0.633 | ||||
| SVOLT_QID014_CORR | 0.566 | 0.613 | 0.539 | 0.605 | ||||
| SVOLT_QID015_CORR | 0.546 | 0.574 | 0.549 | 0.583 | ||||
| SVOLT_QID010_CORR | 0.425 | 0.418 | 0.420 | 0.426 | ||||
| SVOLT_QID018_CORR | 0.415 | 0.443 | 0.416 | 0.454 | ||||
| SVOLT_QID005_CORR | 0.400 | 0.397 | 0.426 | 0.415 | ||||
| SVOLT_QID004_CORR | 0.361 | 0.338 | 0.381 | 0.351 | ||||
| SVOLT_QID008_CORR | 0.348 | 0.342 | 0.345 | 0.347 | ||||
| SVOLT_QID002_CORR | 0.294 | 0.332 | 0.285 | 0.329 | ||||
| SVOLT_QID020_CORR | 0.348 | 0.274 | 0.356 | 0.271 | ||||
| SVOLT_QID019_CORR | 0.775 | 0.793 | 0.794 | 0.811 | ||||
| SVOLT_QID006_CORR | 0.749 | 0.772 | 0.767 | 0.779 | ||||
| SVOLT_QID009_CORR | 0.698 | 0.701 | 0.714 | 0.705 | ||||
| SVOLT_QID017_CORR | 0.684 | 0.698 | 0.259 | 0.701 | 0.715 | |||
| SVOLT_QID011_CORR | 0.679 | 0.712 | 0.695 | 0.720 | ||||
| SVOLT_QID012_CORR | 0.534 | 0.592 | 0.546 | 0.587 | ||||
| SVOLT_QID003_CORR | 0.508 | 0.481 | 0.519 | 0.475 | ||||
| SVOLT_QID016_CORR | 0.384 | −0.268 | 0.398 | 0.392 | 0.383 | |||
| SVOLT_QID007_CORR | 0.352 | −0.274 | 0.339 | 0.359 | −0.254 | 0.323 | ||
| SVOLT_QID001_CORR | 0.348 | 0.284 | 0.356 | 0.276 | ||||
Note: The inter-factor correlation for the Exploratory Item-Factor and Multidimensional IRT analyses are −0.06 and −0.062 with oblimin rotation and −0.225 and −0.198 with promax rotation, respectively. Loadings < 0.25 removed.
4. Discussion
The need for broad yet efficient measurement of cognitive and clinical domains is clear, especially given the increased desirability of large-scale, “big science” approaches to data collection. The history of assessment has shown a steady increase in efficiency from (sometimes day-long) paper-and-pencil tests/interviews (Birmaher et al., 2009; Jacobs, 1887; Stroop, 1935), to more rapid computerized testing (Burke & Normand, 1987; Mead & Drasgow, 1993), and finally to adaptive testing (CAT) (Meijer & Nering, 1999) that caters the test or clinical scale to the examinee (see Kessels, 2019 for review). Current computerized batteries (CANTAB, original Penn CNB, etc.) use collections of fixed-length tests developed for stand-alone administration, which still leaves room for improvement. Here, we applied contemporary psychometric approaches such as CAT to each of 22 tests and scales in a well-established battery of neurocognitive and clinical psychopathology assessments.
In addition to the neurocognitive tests, the generation of adaptive clinical scales using the same methods substantially widens the breadth of information gained from this relatively brief measure. With further research, combining cognitive and clinical assessments into a single computerized battery can facilitate implementation into screening protocols in clinical settings. Cognition and psychopathology are often not assessed in a standardized manner in clinical settings that evaluate behavioral domains related to brain function (eg. MOCA, MMSE). Such screening requires the clinician or staff to take the time to administer the tests directly, which can be difficult in a busy practice focused primarily on managing patients’ clinical care. The ability to conduct rapid and broad clinical and congitive screening that a patient could self-administer on a computer has the potential to significantly enhance the efficiency and quality of clinical care.
The efficiency-optimized battery construction described here comes with several strengths, limitations, and caveats. The strengths, mostly noted above, were facilitated by the selective use of the most appropriate method for each test (e.g. dichotomous unidimensional CAT for the PMAT, test-abbreviation for the CPT, polytomous CAT for the psychosis scale, etc.). Though all of these approaches have been utilized before in constructing measures, the current approach provides novelty through its comprehensiveness. A limitation of the study is that the calibration data described here were collected in an adult (18+) crowdsourced sample in the United States with no specific exclusion criteria beyond the performance validity (data quality) estimator described. The battery’s generalizability to younger, clinical, or international samples will therefore need to be explored in future studies. Related to this limitation, because there is no clear target assessment population—i.e. the battery is being designed for administration across a wide range of abilities, psychopathologies, demographics, and circumstances (e.g. clinical or general population)—there was no focus on maximizing information in a particular range of ability or illness severity. Later versions of the CAT-CCNB may be developed for specific target populations as the item bank iteratively expands. A second limitation is that two of the methods described here—parallel unidimensional IRT and creation of short-forms using successively shorter versions—are either completely new (in the case of the former) or have been only recently suggested (the latter; see Moore et al., 2021). Further tuning of these methods with ongoing research (including the validation study ongoing) is warranted. Related to this limitation, it has been well-documented (Kruyen et al., 2013) that short-forms suffer from several weaknesses that are often overlooked by their developers. Indeed, two of these weaknesses (covered by Smith et al., 2000)—i.e. failure to validate in an independent sample, and failure to test correlations with the full-form in independent administrations—are true of the short-forms created here. As the CAT-CCNB is used in future studies and in the currently ongoing validation study, it will become clearer whether they retain satisfactory properties or need to be re-designed. A third limitation is that, while the validity of performance (e.g. effort) in the calibration sample was measured using a previously optimized combination of response time and person fit (Scott et al., 2022), the decision to remove the bottom 5% on the validity metric was admittedly arbitrary. Unlike many measures of performance validity (e.g. Reise, 1990, 2000), which use a test statistic to establish an absolute cutoff for invalid performance, the metric used here was designed to be applied across tests of different types and lacks a generalizable absolute cutoff rule. The cutoff of “bottom 5%” was applied across all tests for simple consistency in this round of development. In future test-by-test improvements to the CAT-CCNB, it might be beneficial to adopt a validity metric optimized for the specific test (e.g. optimized for analogies, as in the PVRT). A fourth limitation is that the initial diagnostic tests of scale characteristics and IRT modeling assumptions (Supplementary Table S2) of some of the tests suggest that they (especially tests of memory and emotion recognition) might not be good candidates for CAT. Many of the results are mixed, for example with some of the tests of unidimensionality (e.g., CFI, TLI, RMSEA, SRMR, 1st:2nd eigenvalue ratios) giving opposite impressions, and the impact of these potential assumption violations will be explored in a subsequent manuscript. Related to this, a fifth clear limitation is that we have yet to provide evidence of predictive/criterion validity or comparability of the adaptive and full test forms. Data collection for such analyses, including the utility of the battery to distinguish among clinical diagnostic groups, is nearing completion and will be presented in a subsequent manuscript. We anticipate that the CAT-CCNB will become a powerful and accessible tool with widescale applications in research and clinical care.
Supplementary Material
Highlights.
Psychometric tools like item response theory and adaptive testing allow time savings
Multiple psychometric measures were optimized using contemporary methods
The abbreviated test battery provides substantial breadth of measurement
A single, brief battery provides both neurocognitive and clinical scores
Acknowledgments
This work was supported by NIMH grants MH089983, MH117014, MH096891.
Footnotes
Publisher's Disclaimer: This is a PDF file of an unedited manuscript that has been accepted for publication. As a service to our customers we are providing this early version of the manuscript. The manuscript will undergo copyediting, typesetting, and review of the resulting proof before it is published in its final form. Please note that during the production process errors may be discovered which could affect the content, and all legal disclaimers that apply to the journal pertain.
Declaration of competing interests: none.
CRediT authorship contribution statement
Tyler M. Moore - Conceptualization; Data curation; Formal analysis; Funding acquisition; Investigation; Methodology; Project administration; Supervision; Validation; Visualization; Writing - original draft; Writing - review & editing
Akira Di Sandro - Data curation; Formal analysis; Investigation; Methodology; Project administration; Validation; Visualization; Writing - original draft; Writing - review & editing
J. Cobb Scott - Conceptualization; Funding acquisition; Investigation; Methodology; Project administration; Supervision; Validation; Writing - review & editing
Katherine C. Lopez - Conceptualization; Data curation; Investigation; Project administration; Supervision; Validation; Writing - review & editing
Kosha Ruparel - Conceptualization; Data curation; Funding acquisition; Investigation; Methodology; Project administration; Software; Supervision; Validation; Writing - review & editing
Lucky J. Njokweni - Conceptualization; Data curation; Formal analysis; Funding acquisition; Investigation; Methodology; Project administration; Software; Supervision; Validation; Visualization
Satrajit Santra - Data curation; Formal analysis; Software; Supervision; Validation
David S. Conway - Conceptualization; Data curation; Formal analysis; Investigation; Methodology; Software; Validation
Allison M. Port - Conceptualization; Data curation; Project administration; Resources; Software; Supervision; Validation; Visualization
Lisa D’Errico - Data curation; Investigation; Project administration; Resources; Validation
Sage Rush - Data curation; Funding acquisition; Investigation; Project administration; Supervision; Validation
Daniel H. Wolf - Conceptualization; Funding acquisition; Methodology; Project administration; Supervision; Writing - review & editing
Monica E. Calkins - Conceptualization; Data curation; Funding acquisition; Project administration; Supervision; Validation; Writing - original draft; Writing - review & editing
Raquel E. Gur - Conceptualization; Funding acquisition; Investigation; Methodology; Project administration; Resources; Supervision; Writing - original draft; Writing - review & editing
Ruben C. Gur - Conceptualization; Data curation; Funding acquisition; Investigation; Methodology; Project administration; Resources; Software; Supervision; Validation; Visualization; Writing - original draft; Writing - review & editing
Note that, despite this targeted age range, approximately 1-3% of the sample was older than 65, with a maximum age of 80. For example, 19 out of the 1,197 participants (1.6%) in sub-sample 3 were between 66 and 80 years old.
One might ask, why not use pre-made scoring/decision “trees” as was done here (see below) to obviate the need for on-the-spot computation? This would be a good solution except that these rapid-stimulus-onset tests tend to be too large for pre-made trees. For example, the largest tree used here (limited to dichotomous-response tests) was for the ER40, which includes 215 = 32,768 possible response patterns. Increasing length by only five items (to 20) yields 220 = 1,048,576 patterns. Given that tests like the CPT and GNG comprise many more stimuli (at least 30 more), the trees would become too large if using that strategy.
Because effect sizes were averaged across simulations, these intervals were found using the standard deviation of estimates, not standard error.
Assuming a standard deviation of 1.0 (as here, because scores are in z-metric), standard error of measurement relates to reliability (alpha) as α = 1 – SEM2.
References
- Ader DN (2007). Developing the patient-reported outcomes measurement information system (PROMIS). Medical care, 45(5), S1–S2. [DOI] [PMC free article] [PubMed] [Google Scholar]
- Basner M, Mollicone D, & Dinges DF (2011). Validity and sensitivity of a brief psychomotor vigilance test (PVT-B) to total and partial sleep deprivation. Acta astronautica, 69(11-12), 949–959. [DOI] [PMC free article] [PubMed] [Google Scholar]
- Basner M, Savitt A, Moore TM, Port AM, McGuire S, Ecker AJ, Nasrini J, Mollicone DJ, Mott CM, McCann T, Dinges DF, & Gur RC (2015). Development and Validation of the Cognition Test Battery for Spaceflight. Aerospace medicine and human performance, 86(11), 942–952. [DOI] [PMC free article] [PubMed] [Google Scholar]
- Bezdicek O, Červenková M, Moore TM, Stepankova Georgi H, Sulc Z, Wolk DA, Weintraub DA, Moberg PJ, Jech R, Kopecek M, & Roalf DR (2020). Determining a short form Montreal cognitive assessment (s-MoCA) Czech version: Validity in mild cognitive impairment parkinson’s disease and cross-cultural comparison. Assessment, 10.1177/1073191118778896 [DOI] [PMC free article] [PubMed] [Google Scholar]
- Binet A, & Simon Th. A. (1905). Methode nouvelle pour le diagnostic du niveau intellectuel des anormaux. L’Annee Psychologique, 11, 191–244. [Google Scholar]
- Birmaher B, Ehmann M, Axelson DA, Goldstein BI, Monk K, Kalas C, … & Brent DA (2009). Schedule for affective disorders and schizophrenia for school-age children (K-SADSPL) for the assessment of preschool children–a preliminary psychometric study. Journal of psychiatric research, 43(7), 680–686. [DOI] [PMC free article] [PubMed] [Google Scholar]
- Burke E (2009). Preserving the integrity of online testing. Industrial and Organizational Psychology, 2(1), 35–38. [Google Scholar]
- Burke MJ, & Normand J (1987). Computerized psychological testing: Overview and critique. Professional Psychology: research and practice, 18(1), 42. [Google Scholar]
- Calkins ME, Merikangas KR, Moore TM, Burstein M, Behr MA, Satterthwaite TD, … & Gur RE (2015). The Philadelphia Neurodevelopmental Cohort: constructing a deep phenotyping collaborative. Journal of Child Psychology and Psychiatry, 56(12), 1356–1369. [DOI] [PMC free article] [PubMed] [Google Scholar]
- Calkins ME, Moore TM, Merikangas KR, Burstein M, Satterthwaite TD, Bilker WB, … & Gur RE (2014). The psychosis spectrum in a young US community sample: findings from the Philadelphia Neurodevelopmental Cohort. World Psychiatry, 13(3), 296–305. [DOI] [PMC free article] [PubMed] [Google Scholar]
- Carter CS, Barch DM, Gur R, Gur R, Pinkham A, & Ochsner K (2009). CNTRICS final task selection: social cognitive and affective neuroscience–based measures. Schizophrenia bulletin, 35(1), 153–162. [DOI] [PMC free article] [PubMed] [Google Scholar]
- Cella D, Yount S, Rothrock N, Gershon R, Cook K, Reeve B, … & Rose M (2007). The Patient-Reported Outcomes Measurement Information System (PROMIS): progress of an NIH Roadmap cooperative group during its first two years. Medical care, 45(5 Suppl 1), S3. [DOI] [PMC free article] [PubMed] [Google Scholar]
- Cerin E, Saelens BE, Sallis JF, & Frank LD (2006). Neighborhood Environment Walkability Scale: validity and development of a short form. Medicine and science in sports and exercise, 38(9), 1682. [DOI] [PubMed] [Google Scholar]
- Drasgow F, & Mattern K (2006). New tests and new items: Opportunities and issues. In Bartram D & Hambleton R (Eds.), Computer-based testing and the Internet: Issues and advances (pp. 59–75). John Wiley & Sons. [Google Scholar]
- Embretson SE, & Reise SP (2000). Item response theory for psychologists. Mahwah: Lawrence Erlbaum. [Google Scholar]
- Gallagher A, Bennett RA, Cahalan C, & Rock DA (2002). Validity and fairness in technology-baseed assessment: detecting construct-irrelevant variance in an open-ended, computereized mathematics task. Educational Assessment, 8(1), 27–41. [Google Scholar]
- Gibbons RD, & deGruy FV (2019). Without wasting a word: Extreme improvements in efficiency and accuracy using computerized adaptive testing for mental health disorders (CAT-MH). Current psychiatry reports, 21(8), 1–9. [DOI] [PubMed] [Google Scholar]
- Gibbons RD, Weiss DJ, Frank E, & Kupfer D (2016). Computerized adaptive diagnosis and testing of mental health disorders. Annual review of clinical psychology, 12, 83–104. [DOI] [PubMed] [Google Scholar]
- Gibbons RD, Weiss DJ, Kupfer DJ, Frank E, Fagiolini A, Grochocinski VJ, … & Immekus JC (2008). Using computerized adaptive testing to reduce the burden of mental health assessment. Psychiatric services, 59(4), 361–368. [DOI] [PMC free article] [PubMed] [Google Scholar]
- Glahn DC, Cannon TD, Gur RE, Ragland JD, & Gur RC (2000). Working memory constrains abstraction in schizophrenia. Biological psychiatry, 47(1), 34–42. [DOI] [PubMed] [Google Scholar]
- Glahn DC, Gur RC, Ragland JD, Censits DM, & Gur RE (1997). Reliability, performance characteristics, construct validity, and an initial clinical application of a visual object learning test (VOLT). Neuropsychology, 11(4), 602. [DOI] [PubMed] [Google Scholar]
- Green BF, Bock RD, Humphreys LG, Linn RL, & Reckase MD (1984). Technical guidelines for assessing computerized adaptive tests. Journal of Educational measurement, 21(4), 347–360. [Google Scholar]
- Gur RC, Gur RE, Obrist WD, Hungerbuhler JP, Younkin D, Rosen AD, … & Reivich M (1982). Sex and handedness differences in cerebral blood flow during rest and cognitive activity. Science, 217(4560), 659–661. [DOI] [PubMed] [Google Scholar]
- Gur RC, Ragland JD, Moberg PJ, Turner TH, Bilker WB, Kohler C, … & Gur RE (2001). Computerized neurocognitive scanning:: I. Methodology and validation in healthy people. Neuropsychopharmacology, 25(5), 766–776. [DOI] [PubMed] [Google Scholar]
- Gur RC, Ragland JD, Mozley LH, Mozley PD, Smith R, Alavi A, … & Gur RE (1997). Lateralized changes in regional cerebral blood flow during performance of verbal and facial recognition tasks: Correlations with performance and “effort”. Brain and cognition, 33(3), 388–414. [DOI] [PubMed] [Google Scholar]
- Gur RC, Richard J, Calkins ME, Chiavacci R, Hansen JA, Bilker WB, … & Gur RE (2012). Age group and sex differences in performance on a computerized neurocognitive battery in children age 8–21. Neuropsychology, 26(2), 251. [DOI] [PMC free article] [PubMed] [Google Scholar]
- Gur RC, Richard J, Hughett P, Calkins ME, Macy L, Bilker WB, … & Gur RE (2010). A cognitive neuroscience-based computerized battery for efficient measurement of individual differences: standardization and initial construct validation. Journal of neuroscience methods, 187(2), 254–262. [DOI] [PMC free article] [PubMed] [Google Scholar]
- Hanson BA, & Beguin AA (2002). Obtaining a common scale for item response theoryitem parameters using separate versus concurrent estimation in the common-item equating design. Applied Psychological Measurement, 26, 3–24. [Google Scholar]
- Jacobs J (1887). Experiments on “prehension.” Mind, 12, 75–79. [Google Scholar]
- Karabatsos G (2003). Comparing the aberrant response detection performance of thirty-six person-fit statistics. Applied Measurement in Education, 16(4), 277–298. [Google Scholar]
- Kessels RP (2019). Improving precision in neuropsychological assessment: Bridging the gap between classic paper-and-pencil tests and paradigms from cognitive neuroscience. The Clinical Neuropsychologist, 33(2), 357–368. [DOI] [PubMed] [Google Scholar]
- Kim S-H, & Cohen AS (2002). A comparison of linking and concurrent calibration underitem response theory. Applied Psychological Measurement, 22, 131–143. [Google Scholar]
- Knowles EE, Weiser M, David AS, Dickinson D, Glahn D, Gold J, … & Reichenberg A (2012). Dedifferentiation and substitute strategy: deconstructing the processing-speed impairment in schizophrenia. Schizophrenia research, 142(1-3), 129–136. [DOI] [PMC free article] [PubMed] [Google Scholar]
- Kobayashi H, Nemoto T, Koshikawa H, Osono Y, Yamazawa R, Murakami M, … & Mizuno M (2008). A self-reported instrument for prodromal symptoms of psychosis: testing the clinical validity of the PRIME Screen—Revised (PS-R) in a Japanese population. Schizophrenia research, 106(2-3), 356–362. [DOI] [PubMed] [Google Scholar]
- Kohler CG, Richard JA, Brensinger CM, Borgmann-Winter KE, Conroy CG, Moberg PJ, … & Calkins ME (2014). Facial emotion perception differs in young persons at genetic and clinical high-risk for psychosis. Psychiatry research, 216(2), 206–212. [DOI] [PubMed] [Google Scholar]
- Krueger RF (1999). The structure of common mental disorders. Archives of general psychiatry, 56(10), 921–926. [DOI] [PubMed] [Google Scholar]
- Krueger RF, Derringer J, Markon KE, Watson D, & Skodol AV (2013). The Personality Inventory for DSM–5-Brief Form (PID–5-BF)–Child. Retrieved from https://www.psychiatry.org/File%20Library/Psychiatrists/Practice/DSM/APA_DSM5_The-Personality-Inventory-For-DSM-5-Brief-Form-Child-Age-11-to-17.pdf
- Kruyen PM, Emons WH, & Sijtsma K (2013). On the shortcomings of shortened tests: A literature review. International Journal of Testing, 13(3), 223–248. [Google Scholar]
- Kurtz MM, Ragland JD, Bilker W, Gur RC, & Gur RE (2001). Comparison of the continuous performance test with and without working memory demands in healthy controls and patients with schizophrenia. Schizophrenia research, 48(2-3), 307–316. [DOI] [PubMed] [Google Scholar]
- Lawson GM, Moore TM, Okamura KH, Becker-Haimes EM, & Beidas RS (2020). Knowledge of evidence-based services questionnaire: Development and validation of a short form. Administration and Policy in Mental Health and Mental Health Services Research, 47, 581–596. 10.1007/sl0488-020-01020-7 [DOI] [PMC free article] [PubMed] [Google Scholar]
- Lezak MD, Howieson DB, Loring DW, & Fischer JS (2004). Neuropsychological assessment. Oxford, England: Oxford LTP. [Google Scholar]
- Linda QY, Lee S, Katchmar N, Satterthwaite TD, Kable JW, & Wolf DH (2017). Steeper discounting of delayed rewards in schizophrenia but not first-degree relatives. Psychiatry research, 252, 303–309. [DOI] [PMC free article] [PubMed] [Google Scholar]
- Lord FM (1952). A theory of test scores. Psychometric Monograph, No. 7. [Google Scholar]
- Lord FM (1970). Some test theory for tailored testing. In Holtzman WH (Ed.), Computer assisted instruction, testing, and guidance (pp. 139–183) New York: Harper and Row. [Google Scholar]
- Lynn SK, & Barrett LF (2014). “Utilizing” signal detection theory. Psychological science, 25(9), 1663–1673. [DOI] [PMC free article] [PubMed] [Google Scholar]
- Marek S, Tervo-Clemmens B, Calabro FJ, Montez DF, Kay BP, Hatoum AS, … & Dosenbach NU (2022). Reproducible brain-wide association studies require thousands of individuals. Nature, 1–7. [DOI] [PMC free article] [PubMed] [Google Scholar]
- Mead AD, & Drasgow F (1993). Equivalence of computerized and paper-and-pencil cognitive ability tests: A meta-analysis. Psychological bulletin, 114(3), 449. [Google Scholar]
- Meijer RR, & Nering ML (1999). Computerized adaptive testing: Overview and introduction. Applied psychological measurement, 23(3), 187–194. [Google Scholar]
- Meijer RR, & Sijtsma K (2001). Methodology review: Evaluating person fit. Applied Psychological Measurement, 25(2), 107–135. [Google Scholar]
- Merikangas KR, Avenevoli S, Costello EJ, Koretz D, & Kessler RC (2009). National comorbidity survey replication adolescent supplement (NCS-A): I. Background and measures. Journal of the American Academy of Child & Adolescent Psychiatry, 48(4), 367–379. [DOI] [PMC free article] [PubMed] [Google Scholar]
- Miller T, Cicchetti D, Mcglashan T, Woods S. Brief self-report screen to detect the schizophrenia prodrome. In: 12th Biennial Winter Workshop on Schizophrenia: 2004, p. 35. [Google Scholar]
- Mills CN, & Stocking ML (1996). Practical issues in large-scale computerized adaptive testing. Applied measurement in education, 9(4), 287–304. [Google Scholar]
- Moore TM, Butler ER, Cobb Scott J, Port AM, Ruparel K, Njokweni LJ, … & Gur RC (2021). When CAT is not an option: complementary methods of test abbreviation for neurocognitive batteries. Cognitive Neuropsychiatry, 26(1), 35–54. [DOI] [PMC free article] [PubMed] [Google Scholar]
- Moore TM, Calkins ME, Satterthwaite TD, Roalf DR, Rosen AF, Gur RC, & Gur RE (2019a). Development of a computerized adaptive screening tool for overall psychopathology (“p”). Journal of psychiatric research, 116, 26–33. [DOI] [PMC free article] [PubMed] [Google Scholar]
- Moore TM, Gur RC, Thomas ML, Brown GG, Nock MK, Savitt AP, … & Army STARRS Collaborators*. (2019b). Development, administration, and structural validity of a brief, computerized neurocognitive battery: Results from the Army Study to Assess Risk and Resilience in Servicemembers. Assessment, 26(1), 125–143. [DOI] [PMC free article] [PubMed] [Google Scholar]
- Moore TM, Reise SP, Gur RE, Hakonarson H, & Gur RC (2015). Psychometric properties of the Penn Computerized Neurocognitive Battery. Neuropsychology, 29(2), 235. [DOI] [PMC free article] [PubMed] [Google Scholar]
- Moore TM, Scott JC, Reise SP, Port AM, Jackson CT, Ruparel K, … & Gur RC (2015). Development of an abbreviated form of the Penn Line Orientation Test using large samples and computerized adaptive test simulation. Psychological assessment, 27(3), 955. [DOI] [PMC free article] [PubMed] [Google Scholar]
- Moore TM, White LK, Barzilay R, Calkins ME, Jones JD, Young JF, … & Gur RE (2020). Development of a scale battery for rapid assessment of risk and resilience. Psychiatry research, 288, 112996. [DOI] [PMC free article] [PubMed] [Google Scholar]
- Muraki E, Hombo CM, & Lee YW (2000). Equating and linking of performance assessments. Applied Psychological Measurement, 24(4), 325–337. [Google Scholar]
- Nenkov GY, Morrin M, Schwartz B, Ward A, & Hulland J (2008). A short form of the Maximization Scale: Factor structure, reliability and validity studies. Judgment and Decision making, 3(5), 371–388. [Google Scholar]
- Prettyman GE, Kable JW, Didier P, Shankar S, Satterthwaite TD, Davatzikos C, Bilker WB, Elliott MA, Ruparel K, & Wolf DH (2021). Relationship of ventral striatum activation during effort discounting to clinical amotivation severity in schizophrenia. NPJ schizophrenia, 7(1), 48. [DOI] [PMC free article] [PubMed] [Google Scholar]
- Ragland JD, Turetsky BI, Gur RC, Gunning-Dixon F, Turner T, Schroeder L, … & Gur RE (2002). Working memory for complex figures: an fMRI comparison of letter and fractal n-back tasks. Neuropsychology, 16(3), 370. [PMC free article] [PubMed] [Google Scholar]
- Reckase MD (2009). Multidimensional item response theory. New York: Springer. [Google Scholar]
- Reeve BB, Hays RD, Bjorner JB, Cook KF, Crane PK, Teresi JA, … & Celia D (2007). Psychometric evaluation and calibration of health-related quality of life item banks: plans for the Patient-Reported Outcomes Measurement Information System (PROMIS). Medical care, S22–S31. [DOI] [PubMed] [Google Scholar]
- Reise SP (1990). A comparison of item-and person-fit methods of assessing model-data fit in IRT. Applied Psychological Measurement, 14(2), 127–137. [Google Scholar]
- Reise SP (2012). The Rediscovery of Bifactor Measurement Models. Multivariate behavioral research 47 (5), 667–696. [DOI] [PMC free article] [PubMed] [Google Scholar]
- Reise SP (2000). Using multilevel logistic regression to evaluate person-fit in IRT models. Multivariate Behavioral Research, 35(4), 543–568. [DOI] [PubMed] [Google Scholar]
- Reise SP, Cook KF, Moore TM (2015). Evaluating the impact of multidimensionality on unidimensional Item Response Theory model parameters, in: Reise SP, Revicki D (Eds.), Handbook of Item Response Theory Modeling. Routledge, New York, NY. [Google Scholar]
- Reise SP, Moore TM, Haviland MG (2010). Bifactor models and rotations: exploring the extent to which multidimensional data yield univocal scale scores. J Pers assess. 92(6), 544–559. [DOI] [PMC free article] [PubMed] [Google Scholar]
- Reise SP, Moore T, Maydeu-Olivares A (2011). Target rotations and assessing the impact of model violations on the parameters of unidimensional item response theory models. Educational and Psychological Measurement 71 (4), 684–711. [Google Scholar]
- Roalf DR, Moore TM, Wolk DA, Arnold SE, Mechanic-Hamilton D, Rick J, Kabadi S, Ruparel K, Chen-Plotkin AS, Chahine LM, Dahodwala NA, Duda JE, Weintraub DA, & Moberg PJ (2016). Defining and validating a short form Montreal cognitive assessment (s-MoCA) for use in neurodegenerative disease. Journal of Neurology, Neurosurgery & Psychiatry, 87(12), 1303–1310. 10.1136/jnnp-2015-312723 [DOI] [PMC free article] [PubMed] [Google Scholar]
- Saine ME, Moore TM, Szymczak JE, Bamford LP, Barg FK, Mitra N, Schnittker J, Holmes JH, Lo Re V, & Tu W-J (2020). Validation of a modified Berger HIV stigma scale for use among patients with hepatitis C virus (HCV) infection. Plos one, 15(2), e0228471. 10.1371/journalpone.0228471 [DOI] [PMC free article] [PubMed] [Google Scholar]
- Samejima F (1969). Estimation of latent ability using a response pattern of graded scores. Psychometrika monograph supplement. [Google Scholar]
- Scott JC, Moore TM, Roalf DR, Satterthwaite TD, Wolf DH, Port AM, Butler ER, Ruparel K, Nievergelt CM, Risbrough VB, Baker DG, Gur RE, Gur RC (2022). Development and Application of Novel Performance Validity Metrics for Computerized Neurocognitive Batteries. Journal of the International Neuropsychological Society, in press. [DOI] [PMC free article] [PubMed] [Google Scholar]
- Scott JC, Van Pelt AE, Port AM, Njokweni L, Gur RC, Moore TM, … & Lowenthal ED (2020). Development of a computerised neurocognitive battery for children and adolescents with HIV in Botswana: study design and protocol for the Ntemoga study. BMJ open, 10(8), e041099. [DOI] [PMC free article] [PubMed] [Google Scholar]
- Shanmugan S, Wolf DH, Calkins ME, Moore TM, Ruparel K, Hopson RD, … & Satterthwaite TD (2016). Common and dissociable mechanisms of executive system dysfunction across psychiatric disorders in youth. American journal of psychiatry, 173(5), 517–526. [DOI] [PMC free article] [PubMed] [Google Scholar]
- Smith GT, McCarthy DM, & Anderson KG (2000). On the sins of short-form development. Psychological assessment, 12(1), 102. [DOI] [PubMed] [Google Scholar]
- Smits N, Paap M, & Böhnke JR (2018). Some recommendations for developing multidimensional computerized adaptive tests for patient-reported outcomes. Quality of Life Research, 27(4), 1055–1063. [DOI] [PMC free article] [PubMed] [Google Scholar]
- Stroop JR (1935). Studies of interference in serial verbal reactions. Journal of Experimental Psychology, 18(6), 643–662. [Google Scholar]
- Suppes P (1966). The uses of computers in education. Scientific American, 215, 206–221. [Google Scholar]
- Swets JA, Tanner WP Jr., & Birdsall TG (1961). Decision processes in perception. Psychological Review, 68(5), 301–340. [PubMed] [Google Scholar]
- Thissen D, Reeve BB, Bjorner JB, & Chang CH (2007). Methodological issues for building item banks and computerized adaptive scales. Quality of Life Research, 16(1), 109–119. [DOI] [PubMed] [Google Scholar]
- Thomas ML, Brown GG, Gur RC, Moore TM, Patt VM, Risbrough VB, & Baker DG (2018). A signal detection-item response theory model for evaluating neuropsychological measures. Journal of clinical and experimental neuropsychology, 40(8), 745–760. [DOI] [PMC free article] [PubMed] [Google Scholar]
- Thomas ML, Brown GG, Patt VM, & Duffy JR (2021). Latent variable modeling and adaptive testing for experimental cognitive psychopathology research. Educational and Psychological Measurement, 81(1), 155–181. [DOI] [PMC free article] [PubMed] [Google Scholar]
- Wainer H, Bradlow ET, & Du Z (2000). Testlet response theory: An analog for the 3PL model useful in testlet-based adaptive testing. In van der Linden WJ & Glas GA (Eds.), Computerized adaptive testing: Theory and practice (pp. 245–269). New York, NY: Springer [Google Scholar]
- Weintraub S, Dikmen SS, Heaton RK, Tulsky DS, Zelazo PD, Bauer PJ, … & Gershon RC (2013). Cognition assessment using the NIH Toolbox. Neurology, 80(11 Supplement 3), S54–S64. [DOI] [PMC free article] [PubMed] [Google Scholar]
- Weiss DJ (1982). Improving measurement quality and efficiency with adaptive testing. Applied psychological measurement, 6(4), 473–492. [Google Scholar]
- Weiss DJ (2011). Better data from better measurements using computerized adaptive testing. Journal of Methods and Measurement in the Social Sciences, 2(1), 1–27. [Google Scholar]
- Westbrook A, Kester D, & Braver TS (2013). What is the subjective cost of cognitive effort? Load, trait, and aging effects revealed by economic preference. PloS one, 8(7), e68210. [DOI] [PMC free article] [PubMed] [Google Scholar]
- Woods S, Walsh B, Cannon T (2020) Mini-SIPS 1.0, an abbreviated clinical version of the Structured Interview for Psychosis-risk Syndromes. [Google Scholar]
- Yan D, Lewis C, & Stocking M (2004). Adaptive testing with regression trees in the presence of multidimensionality. Journal of Educational and Behavioral Statistics, 29(3), 293–316. [Google Scholar]
- Yan D, A. A. Von Davier, & C. Lewis (Eds.). (2016). Computerized multistage testing: Theory and applications. CRC Press. [Google Scholar]
- Yu QL, Lee S, Katchmar N, Satterthwaite TD, Kable JW, & Wolf DH (2017). Steeper discounting of delayed rewards in schizophrenia but not first-degree relatives. Psychiatry research, 252, 303–309. [DOI] [PMC free article] [PubMed] [Google Scholar]
- Yudien MA, Moore TM, Port AM, Ruparel K, Gur RE, & Gur RC (2019). Development and public release of the Penn Reading Assessment Computerized Adaptive Test (PRA-CAT) for premorbid IQ. Psychological assessment, 31(9), 1168–1173. [DOI] [PMC free article] [PubMed] [Google Scholar]
Associated Data
This section collects any data citations, data availability statements, or supplementary materials included in this article.