Abstract
Background
High knee abduction moment (KAM) landing mechanics, measured in the biomechanics laboratory, can successfully identify female athletes at increased risk for anterior cruciate ligament (ACL) injury.
Methods
The authors validated a simpler, clinic-based ACL injury prediction algorithm to identify female athletes with high KAM measures. The validated ACL injury prediction algorithm employs the clinically obtainable measures of knee valgus motion, knee flexion range of motion, body mass, tibia length and quadriceps-to-hamstrings ratio. It predicts high KAMs in female athletes with high sensitivity (77%) and specificity (71%).
Conclusion
This report outlines the techniques for this ACL injury prediction algorithm using clinic-based measurements and computer analyses that require only freely available public domain software.
INTRODUCTION
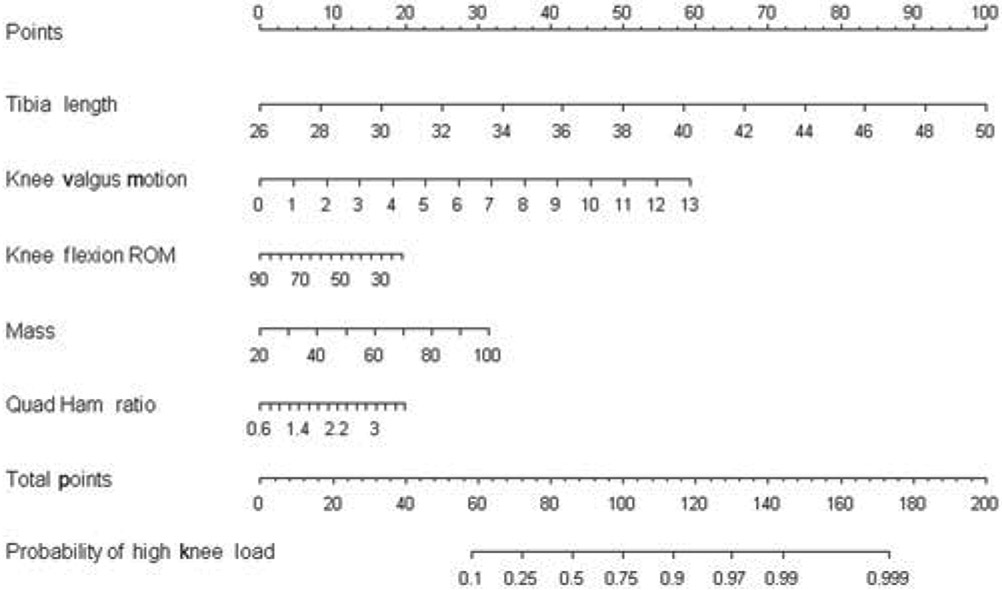
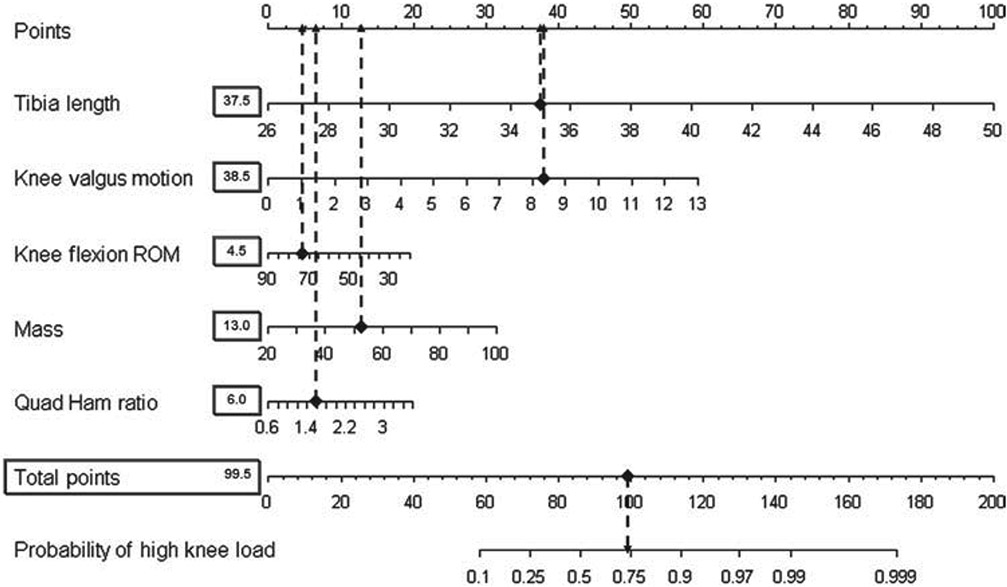
Prospective measures of high knee abduction moment (KAM) during landing predict anterior cruciate ligament (ACL) injury risk in young female athletes.1 Using data from nearly 700 young women, we developed a clinic-based assessment algorithm to identify those with increased KAM (figure 1).2-4 These women would be ideal candidates for targeted injury prevention training.
Figure 1.
Clinician friendly nomogram that was developed from the regression analysis and can be used to predict high knee abduction moment outcome based on tibia length, knee valgus motion, knee flexion range of motion, body mass and quadriceps-to-hamstrings ratio. Reprinted with permission from Myer GD et al.4
The purpose of this report is to demonstrate techniques to accurately capture and analyse measures of body mass, tibia length, quadriceps-to-hamstrings ratio (QuadHam), knee valgus motion and knee flexion range of motion (ROM) for use of the ACL injury prediction algorithm using clinic-based measurements and computer analyses with freely available public domain software.
METHODS
Clinic-based anthropometrics and strength
Tibia length and body mass
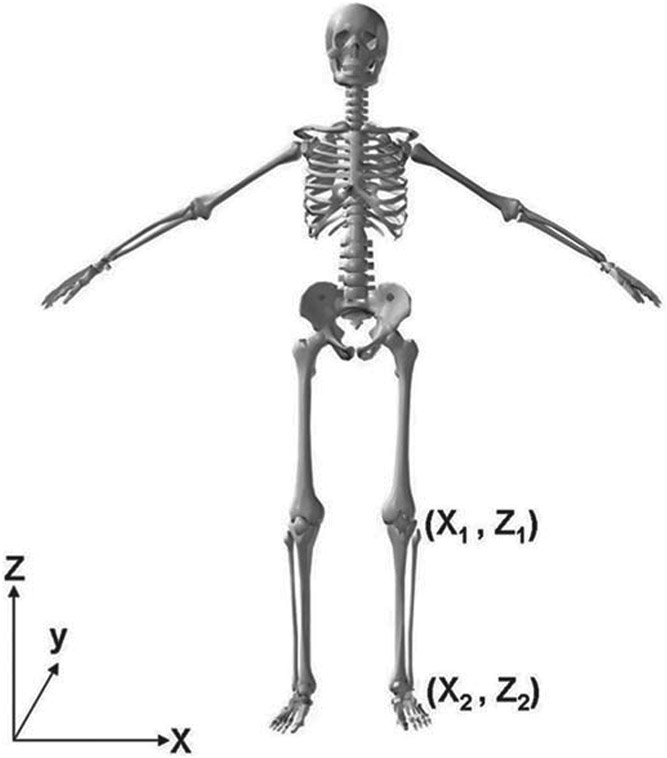
Clinic-based tibia length was measured with the subject standing with knees extended in anatomical position. A standard measuring tape was used to measure the distance between the lateral knee joint line and the lateral malleous (figure 2). Body mass was measured on a calibrated physician scale.
Figure 2.
Tibia length is measured as the distance between knee joint centre and ankle joint centre (Z2–Z1).
QuadHam ratio
Isokinetic knee extension/flexion (concentric/concentric muscle action) strength was measured on a standard isokinetic testing device for each leg at 300°/s.5 The quadriceps-to-hamstrings (QuadHam) ratio was calculated as the ratio of quadriceps to hamstrings peak isokinetic torque. Some clinical settings may not have an isokinetic testing device readily available. In this case, a surrogate measure of the QuadHam ratio can be employed that was defined using a linear regression analysis to predict QuadHam ratio based on the athlete’s body mass. The surrogate QuadHam ratio measure can be obtained by multiplying the female athlete’s mass by 0.01 and adding the resultant value to 1.10. If even greater simplicity is desired, the mean value of 1.53 can be substituted into the prediction algorithm for the QuadHam ratio.4 Although surrogate calculations provide a range that can be used if isokinetic measurement is not obtainable, the prediction model is best optimised with QuadHam ratios which are achieved by direct measurement.
Clinic-based landing biomechanics
Camera set-up
Two-dimensional (clinic-based) frontal and sagittal plane knee kinematic data were captured with standard video cameras. Cameras should be levelled and positioned at a height of 60–80 cm, perpendicular to each other in the frontal and sagittal planes. To reduce measurement perspective error, it is optimal to move the camera as far away from the capture area as possible, so as to allow for a fully zoomed view to be focused on the desired capture location.6 Once the camcorders were positioned, the view was focused with the manual settings (autofocus settings were not used).
Test instructions
The box (31 cm high) used for the drop vertical jump (DVJ) should be centred on the frontal camera view and approximately 30 cm off centre of sagittal plane view away from the camera in the frontal plane position. Prior to the DVJ test performance, it is recommended that a standardised target be placed overhead, equal to the subject’s maximal touch height during a countermovement vertical jump. The subject should be instructed to ‘stand on top of a box with their feet positioned 35 cm apart. Once prepared, the subject should drop directly down off the box and immediately perform a maximum vertical jump, raising both arms towards the overhead target.’ If an overhead target is not used, the test subject should be instructed to ‘land and jump as high as possible as if reaching for a basketball rebound.’7 Subjects should be allowed one to three practice trials to ensure they are able to demonstrate adequate understanding and ability to perform the instructed test manoeuvre.
Image capture
Landing sequence images can be captured via the ‘print screen’ feature available on most personal computers, or they can be captured with freeware software such as VirtualDub software (copyright 1998–2009 Avery Lee). In addition, typical software programs (ie, VirtualDub) can deinterlace the video fields to effectively double the frames available per second from 30 to 60 Hz for NTSC systems (or 25–50 Hz for PAL systems). For simplicity, the four image files should be captured in the following suggested order: I1-frontal plane view with frame prior to initial contact, I2-frontal plane view of frame with knee in maximum medial (valgus) position, I3-sagittal plane view with frame prior to initial contact, I4-sagittal plane view of frame with knee in maximum flexion position and named in a standard structure for each subject (ie, SubjectX I1, SubjectX I2, SubjectX I3, SubjectX I4). Recommended software for kinematic coordinate data capture is suggested for use with ImageJ (Rasband W S, ImageJ, US National Institutes of Health, Bethesda, Maryland, USA, http://rsb.info.nih.gov/ij/, 1997–2009), software that is also available without surcharge.
Knee valgus motion
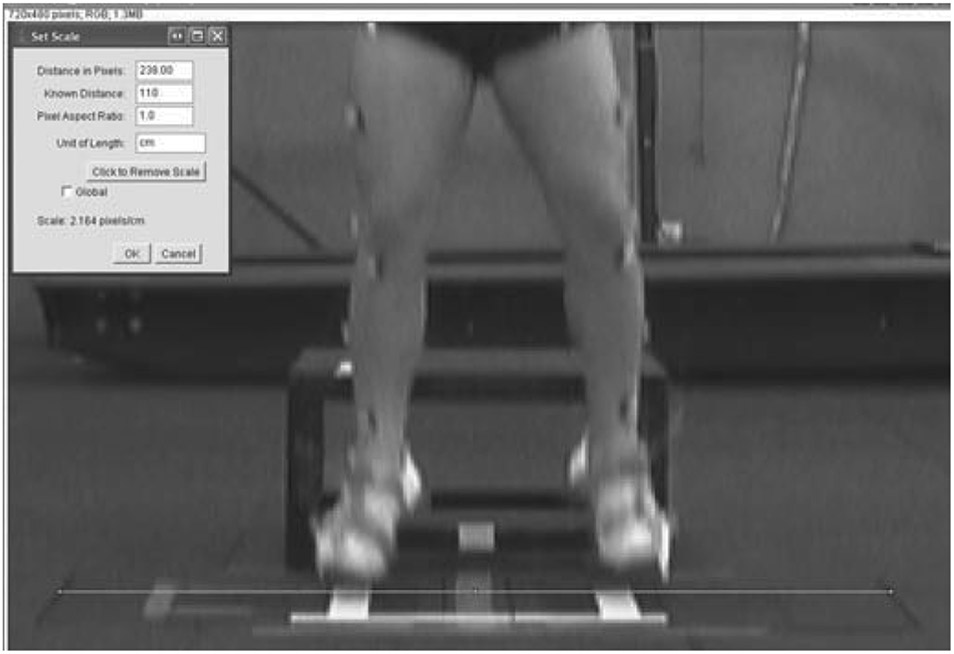
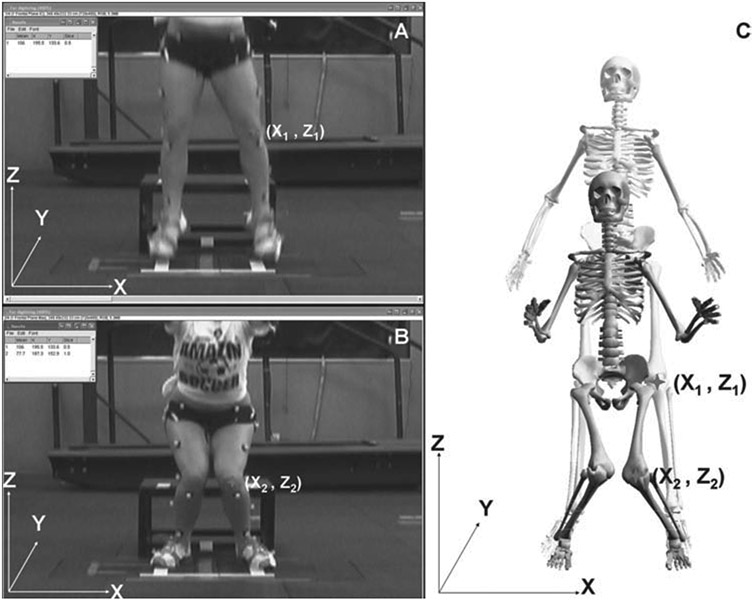
ImageJ software allows for easy importing of image sequences of files with a standard name structure (ie, SubjectX I1, SubjectX I2, SubjectX I3, SubjectX I4). Once the image sequence is imported, a video scaling factor (scaling factor=known distance (cm)/digitised distance (video units)) is established for the x-axis scale from a known distance (drawing a line equal to the length of the known distance and inputting the actual length such as force plate width measurement presented in figure 3). Subsequent coordinate data in the x-axis are represented in centimetres of motion based on the scaling factor for measurement of knee valgus motion (figure 4). The calibrated displacement measure between the two digitised knee coordinates (X2–X1) is representative of knee valgus motion during the DVJ.
Figure 3.
Example of the calibration process for measured distance in the x-axis using ImageJ software. In the presented example, the line tool is used to draw a line the width of the box. Then, by using the set scale procedure, the known distance of the box width is input. From this calibration step, all length measurements from this camera position will be calibrated for the subjects’ drop vertical jump trials.
Figure 4.
(A) Coordinate position of knee joint centre digitised in the frontal view measured at the frame prior to initial contact used as the knee valgus position X1. (B) Coordinate position of knee joint centre digitised in the frontal view measured at the frame with maximum medial position and utilised as the knee valgus position X2. (C) Calibrated displacement measure between the two digitised knee coordinates (X2–X1), representative of knee valgus motion during the drop vertical jump.
Knee flexion ROM
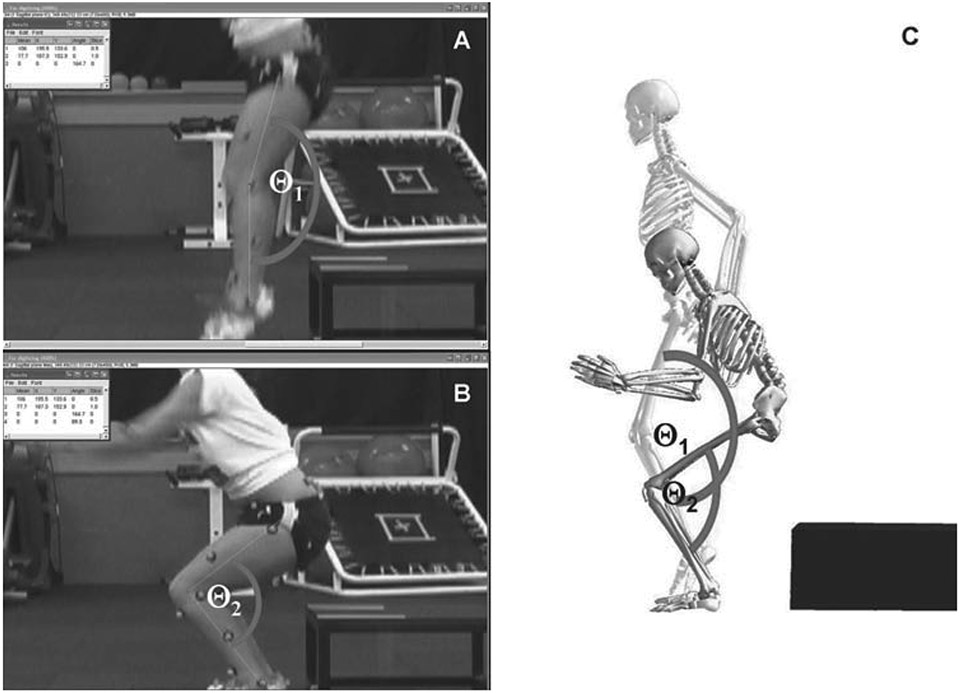
The sagittal plane video camcorder is used to capture knee flexion angles that are calculated from the video frame just prior to initial contact and the video frame at maximum knee flexion. Knee flexion ROM was calculated as the difference in knee flexion between the two positions (Θ1–Θ2; figure 5).
Figure 5.
(A) Knee flexion angle digitised at the frame prior to initial contact and recorded as the first measure of knee flexion range of motion (ROM) (Θ1). (B) Knee flexion angle, digitised at the frame with maximum knee flexion and recorded as the second measure of knee flexion ROM (Θ2). (C) Displacement of knee flexion, calculated as the differences in knee flexion angles at the frame prior to initial contact and maximum knee flexion (Θ1–Θ2) and representative of knee flexion ROM.
APPLICATION OF THE PREDICTION ALGORITHM
To use the prediction nomogram (figure 1), one should place a straight edge vertically so that it touches the designated variable on the axis for each predictor value, and record the value that each of the five predictors provides on the ‘points’ axis at the top of the diagram. All of the recorded ‘points’ measured using this method are then summed, and this value is located on the ‘total points’ line with a straight edge. A vertical line drawn down from the ‘total points line’ to the ‘probability line’ identifies the probability that the athlete will demonstrate a high KAM (>21.74 Nm of knee abduction) during the DVJ based on the utilised predictive variables.
Identification of high KAM
Figure 6 provides an example of predicted probability for high KAM status based on the representative subject’s clinic-based measurements and landing mechanics (tibia length 35 cm; knee valgus motion 8.2 cm; knee flexion ROM 75.4°; body mass 52.2 kg; QuadHam 1.55). Based on her demonstrated measurements, this subject would have a 74% (95.5 points) chance of demonstrating a high KAM during the DVJ. The actual KAM measurement for the presented DVJ that was quantified simultaneously with 3D motion analysis was 24.2 Nm of knee abduction load.
Figure 6.
Example of predicted probability for high knee abduction moment (KAM) status based on the representative subject’s (figures 4, 5) clinic-based measurements. Completed nomogram for the representative subject (tibia length: 35 cm; knee valgus motion: 8.2 cm; knee flexion range of motion: 75.4 body mass: 52.2 kg; QuadHam: 1.55). Based on her demonstrated measurements, this subject would have a 74% (95.5 points) chance of demonstrating a high KAM during the drop vertical jump (DVJ). The actual KAM measurement for the presented DVJ that was quantified simultaneously with 3D motion analysis was 24.2 Nm of knee abduction load.
Identification of low KAM
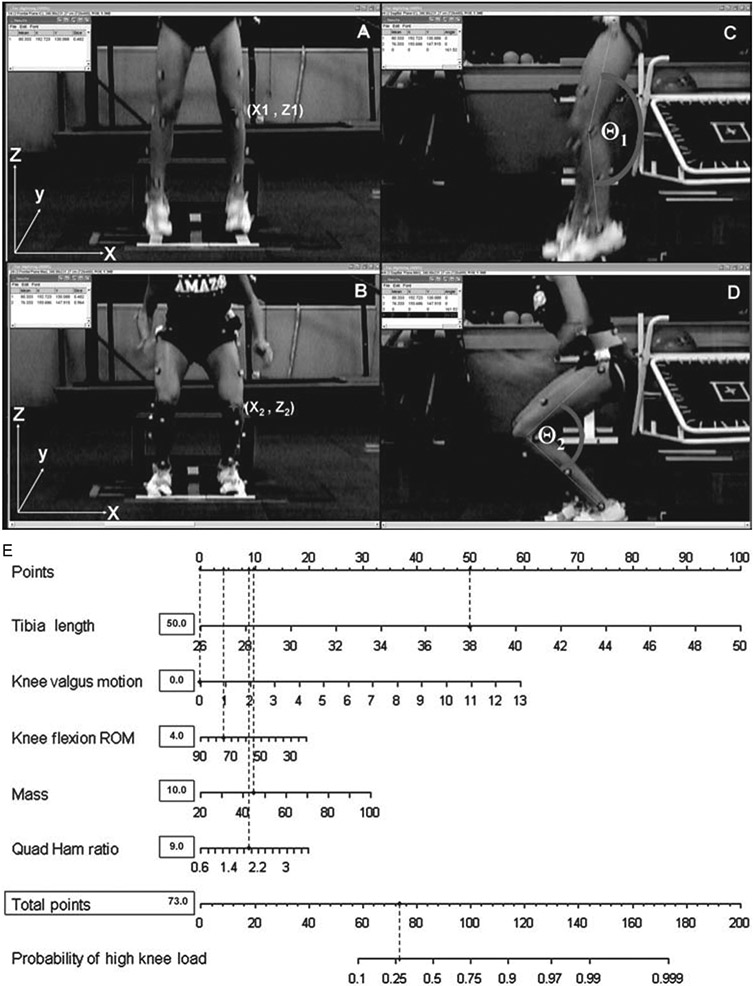
Figure 7 presents the optimal landing biomechanics during the DVJ in which the athlete demonstrated desirable knee flexion ROM without any knee valgus motion that ultimately limited her potential to demonstrate high KAM. Based on her recorded clinic-based measurement, the presented subject demonstrated a 25% chance for high KAM using the proposed prediction algorithm. Simultaneous 3D motion analysis confirmed the accuracy of the proposed algorithm, as the subject yielded an actual KAM measurement of 7.6 Nm.
Figure 7.
(A–B) Calibrated displacement measure between the two marked knee coordinates (X2–X1) representative of knee valgus motion during the drop vertical jump (DVJ). (C–D) Displacement of knee flexion calculated as the differences in knee flexion angles at the frame prior to initial contact and maximum knee flexion (Θ1–Θ2) and representative of knee flexion range of motion (ROM). (E) Completed nomogram for the representative subject (tibia length:38 cm; knee valgus motion: 0.0 cm; knee flexion ROM: 75.3°; mass: 44.9 kg; QuadHam: 1.89). Based on her demonstrated measurements, this subject would have a 25% (73 points) chance of demonstrating high knee abduction moment (KAM) during the DVJ. Her actual KAM measure for the presented DVJ that was quantified simultaneously with 3D motion analysis was 7.6 Nm of knee abduction load. (Note: when measured values exceed the range provided on an algorithm such as the 15 cm of knee valgus motion in the current example, use the maximum score for that variable.)
DISCUSSION
Special consideration for use of ACL injury prediction algorithm
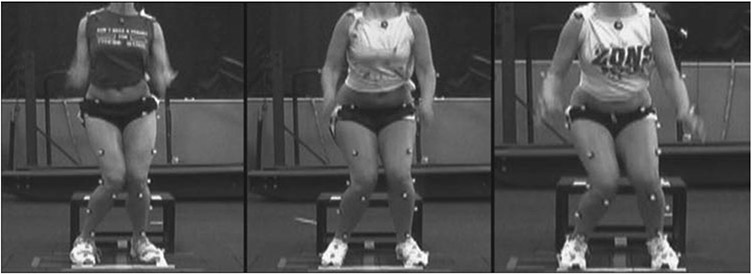
Clinicians who perform risk assessment should be cognisant that side-to-side imbalances in neuromuscular strength, flexibility and coordination can be important predictors of increased injury risk.1 8 9 However, the above examples of KAM (figure 6) prediction have utilised measures on the left limb. Specific to ACL injury risk prediction, leg-to-leg differences in KAM were observed in injured, but not uninjured females. Importantly, the side-to-side KAM difference was 6.4-fold greater in ACL-injured versus uninjured females. Female athletes tend to demonstrate side-to-side differences in visually evident maximum knee valgus angle during a box DVJ (figure 8).7
Figure 8.
Visually evident side-to-side differences in frontal plane landing mechanics.
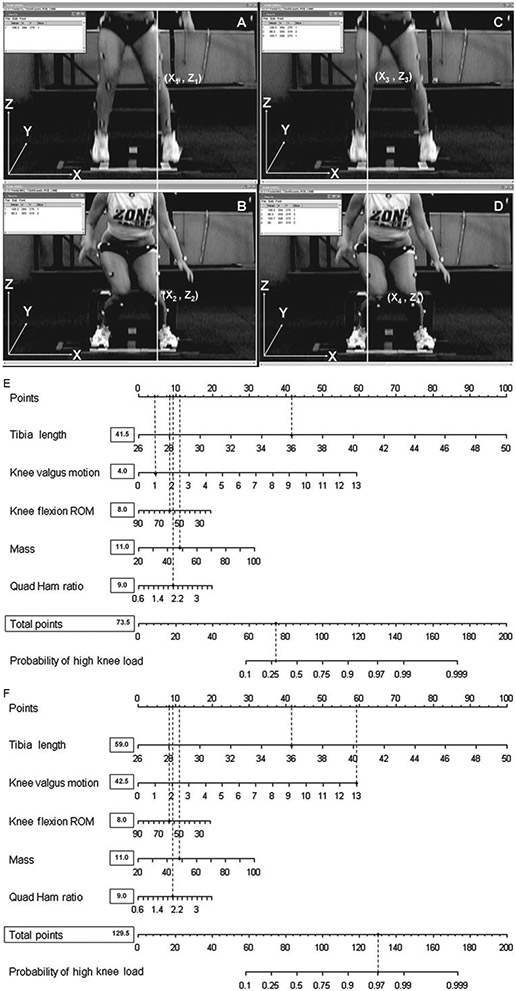
Figure 9 presents a representative subject with side-to-side differences in landing biomechanics which the ACL injury prediction algorithm also delineates with side-side differences in prediction of risk for high KAM. Based on her left leg (figure 9A,B) she would have a 28% (73.5 points; figure 9E) chance of demonstrating a high KAM during the DVJ. Her actual KAM measure for the presented DVJ that was quantified simultaneously with 3D motion analysis was 15.4 Nm of knee abduction load on her left leg. However, when using the measures from the right leg frontal plane motion (figure 9C,D; 15 cm) in the ACL injury-risk prediction algorithm, this subject would have a 97% (129.5 points; figure 9F) chance of demonstrating a high KAM during the DVJ. Her actual KAM measure for the presented DVJ that was quantified simultaneously with 3D motion analysis was 29.2 Nm of knee abduction load on her right leg. This important observation indicates that the ACL injury prediction algorithm is both sensitive and specific to high KAM, even between limbs in a single subject. Accordingly, clinicians should evaluate side-to-side differences in frontal plane mechanics, and the largest knee valgus motion measurements should be employed to maximise the utility of the proposed ACL injury prediction algorithm.1
Figure 9.
Example of a representative subject with side-to-side differences in landing biomechanics which the anterior cruciate ligament (ACL) injury prediction algorithm also delineates as differences in prediction of risk for high knee abduction moment (KAM). (A–B) Subject demonstrating 1 cm of knee valgus motion (X2–X1) on her left limb during the drop vertical jump (DVJ). (C–D) Subject demonstrating 15 cm of knee valgus motion (X2–X1) on her right limb during the same DVJ trial. (E) Completed nomogram for the representative subject (tibia length 36 cm; knee valgus motion 1.0 cm; knee flexion range of motion 60.5°; mass 49.0 kg; QuadHam 2.0). Based on her demonstrated measurements in her left leg, this subject would have a 28% (73.5 points) chance of demonstrating a high KAM during the DVJ. Her actual KAM measure for the presented DVJ that was quantified simultaneously with 3D motion analysis was 15.4 Nm of knee abduction load. (F) When using the measures from the right leg frontal plane motion (15 cm) in the ACL injury-risk prediction algorithm, the subject also shows side-to-side differences in prediction of high KAM. Based on her demonstrated measurements in her right leg, this subject would have a 97% (129.5 points) chance of demonstrating a high KAM during the DVJ. Her actual KAM measure for the presented DVJ that was quantified simultaneously with 3D motion analysis was 29.2 Nm of knee abduction load.
CONCLUSIONS
The current methodological report facilitates the next critical step to bridge the gap between laboratory identification of injury risk factors1 10 and clinical practices achieved in the field.3 4 The algorithm may be used as a training camp protocol in partnership with team clinicians. It could also be set up and run in the athletic training setting. This screen may help identify those at high risk of sustaining an ACL injury during competitive play. Implementation of the prediction algorithm may increase both the efficacy and efficiency of future interventions aimed at preventing non-contact ACL injury in female athletes. Future research is warranted to determine if the proposed algorithm improves the effectiveness of neuromuscular training methods (reduced KAM and ACL injury incidence) when targeted at women and girls who demonstrate high KAM landing mechanics. In addition, researchers should strive to simplify ACL injury risk-factor assessments while maintaining the high level of accuracy demonstrated by the presented methods to further improve the potential prophylactic effects of interventions applied to high-injury-risk populations.
What is already known on this topic.
Female athletes who demonstrate high knee abduction moments (KAM) during landing increase their risk of sustaining an anterior cruciate ligament (ACL) injury during competitive play.
Female athletes who demonstrate an increased KAM are more likely to benefit from neuromuscular training that will reduce their risk of ACL injury.
Screening for KAM requires a dedicated biomechanical laboratory and costly measurement tools and labour-intensive data-collection sessions. These factors limit the potential to perform athlete risk assessments on a large scale, precluding the opportunity to target high-injury-risk athletes with the appropriate intervention strategies.
What this study adds.
Clinically feasible measures of increased knee valgus motion, knee flexion range of motion, body mass, tibia length and quadriceps-to-hamstring ratio predict an increased propensity to demonstrate high KAM during landing in female athletes with high sensitivity and specificity.
The current report provides a systematic methodology to simplify and accurately identify female athletes who demonstrate high KAM landing mechanics that increase their risk of ACL injury.
The presented algorithm provides the next critical step to bridge the gap between laboratory identification of increased injury risk and clinical practices aimed to prevent the long-term sequelae that follows ACL injury.
Acknowledgements
The authors would like to thank Boone County School District, Kentucky, especially School Superintendent R Poe, for participation in this study. The authors would also like to thank M Blevins, E Massey and the athletes and coaches of Boone County public school district for their participation in this study. All authors are independent of any commercial funder, had full access to all of the data in the study and take responsibility for the integrity of the data and the accuracy of the data analysis.
Funding
The authors would like to acknowledge funding support from National Institutes of Health Grant R01-AR049735, R01-AR055563 and R01-AR056259. The Cincinnati Children’s Hospital Medical Center and Rocky Mountain University of Health Professions Institutional Review Boards approved this study.
Footnotes
Competing interests None.
Patient consent Obtained.
Ethics approval Ethics approval was provided by the Cincinnati Children’s Hosptial and Rocky Mountain University.
REFERENCES
- 1.Hewett TE, Myer GD, Ford KR, et al. Biomechanical measures of neuromuscular control and valgus loading of the knee predict anterior cruciate ligament injury risk in female athletes: a prospective study. Am J Sports Med 2005;33:492–501. [DOI] [PubMed] [Google Scholar]
- 2.Myer GD, Ford KR, Khoury J, et al. Biomechanics laboratory-based prediction algorithm to identify female athletes with high knee loads that increase risk of ACL injury. Br J Sports Med Published Online First: 17 June 2010. doi: 10.1136/bjsm.2009.069351 [DOI] [PMC free article] [PubMed] [Google Scholar]
- 3.Myer GD, Ford KR, Khoury J, et al. Development and validation of a clinic based prediction tool to identify high ACL injury risk female athletes. Am J Sports Med. Published Online First. doi: 10.1177/0363546510370933. [DOI] [Google Scholar]
- 4.Myer GD, Ford KR, Khoury J, et al. Clinical Correlates to laboratory based measures for use in ACL injury risk prediction algorithm. Clin Biomech (Bristol, Avon). 2010. May 27. [Epub ahead of print]. [DOI] [PMC free article] [PubMed] [Google Scholar]
- 5.Myer GD, Ford KR, Barber Foss KD, et al. The relationship of hamstrings and quadriceps strength to anterior cruciate ligament injury in female athletes. Clin J Sport Med 2009;19:3–8. [DOI] [PMC free article] [PubMed] [Google Scholar]
- 6.Paul JA, Douwes M. Two-dimensional photographic posture recording and description: a validity study. Appl Ergon 1993;24:83–90. [DOI] [PubMed] [Google Scholar]
- 7.Ford KR, Myer GD, Hewett TE. Valgus knee motion during landing in high school female and male basketball players. Med Sci Sports Exerc 2003;35:1745–50. [DOI] [PubMed] [Google Scholar]
- 8.Knapik JJ, Bauman CL, Jones BH, et al. Preseason strength and flexibility imbalances associated with athletic injuries in female collegiate athletes. Am J Sports Med 1991;19:76–81. [DOI] [PubMed] [Google Scholar]
- 9.Baumhauer JF, Alosa DM, Renström AF, et al. A prospective study of ankle injury risk factors. Am J Sports Med 1995;23:564–70. [DOI] [PubMed] [Google Scholar]
- 10.Padua DA, Marshall SW, Beutler AI, et al. Prospective Cohort Study of Biomechanical Risk Factors of ACL Injury: The JUMP-ACL Study. American Orthopaedic Society of Sports Medicine Annual Meeting. Keystone, Colorado, 2009:393–5. [Google Scholar]


