

SUMMARY
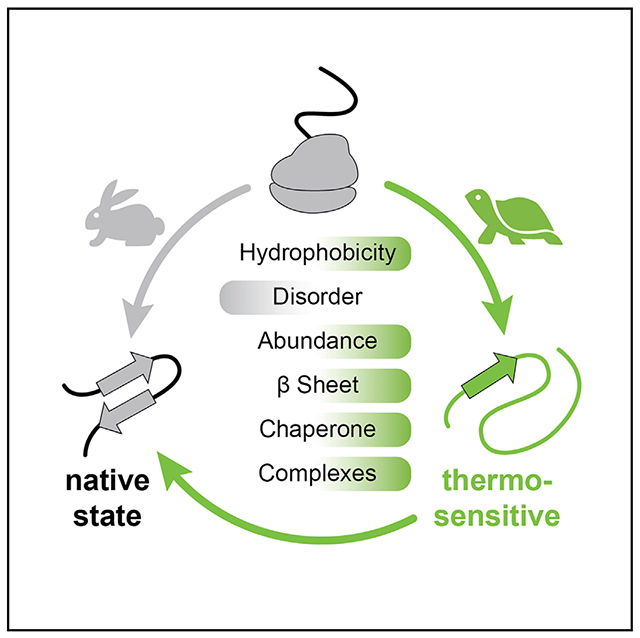
Accurate and efficient folding of nascent protein sequences into their native states requires support from the protein homeostasis network. Herein we probe which newly translated proteins are thermo-sensitive, making them susceptible to misfolding and aggregation under heat stress using pulse-SILAC mass spectrometry. We find a distinct group of proteins that is highly sensitive to this perturbation when newly synthesized but not once matured. These proteins are abundant and highly structured. Notably, they display a tendency to form β sheet secondary structures, have more complex folding topology, and are enriched for chaperone-binding motifs, suggesting a higher demand for chaperone-assisted folding. These polypeptides are also more often components of stable protein complexes in comparison with other proteins. Combining these findings suggests the existence of a specific subset of proteins in the cell that is particularly vulnerable to misfolding and aggregation following synthesis before reaching the native state.
Graphical abstract
In brief
Zhu et al. reveal that a subset of proteins is more thermo-sensitive when newly synthesized but not once matured. These proteins have features associated with more complex folding topology in comparison with other proteins, suggesting they remain susceptible to misfolding and aggregation following synthesis before reaching their native states.
INTRODUCTION
Cells have developed an intricate protein homeostasis network to maintain a functional proteome. Protein homeostasis is constantly challenged; externally by stresses and internally by unwanted mutations, errors during transcription, mRNA processing, and translation, as well as a decreased network capability through aging (Hipp et al., 2019; Morimoto and Cuervo, 2014). Frequently, these challenges culminate in the misfolding of proteins, which can lead to protein aggregation and deleterious effects within cells (Cooper et al., 2006; Olzscha et al., 2011; Park et al., 2013). Notably, protein aggregation is a hallmark of several neurodegenerative pathologies, including Alzheimer’s, Parkinson’s, and Huntington’s diseases.
Folding newly synthesized proteins in a crowded cellular space presents a challenge. Unfolded polypeptides can explore a large ensemble of conformations, while adopting multiple folding intermediates, to reach their native folds; all the while nonspecific interactions of their exposed linear sequence could interfere with this process (Bryngelson et al., 1995; Ellis and Minton, 2006; Gershenson et al., 2014; Hartl et al., 2011). To cope with this challenge, eukaryotic cells have developed multiple strategies. Markedly, co-translational folding plays a vital role, as its absence leads to protein misfolding (Chang et al., 2005) and is frequently aided by ribosome-binding chaperones such as nascent polypeptide-associated complex (NAC) and ribosome-associated complex (RAC) (Deuerling et al., 2019; Duttler et al., 2013; Wiedmann et al., 1994). Stretches of hydrophobic regions exposed during translation are protected by Hsp70/Ssb chaperones, which are recruited by RAC to prevent nonspecific interactions. Understanding of the chaperone network and how NAC, RAC, cytosolic Hsp70/Ssb1, and TRiC/CCT chaperonin assist protein folding co-translationally has been deepened by many recent studies (Döring et al., 2017; Shen et al., 2019; Shiber et al., 2018; Stein et al., 2019; Willmund et al., 2013).
These proteostasis mechanisms have evolved to ensure that each polypeptide reaches, and maintains, its thermostable native state following ribosomal translation. However, there is a need to better decipher how newly synthesized proteins are further handled by the protein homeostasis network following the release of polypeptides from ribosomes. For instance, some newly synthesized polypeptides only reach their thermostable native states once they are correctly localized in the cell. Additionally, although the assembly of certain protein complexes have recently been shown to occur co-translationally (Shiber et al., 2018; Stein et al., 2019), many large macro-assemblies presumably rely on complex multi-step processes. For example, ribosomal proteins are trafficked to the nucleolus, where they are assembled into preribosomes with the help of assembly factors (Woolford and Baserga, 2013), and unassembled ribosomal subunits are rapidly cleared from the cell to prevent their accumulation (Nguyen et al., 2017; Sung et al., 2016; Yanagitani et al., 2017). Therefore, some of these newly translated proteins will likely remain more sensitive to stresses following their synthesis in comparison with other proteins because they are more prone to misfold or need time to be properly incorporated in larger assemblies. However, we currently have a limited understanding of these proteins and how they are handled in the cell.
Using a proteomic approach, we address this gap in knowledge by systemically assessing which newly translated proteins in Saccharomyces cerevisiae, when subjected to heat stress, are more susceptible to aggregation before reaching a state that confers solubility. We find that newly synthesized proteins with increased “pelletability” (i.e., the ability to be enriched in the pellet fraction after centrifugation) following heat shock are abundant proteins that are highly structured. Moreover, their structural features, membership in large protein complexes, and enrichment in chaperone-binding motifs suggest that this cohort of proteins is particularly dependent on the proteostatic network early on in their lifetimes. Our study provides greater insights into protein folding in the cell by revealing which newly translated proteins are more susceptible to destabilizing stresses such as heat shock.
RESULTS
A subpopulation of proteins is more susceptible to aggregation when newly translated
We sought to determine whether a cohort of newly translated proteins is more prone to aggregation due to heat-induced misfolding relative to other polypeptides. Notably, we hypothesized that this group of proteins is characterized by distinct protein features associated with complex folding or the necessity to be incorporated in complexes. Therefore, we used a pulse stable isotope labeling with amino acids in cell culture (SILAC) approach (experiment 1) to identify newly synthesized polypeptides that display a higher propensity to be enriched in the pellet fraction following heat shock in S. cerevisiae.
First, we labeled long-lived proteins with light SILAC medium in log-phase growing yeast cells incubated at 25°C. We then pulse labeled cells with heavy SILAC medium for 15 min followed by a 20-min heat shock at 45°C Figure 1A). Total cell lysate (TCL) and the pellet fractions were collected after centrifugation and then analyzed by bottom-up mass spectrometry. We quantified 3,410 proteins in four biological replicates, including 2,610 proteins quantified in at least three experiments in both fractions (Figure S1A; Table S1). Light to heavy ratios showed strong correlations in pairwise comparisons for samples derived from the same fraction (Figure S1B). Light to heavy ratios in the TCL were normally distributed with a median 10.89% heavy SILAC labeling (Figure S1C), which is expected for a 15-min labeling and 150-min cell doubling time. To determine what fraction of newly translated proteins entered the pellet after heat shock, we normalized the light to heavy ratios using the TCL ratios for the 2,610 proteins quantified in at least three out of the four replicates (Figure 1B). In this analysis, proteins isolated in the pellet fraction that consist of long-lived species should have TCL-normalized values near zero in the log scale (i.e., they display similar light to heavy ratios in both fractions). In contrast, proteins that are more represented in the pellet fraction as newly synthesized polypeptides should have positive values. We found 574 proteins that were significantly (p < 0.05) enriched as newly translated proteins over a 2-fold enrichment in the pellet fraction (Figure 1C; Table S1). For instance, the Rpl12 ribosomal protein and the Tdh3 glyceraldehyde-3-phosphate dehydrogenase protein displayed over 5-fold enrichment (Figure S1D). In addition, 40 proteins appeared to be significantly depleted as newly synthesized proteins from the pellet fraction (Table S1). This set of depleted proteins has a much higher proportion of heavy-labeled peptides in the TCL (i.e., newly synthesized) potentially due to higher translation or turnover rates (Figure S1C). These results indicate that a specific cohort of newly synthesized proteins become enriched in the pellet fraction upon heat shock (we call them thermo-sensitive), whereas the majority of newly synthesized polypeptides are not specifically affected by the stress.
Figure 1. Identification of newly translated proteins that aggregate upon heat stress by pulse SILAC.

(A) Schematic of experiment 1 in which proteins are pre-labeled in light (L) SILAC medium prior to a pulse labeling in heavy (H) medium and heat shock (S, supernatant fraction; P, pellet fraction; T, TCL).
(B) The graph displays the log2 values of the normalized SILAC ratios that compare the H/L ratios of the proteins in the pellet fraction (P) over the H/L ratios in the TCL (T). Proteins are ranked based on the averaged log2 ratios (green), each gray dot represents one of four replicates if quantified, and the light green shade marks the two standard deviations below and above the mean, which is smoothed over a sliding window length of 50.
(C) Volcano plot of log2 values of the normalized SILAC ratios plotted against the −log10 of t test p values. The dotted lines indicate proteins that have a t test p value < 0.05 and at least a 2-fold change.
Aggregation of newly translated proteins is not caused by heat-induced translation stalling
We wanted to determine whether the newly synthesized polypeptides that are over-represented in the pellet might correspond to partially translated proteins that would misfold and aggregate, contributing to an increase of pelletability after heat shock (Figure 2A). However, we found no evidence for a bias toward N-terminal peptides or a higher proportion of light SILAC labeling in the N-terminal regions among the 574 proteins (Figure 2B). Similarly, we did not observe any SILAC labeling bias in the proteins we quantified in the TCL (Figure S2A). Therefore, we can conclude that the possible heat-induced premature termination of translation does not contribute to the accumulation of newly synthesized polypeptides within the pellet fraction and does not seemingly influence the observed pulse-SILAC ratios at the proteome level.
Figure 2. Identification of protein translated during heat shock.

(A) Illustration of how partially translated proteins would lead to an N-terminal peptide bias.
(B) The graph shows the H/L ratios of peptides of proteins quantified in the pellet fraction in experiment 1 (y axis) that are positioned based on their location in the protein (x axis). Gray points show individual measurement from all four replicates. Colored lines show rolling median ratios with a5% window and 1% increment of each replicate.
(C) Schematic of experiment 2 in which proteins are pre-labeled in light (L) SILAC medium prior to a 2-min heat shock followed by pulse labeling in heavy (H) medium.
(D) Volcano plot of log2 H/L SILAC ratios values plotted against the –log10 of t test p values. Three biological replicates were analyzed. The dotted lines indicate proteins that have a t test p value < 0.05 and a labeling over two mean absolute deviations (MADs).
Next, we sought to verify that the pulse-SILAC results are not influenced by changes in ribosomal translation that could occur during heat shock. Translation is thought to be inhibited upon acute heat stress (McKenzie et al., 1975; Shalgi et al., 2013). However, we cannot exclude that cap-independent translation mechanisms may still allow some proteins to be synthesized, such as those involving Gis2 (Sammons et al., 2011). Therefore, we carried out a second pulse-SILAC experiment where the light SILAC-labeled culture was pulsed label with heavy SILAC 2 min after the initiation of the heat shock. Heat shock was then continued for another 18 min (Figure 2C; experiment 2). Cells were collected and lysed for the mass spectrometry analysis of the TCLs of three biological replicates. We quantified 2,138 proteins in all three biological replicates that show low level of heavy SILAC labeling (Figures S2B, S2C; Table S1). We only identified 19 proteins that were significantly more labeled with heavy SILAC (p <0.05) over two mean absolute deviations (MADs) (Figure 2D). Importantly, none of these 19 proteins were among the 574 newly synthesized proteins enriched in the pellet fraction that were identified in experiment 1 (Figure S2C). In fact, the proteins enriched for newly synthesized in experiment 1 displayed a lower heavy labeling than average in experiment 2 (Figure S2C), indicating that their accumulation in the pellet fraction is not due to increased translation during the stress. Collectively, these results suggest that thermo-sensitive proteins correspond to polypeptides that are fully translated prior to accumulation in the pellet fraction.
Newly synthesized thermo-sensitive proteins are stable when mature
We recently identified a cohort of 86 heat-stress granule proteins that become depleted from the supernatant fraction following heat shock (Zhu et al., 2020). When we compared the pulse labeling ratios from experiment 1 with data from our pervious study, we found that, strikingly, heat-stress granule proteins form a distinct cohort, which is constituted of long-lived species that accumulate in the pellet fraction (Figure 3A). From this analysis, we can also infer that the long-lived proteins of the cohort identified in experiment 1 mainly remain in the supernatant fraction following heat shock. To validate our conclusions, we fused two proteins, Rpl12 and Ola1, to a tandem fluorescent protein timer with mCherry and super-folding (sf) GFP coupled to an inducible copper promoter to track newly translated proteins (Figure 3B). Due to differences in maturation rates of the fluorophores, newly translated proteins with an mCherry-sfGFP tag would display a GFP signal shortly after translation and then would start to display mCherry signal after approximately 30 min (Khmelinskii et al., 2012). When tagged with mCherry-sfGFP tag, Rpl12 showed diffused signal for both GFP and mCherry when unstressed (Figure 3C). After incubation at 45°C for 20 min, foci formed, indicative of aggregation, with sfGFP but not mCherry (Figures 3C and S3). In contrast, the sfGFP signal remained diffused after heat shock in the control experiment, where the tandem timer is expressed alone. These results indicate that while mature Rpl12 species were not recruited to foci, newly translated products were. When we, instead, fused the tandem timer to the Ola1 stress granule protein, the heat-induced foci could be seen in both in the sfGFP and mCherry channels (Figures 3C and S3). Taken together, we conclude that we have identified a distinct group of proteins that are seemingly unaffected by the heat shock once they “mature,” having reached their native states but are likely to lose solubility and coalesce when they are newly synthesized.
Figure 3. Newly translated proteins enriched in pellets are distinct from stress granule proteins and only form foci in cells as newly translated proteins.
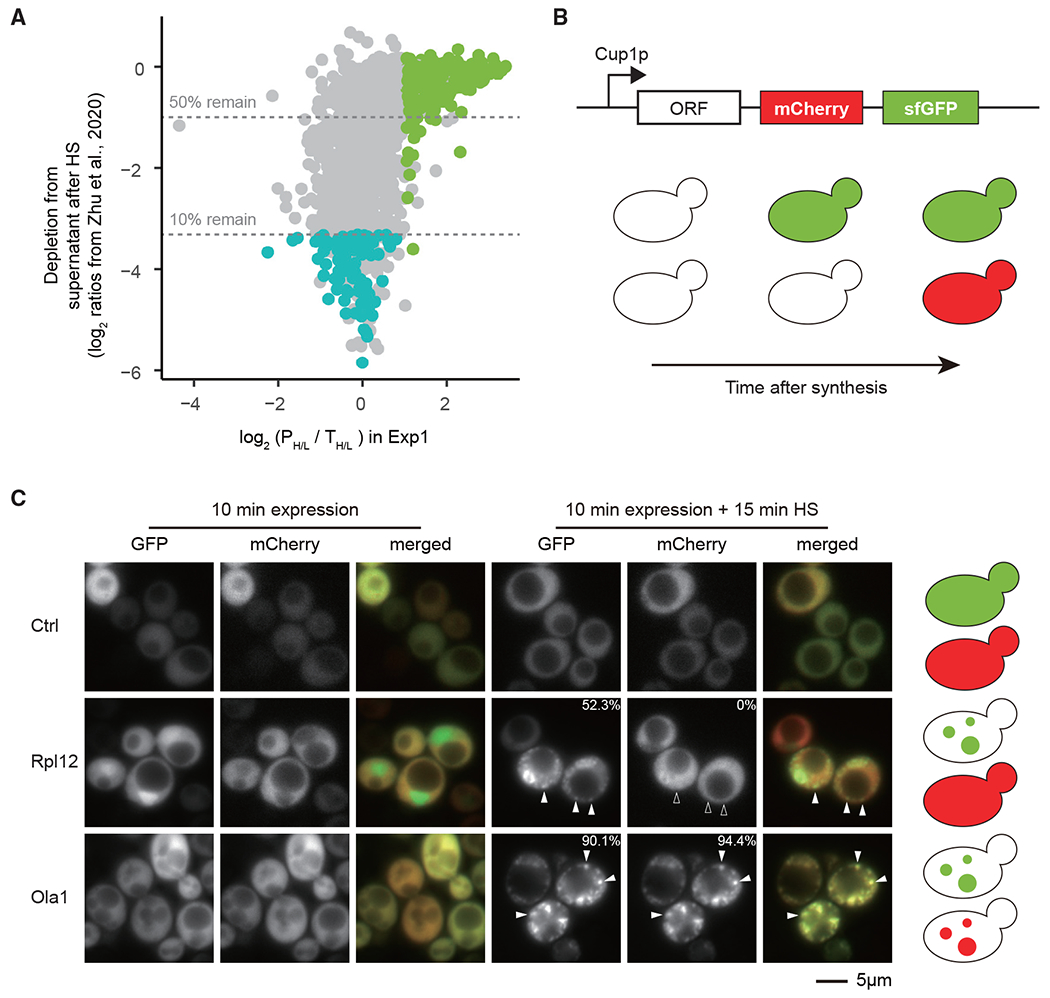
(A) Comparison of data from Zhu et al. (2020) and data from experiment 1. The y axis displays log2 (H/L) of proteins that remain in supernatant after heat shock of heavy-labeled cells (H) versus control light-labeled cells (L) (proteins with low ratios are depleted from the supernatant fraction) and x axis displays the log2 (PH/L/TH/L) of proteins in the pellet in experiment 1. Green dots show newly translated proteins enriched in pellet fraction; blue dots show stress granule proteins identified in Zhu et al. (2020).
(B) Illustration of the tandem fluorescent protein timer construct and expected phenotype of different proteins under heat shock when newly translated.
(C) Representative images of cells expressing indicated proteins fused to the tandem fluorescent protein timer. Protein expression was induced for 10 min and cells treated with or without 15-min heat shock at 45°C. Solid arrowheads show selected foci; hollow arrowheads mark the absence of localization in the selected foci. The percentage number indicates the fraction of cells with at least one focus (n = 88 in Rpl12B and n = 130 in Ola1).
Newly translated thermo-sensitive proteins specifically aggregate after heat stress
A caveat of experiment 1 is that it cannot differentiate whether an increase in the pelletability of a newly synthesized protein is due specifically to heat shock or if the protein is simply more pelletable when it is newly translated, independent of the stress. To address this issue, we designed a third pulse-SILAC experiment (experiment 3) to specifically distinguish between newly translated proteins in stress-induced pellet (ntSP) and newly translated proteins constitutively in the pellet (ntCP). We pre-labeled log-phase growing yeast cells in light SILAC medium at 25°C and switched to either medium or heavy SILAC medium for a pulse labeling of 15 min. Medium-labeled cells were collected immediately after the pulse labeling, while heavy-labeled cells were further incubated at 45°C for a 20 min of heat shock prior to cell lysis, fractionation, and mass spectrometry analysis (Figure 4A). In this particular experiment, ntSP proteins should display higher heavy to medium SILAC ratios, whereas ntCP should have similar labeling levels. We quantified 2,520 proteins in at least three of the four biological replicates (Table S1), including a large portion of proteins also quantified in experiment 1 (Figure S4A). When we examined the heavy to medium ratios in the TCL, most proteins displayed similar labeling levels, confirming that translation was shut down due to these heat shock conditions (Figure S4B). Next, we examined proteins that were enriched as newly synthesized protein in the pellet in experiment 1 (574 proteins) that were also quantified in experiment 3 (477 proteins, Figure 4B). Indeed, using a 2-fold enrichment cutoff, we identified 368 ntSP proteins (p < 0.05, Table S1) and a cohort of 72 ntCP (p > 0.05, less than 2-fold enrichment, Table S1). To validate our observations, we performed a series of experiments using the GAL1 promoter that can be turned on and off following the addition of galactose and dextrose, respectively. We selected four ntSP proteins: the Tpi1 triose phosphate isomerase, the Rpl12 ribosomal protein, the poorly characterized Hri1, and the Arg1 arginosuccinate synthetase. Expression of the newly translated proteins was achieved following the addition of galactose for 15 min prior to harvesting cells or heat shock (Figure 4C). In contrast, and to assess mature proteins, the 30-min expression was induced 60 min prior to collecting cells or the heat stress. Remarkably, in all four cases, we observed more newly translated proteins in the pellet fraction following heat stress in comparison with unstressed cells and long-lived proteins (Figures 4D and S4C). These results corroborate the proteomic analysis that indicates there is a distinct cohort of proteins that aggregate specifically after translation upon heat shock.
Figure 4. Identification of ntSP and ntCP proteins.

(A) Schematic of experiment 3 in which proteins are pre-labeled in light (L) SILAC medium prior to a pulse labeling in heavy (H) medium followed by heat shock, or medium (M) media (S, supernatant fraction; P, pellet fraction; T, TCL).
(B) Volcano plot of log2 values of the normalized SILAC ratios (log2 [HP/MP]/[HT/MT]) plotted against the −log10 of t test p values. Four biological replicates were analyzed. The horizontal dotted line indicates a t test p value of 0.05 and the vertical dotted line indicates a fold change of 2. ntSP proteins are depicted in green and ntCP proteins shown in darker gray.
(C) Schematic of the validation experiment to compare sedimentation of long-lived (LL) and newly translated (NT) proteins.
(D) Western blots of the TCL (T), supernatant (S), and pellet (P) fractions of 3HA-tagged Tpi1, Rpl12, Hri1 and Arg1, and Pgk1. Uncropped blots are available in Figure S4D.
Newly translated thermo-sensitive proteins are largely folded, participate in assemblies, and are enriched for chaperone-binding motifs
Mature proteins that have increased pelletability after heat shock were shown to prominently localize in stress granules. These proteins are longer, more disordered, and are less hydrophobic in comparison with the proteome (Zhu et al., 2020). We recently showed that many of these features can be used to predict the propensity of proteins to be recruited to membraneless compartments such as stress granules (Kuechler et al., 2020, 2022). We hypothesized that the ntSP cohort instead contains proteins with sequences that are prone to misfold because they encode for a higher number and/or more complex folded domains, or because these proteins are incorporated in large complexes in their native states. These properties may require particular attention by the chaperone system, which declines during acute heat stress.
We first investigated whether ntSP proteins (n = 368) are enriched in folded domains and features associated with complex folding topology, when compared with all the proteins that did not have over 2-fold enrichment in the first experiment (control; n = 2,036; Table S1) and the yeast proteome (n = 6,721). The control set was included to ensure that observed trends are not due to our analytical method. A significantly larger fraction of the ntSP proteins’ sequence is, on average, contained within Pfam domains (Figure 5A). Similarly, these proteins are enriched for multidomain composition (Figure S5A) and display a higher number of Pfam domains per sequence length compared with controls (Figure S5B), indicating that the length of the polypeptides is unlikely to be driving these results. Moreover, ntSP proteins are not conclusively enriched for shorter or longer proteins in comparison with controls (Figure S5C). Consistent with the high structure content, ntSP proteins have significantly higher grand average of hydropathy (GRAVY) scores (Figure S5D) and a lower percentage composition of polar residues than control sets (Figure S5E). Moreover, ntSP proteins are also predicted to have fewer solvent-exposed and disordered residues than both control sets (Figures 5B and 5C). Finally, the ntSP set is significantly enriched in proteins with catalytic activity and involvement in small-molecule metabolism (Figure 5D), annotations that are associated with proteins that have folded domains. Specifically, proteins with NAD(P)H-binding (29 proteins, p = 1.1E-6) and proteasome subunits (11 proteins, p value = 1.5E-6) were significantly over-represented (Table S2). Overall, these analyses reveal that ntSP proteins are mainly composed of folded domains. This result could explain the absence of these proteins in the pellet fraction when heat shock is applied once they are matured (i.e., once they have reached the folded state). Consistent with the idea that these proteins are generally more stable once mature, we found that ntSP proteins have significantly longer half-lives than the proteins in the controls (Figure 5E) and are more abundant in the cell (Figure 5F). This observation is consistent with the observation that abundant proteins tend to be more structured (Gsponer et al., 2008). To rule out the possibility that the association of specific features with ntSP proteins might be driven by abundance, we compared ntSP proteins with the top 20% most abundant proteins from the proteome. At this cutoff, ntSP proteins do not have a significantly different abundance with this new control set (Figure S5F). All features previously described remain significantly different between ntSP proteins and high-abundant proteins from the proteome (Figures S5G–S5M) and assure us that the features associated with ntSP proteins are not simply driven by their higher abundance.
Figure 5. Protein feature analysis of ntSP and ntCP proteins.

(A–C, E, and F) Boxplots comparing distributions of ntSP, ntCP, control proteins (ctrl), and proteome (PME). The following analyses are shown: the sum of residues within a Pfam domain normalized by protein length (A), percentage solvent exposed (B), percentage predicted disordered (C), protein half-life in hours (E), and protein abundance (F); p values (Hochberg adjusted Wilcoxon test) are shown and/or reported in Table S4.
(D) Gene Ontology (GO) analysis of ntSP proteins. Circle size and number indicate the number of proteins within each GO term and placed according to their fold enrichment and significance by Fisher test.
Given the high structural content, we tested whether ntSP proteins and their folded domains have features associated with complex folding and an increased risk for misfolding and aggregation. ntSP proteins have a significant enrichment for β sheets (Figures 6A and S6A–S6D), a secondary-structure element that often involves long-range contacts, as in the case of Hri1, one of the validated ntSP members. Polypeptides with β sheets have been suggested to fold more slowly (Kubelka et al., 2004; Plaxco et al., 1998). ntSPs have a higher contact order (CO) that characterizes complex folders (Figures 6B and S6E). However, the CO is not significantly different when comparing ntSP with other proteins of similar structure content (Figures S6F and S6G). In addition, a higher portion of ntSP proteins have lasso-like entanglements in comparison with the proteome (Figure 6C). These entanglements are formed when one segment of the protein backbone forms a loop through which another segment threads within the three-dimensional native structure (Figure S6H) (Sulkowska, 2020). For instance, enolase 1 and hexokinase 2 form three and two entanglements, respectively (Figure S6I). In contrast, ntSP proteins lack a significant elevation in the median number of aggregation-prone stretches to both controls (Figure S6J). In summary, newly translated thermo-sensitive proteins have more complex structures and are enriched in β sheets but lack easily detectable signs of higher aggregation likelihood, perhaps suggesting that this cohort of proteins requires greater assistance from the protein homeostasis network to reach their native states.
Figure 6. Structural feature analysis of ntSP and ntCP proteins.

(A and B) Boxplot comparing percentage β-predicted sheet (A) and contact order distributions (B) of ntSP, ntCP, control proteins (ctrl), and PME.
(C) Comparison of the proportion of indicated proteins with lasso-like self-entanglements.
(D) Comparison of proportion of protein with at least one binding site for Ssb (left) and TRiC (right) in ntSP proteins (green) and PME based on a study from Dr. Frydman and colleagues (Stein et al., 2019).
(E) Comparison of the proportions of proteins in stable complexes within ntSP proteins and PME. n and corrected p values (Wilcoxon test in A and B, permutation test in C, and Fisher test in D and E) are shown and reported in Table S4.
We next determined whether ntSP proteins may be more dependent on specific chaperones for folding. Client proteins of TRiC/CCT were previously found to be less disordered and to have more β sheet character (Stein et al., 2019), similar to ntSP proteins. Indeed, and perhaps not surprisingly, we found that the ntSP set contains a higher proportion of proteins with Ssb Hsp70 chaperone and TRiC/CCT-binding motifs in comparison with controls (Figure 6D). Therefore, ntSP proteins are likely to be more reliant on Hsp70 and TRiC/CCT chaperones during translation and following the release of nascent chains.
Finally, because ntSP proteins are associated with small molecules or nucleic acids (Figure 5D), we hypothesized that the ntSP cohort would also contain proteins that are incorporated in large complexes. Upon investigation, we found that a significantly greater portion of ntSP proteins are part of stable protein complexes compared with the proteome (Figure 6E). Interestingly, proteins within stable protein complexes in S. cerevisiae are, in general, more disordered, less hydrophobic, and have more residues that are predicted to be solvent exposed in comparison with proteins not annotated to be within complexes (Figures S6K and S6M). However, the ntSP set constitutes a group of proteins with sequences that are more hydrophobic and predominantly folded into domains, and may therefore remain more thermo-sensitive until assembled.
Thermo-sensitive proteins display a subset of regions/domains that are more exposed following synthesis
Our work identifies the ntSP cohort as a group of proteins that has an increased pelletability prior to reaching the native state in the cell when exposed to heat stress. Therefore, we hypothesized that ntSP contains proteins that have a higher probability of sampling partially folded and potentially aggregation-prone states following their synthesis. These partially folded states should make certain sequence regions more accessible to proteolytic cleavage than they are in the native state. To assess this possibility, we combined a limited proteolysis (LiP) approach with pulse-SILAC labeling. As before, pulse SILAC is used to distinguish recently synthesized proteins (i.e., heavy SILAC labeled) from long-lived proteins (i.e., light SILAC labeled). In parallel, a medium SILAC culture is grown for reference. The lysate derived from pulsed SILAC labeled cells was subjected to a short proteinase K (PK) treatment followed by sample denaturation and complete trypsin digestion (Figure 7A). To establish the method, we first used different concentrations of PK and observed a range of proteolytic cleavages that increase with the added amounts of the protease (Figure S7A; Table S3). We further analyzed the sample treated with a 1:1,000 protease dilution (1 ng of PK per microgram of sample) in which only minor PK activity was noticed among long-lived proteins. We identified a cohort of 92 proteins with at least two LiP peptides that display a distinctive loss of the heavy SILAC signal in comparison with untreated sample (no PK) but with no major change of levels in the light channel (see example iii in Figure 7A). Remarkably, 53 of these 92 proteins were previously identified as ntSP proteins (Figures 7B, S7B, S7C; Table S3). About 50% of the peptides derived from these 53 ntSP proteins are affected by the PK treatment in the heavy SILAC channel. For instance, a specific region of the yeast elongation factor 2 (Eft1,2) is more accessible to PK within recently synthesized (i.e., heavy labeled) but not long-lived species (Figures 7C and S7D). Interestingly, that region includes domain III, which was recently shown to interact with the Hgh1 chaperone that mediates the recruitment of TRiC and Hsp90 to help with the folding of Eft1,2 C-terminal domain and domain III, respectively (Mönkemeyer et al., 2019; Schopf et al., 2019). About half of the peptides affected by PK in newly synthesized proteins (hereafter called LiP peptides) are located in α helices or β sheets (Figure S7E), and several of these peptides are buried, having low solvent-accessible surface areas, in their mature protein structures (Figure 7D). Indeed, residues in LiP peptides are generally less solvent exposed in comparison with other tryptic peptides (Figure 7E). Therefore, folding of these proteins in their native states was most likely not completed upon their release from the ribosome, otherwise these segments would not have been accessible to PK. Moreover, a larger portion of thermo-sensitive proteins with LiP peptides have entanglements in comparison with the proteome (Figure 7F). Markedly, other regions are not sensitive to PK in these proteins (Figure S7C), indicating the domains are either partially folded or protected by other factors such as chaperones. Our findings imply that some ntSP proteins go through partially folded states that are sampled long enough following protein synthesis such that they become sensitive to protease digestion, which could explain why some of these proteins are more thermo-sensitive.
Figure 7. Analysis of the limited proteolysis experiment.

(A) Schematic of the LiP experiment combined with pulse SILAC. The lysate derived from pulsed SILAC cells (15 min in heavy SILAC medium; H) is first treated with proteinase K (PK) in native conditions and then denatured for a trypsin digest. For comparison, medium SILAC-labeled cells (M) are only subjected to the trypsin digest. Folded regions are not accessible to PK (i). Regions that require more time for folding are expected to be only PK sensitive in the heavy channel (iii) but not in the light channel (ii).
(B) Proportions of ntSP proteins and PME that have at least two PK-sensitive peptides in NT proteins.
(C) On the left, each quantified peptide for the elongation factor 2 protein encoded by the EFT1 and EFT2 genes is placed according to its location in the sequence. For each peptide, the log2 of the normalized H/M (circles) and L/M (triangles) ratios are shown. Each ratio is normalized using the ratio in the reference sample with no PK treatment. Peptides that display higher PK sensitivity (over a 2-fold threshold) are depicted in red. On the right, the regions spanning between these peptides are depicted in red in the structure (PDB: 6GQB).
(D) Selected PK-sensitive peptides in NT proteins are depicted in red in the structure of the cytosolic and endoplasmic reticulum (ER)-associated Oye2 NADPH oxidoreductase (343–349, 350–360), the cytosolic Shm2 serine hydroxymethyltransferase (188–198), and the mitochondriai Ade13 adenylosuccinate lyase (132–138).
(E) Solvent-accessible surface area (SASA) distribution of LiP peptides from the 53 ntSP proteins identified in the pulse-SILAC analysis compared with all tryptic peptides identified in the reference sample with no PK treatment in this experiment.
(F) Proportion of ntSP proteins with at least two LiP peptides and PME that have lasso-like self-entanglements. n and corrected p values (Fisher test in B, Wilcoxon test in E, and permutation test in D) are shown and reported in Table S4.
(G) We propose a model in which a specific cohort of proteins in the cell require more time following synthesis to reach their native states, in which they remain soluble following heat stress. The thermo-sensitivity of ntSP is potentially due to a slower folding process or kinetically trapped folding intermediates caused by specific features and/or more complex structure topology (i), a possible higher dependence on protein chaperone (ii), and/or the reliance on binding partners for stability (iii).
DISCUSSION
Most newly translated proteins need to correctly fold to reach their functional, native states. While recent work has deepened our understanding of how nascent polypeptides are handled co-translationally by chaperone proteins, it remains unclear whether some newly translated proteins need specific attention by the protein homeostasis network following their release from the ribosome. Specifically, it is unclear whether certain proteins are particularly susceptible to aggregation before reaching a state that confers solubility. This study provides a systematic survey of thermo-sensitive, newly translated proteins and reveals deeper insights into protein homeostasis.
We found a cohort of proteins that is more sensitive to heat stress following translation in comparison with other newly synthesized polypeptides, which are referred to as thermo-sensitive proteins (defined by the ntSP set). We show that the increase of pelletability of these newly translated proteins after heat shock is not due to premature translation termination and confirm that translation during acute heat shock is largely limited and thus has a negligible contribution to the content of newly translated proteins that become pelletable.
It is worth noting that ntSP proteins are only enriched in the pellet fraction following their synthesis. When the pelletability of proteins is assessed after heat shock without considering whether these proteins have been recently synthesized (Zhu et al., 2020), ntSP proteins largely remain in the supernatant. These results indicate that ntSP proteins are only pelletable shortly after their synthesis, as the bulk of these proteins are not thermo-sensitive once mature. In agreement, the vast majority of ntSP proteins are not major components of stress granules, which are highly pelletable following heat shock upon their assembly into large condensates. Nonetheless, ntSP proteins—but not their mature forms—may also be recruited to stress granules and their presence may play a role in the formation of the condensates. For instance, chemical inhibition of translation abrogates stress granule formation (Jain et al., 2016; Wallace et al., 2015). More work will be required to assess whether ntSP are in general specifically recruited to stress granules.
Surprisingly, ntSP proteins are highly abundant in the cell and, when we compared ntSP proteins with abundant proteins in the proteome, we found that ntSP proteins display distinct features. The presence of abundant proteins in the pellet fraction can be counter-intuitive, as one would expect an evolutionary pressure to reduce their footprint. For instance, highly expressed proteins were previously shown to evolve at a slower rate, presumably because these proteins trend toward optimal translational robustness (Agozzino and Dill, 2018; Drummond et al., 2005). Nevertheless, the aggregation of these newly synthesized proteins is specific to the heat shock conditions in our experimental framework, which does not typically apply in the natural environment and would therefore not necessarily be selected against. In contrast, proteins that are constitutively more prone to aggregation following synthesis (i.e., ntCP) are less abundant, and their aggregation has possibly only a minor impact in cell fitness.
ntSP may constitute a class of proteins that is highly structured, requiring the folding of a higher-than-average number of residues into complex topologies. Notably, these ntSP proteins show distinct features that are, at least partially, consistent with this notion (Figures 7G–i). They have a larger portion of their protein sequence embedded in a structured domain, while being predicted to be less disordered than the proteome. Moreover, in line with more complex topologies, they have a greater β sheet structure content, and a higher portion of these proteins have non-covalent lasso-like self-entanglements. Importantly, we found in the LiP experiment (in which no heat shock was performed) that many ntSP have regions more accessible to the exogenous PK following translation, regions that are not PK sensitive within matured proteins. Markedly, several peptides of ntSP proteins affected in the LiP experiment correspond to residues poorly exposed, suggesting that folding of the domain was not completed. In addition, a larger fraction of ntSP proteins have chaperone-binding sites, suggesting that these proteins are more dependent on chaperone assistance for folding (Figure 7G–ii). Hsp70/Ssb, besides their role in ribosome-associated nascent chain folding, were also shown to remain associated with nascent chains after being released the ribosome (Willmund et al., 2013). This association indicates that, perhaps unsurprisingly, protein folding extends far beyond the end of translation, particularly for proteins from the ntSP cohort
ntSP proteins are largely composed of folded domains and interact with chaperones, which may suggest a longer-than-average folding time after protein synthesis. This lag time between synthesis and reaching the native state could leave them vulnerable to heat stress, as seen in our pulse-SILAC experiments, which would then lead to higher pelletability during this time frame. Additionally, ntPS proteins may become pelletable because, during this time window, they remain “orphaned” from their binding partners and complexes (Figure 7G–iii). As shown, the ntSP set is enriched for proteins that bind with small molecules and for proteins that are part of stable complexes. Indeed, orphaned subunits of protein complexes have been shown to be unstable, as in the case of α-subunit of fatty acid synthetase Fas2 (Scazzari et al., 2015). Consistent with this idea, we found several LiP peptides that, at least partially, overlap with predicted protein-protein interaction interfaces (data not shown), suggesting that these proteins are not yet assembled into their complexes at the time limited proteolysis is done. Therefore, several of these proteins may only reach a thermostable conformation after assembling into larger protein complexes or finding the right stabilizing partner molecule. It has also been shown that small-molecule ligands produced by metabolic pathways can stabilize the folded state of proteins (Fan et al., 1999; Hammarström et al., 2003).
Our study reveals which newly synthesized proteins remain susceptible to thermal shock for an extended period of time following their release from the ribosome. The discovery that the ntSP set consists of a distinct pool of proteins that share distinct features is instrumental to further understanding of protein homeostasis in the cell.
Limitations of the study
Our current approach uses pulse labeling to capture a single snapshot of newly translated thermo-sensitive proteins after a 15-min period and does not provide finely stratified temporal information. Additionally, due to protocol limitations, we were not able to quantify semi-tryptic peptides in our LiP experiment, thus limiting our ability to precisely map regions cleaved by PK. Finally, our study does not closely examine newly synthesized proteins that are in the pellet fraction independently of the stress (ntCP). These proteins display intermediary features that appear similar to ntSP proteins but are, in most cases, not significantly different from controls (Table S4). We believe that the low number of proteins identified as ntCP reduces the statistical power of this analysis.
STAR★METHODS
RESOURCE AVAILABILITY
Lead contact
Further information and requests for resources and reagents should be directed to and will be fulfilled by the lead contact, Thibault Mayor.
Materials availability
All unique/stable reagents generated in this study are available from the lead contact with a completed Materials Transfer Agreement.
Data and code availability
All Raw proteomic data are deposited in the PRIDE repository from the ProteomeXchange Consortium (PXD024336 and PXD028934).
All original code is publicly available and has been deposited at Zenodo. DOIs are listed in the key resources table.
Any additional information required to reanalyze the data reported in this study is available from the lead contact upon request.
KEY RESOURCES TABLE
| REAGENT or RESOURCE | SOURCE | IDENTIFIER |
|---|---|---|
| Antibodies | ||
| Mouse Monoclonal Anti-HA | AbLab | Cat# 12CA5 |
| Rabbit Polyclonal Anti-Pgk1 | Acris | Cat# AP21371AF-N |
| IRDye® 800CW Goat Anti-Mouse IgG | LI-COR | Cat# 926-32210 |
| IRDye® 800CW Goat Anti-Rabbit IgG | LI-COR | Cat# 926-32211 |
| Bacterial and virus strains | ||
| NEB5α Competent E. coli | NEB | Cat# C2987I |
| Chemicals, peptides, and recombinant proteins | ||
| Difco™ Yeast Nitrogen Base without Amino Acids | BD Life Sciences | Cat# 291940 |
| 13C6 Arg-6 | Silantes | Cat# 201204102 |
| 13C6 15N4 Arg-10 | Silantes | Cat# 201604102 |
| D4 Lys-4 | Silantes | Cat# 211104113 |
| 13C6 15N2 Lys-8 | Silantes | Cat# 211604102 |
| IGEPAL® CA-630 (NP-40) | Sigma-Aldrich | Cat# I3021-100ML |
| Phenylmethylsulfonyl fluoride (PMSF) | Roche | Cat# 1359061 |
| cOmplete™, EDTA-free Protease Inhibitor Cocktail (PIC) | Roche | Cat# 5056489001 |
| Proteinase K | SIGMA | Cat# P2308-100MG |
| SigmaUltra Iodoacetamide | Sigma-Aldrich | Cat# I1149 |
| Tris-(2-carboxyethyl)phosphine (TCEP) | Gold Biotechnology | Cat# TCEP25 |
| Sequencing Grade Modified Trypsin, Frozen | Promega | Cat# V5113 |
| Sera-Mag™ SpeedBead Carboxylate-Modified [E7] Magnetic Particles | GE Healthcare | Cat# 45152105050250 |
| Sera-Mag™ SpeedBead Carboxylate-Modified [E3] Magnetic Particles | GE Healthcare | Cat# 65152105050250 |
| LoFlo Medium | Formedium | Cat# CYN6502 |
| Critical commercial assays | ||
| GeneJET Genomic DNA Purification Kit | Thermo Scientific | Cat# K0722 |
| GeneJET Plasmid Miniprep Kit | Thermo Scientific | Cat# K0502 |
| GenCatch™ PCR Cleanup Kit | Epoch Life Science | Cat# 2360250 |
| Pierce™ BCA Protein Assay Kit | Thermo Scientific | Cat# 23225 |
| Gibson Assembly Master Mix | NEB | Cat# E2611L |
| Deposited data | ||
| Mass spectrometry results of pellet and total cell lysate fractions for Experiments 1-3 | This paper, PRoteomics IDEntification (PRIDE) repository | PXD024336 |
| Mass spectrometry results of supernatant fractions of Experiment 1 and the LiP experiment | This paper, PRoteomics IDEntification (PRIDE) repository | PXD028934 |
| Codes used for the bulk of the feature analysis in Figures 5, 6 and 7 | This paper | https://doi.org/10.5281/zenodo.6640632 |
| Codes used for the number of pfam domains (Figure S5A), contact order (Figure 6B) and SASA analysis (Figure 7E) | This paper | https://doi.org/10.5281/zenodo.6639064 |
| Code and data set for the analysis of native lasso-like self-entanglements (Figures 6C and 7F) | This paper | https://doi.org/10.5281/zenodo.6642237 |
| Experimental models: Organisms/strains | ||
| BY4741 strains (MATa, his3Δ1, leu2Δ0, met15Δ0, ura3Δ0) | Hieter lab | YTM408 |
| SILAC strain (MATa, his3Δ1, leu2Δ0, ura3Δ0, MET15, arg4Δ::KanMX6, lys2Δ0) | Measday lab | YTM1173 |
| Oligonucleotides | ||
| Oligonucleotides, See Table S5 | This paper | n/a |
| Recombinant DNA | ||
| pRS316-CUP1p-mCherry-sfGFP-ADH1t | This paper | BPM1455 |
| pRS316-CUP1p-RPL12B-mCherry-sfGFP-ADH1t | This paper | BPM1761 |
| pRS316-CUP1p-OLA1-mCherry-sfGFP-ADH1t | This paper | BPM1762 |
| pRS426-GAL1p-3HA-CYC1t | This paper | BPM1809 |
| pRS426-GAL1p-TPI1-3HA-CYC1t | This paper | BPM1819 |
| pRS426-GAL1p-HRI1-3HA-CYC1t | This paper | BPM1820 |
| pRS426-GAL1p-RPL12A-3HA-CYC1t | This paper | BPM1822 |
| pRS426-GAL1p-ARG1-3HA-CYC1t | This paper | BPM1823 |
| Software and algorithms | ||
| Bruker Compass HyStar 5.0 SR1 | Bruker Daltonics | Ver. 5.0.37.0 |
| MaxQuant | Computational Systems Biochemistry under Prof. Jürgen Cox | 1.6.14 |
| Zen 3.0 | Zeiss | n/a |
| Illustrator | Adobe Creative | n/a |
| Image Studio | LI-COR | Ver. 2.1 |
EXPERIMENTAL MODEL AND SUBJECT DETAILS
Yeast strains
All cells used in this study were derived from the Saccharomyces cerevisiae BY4741 strains (MATa, his3Δ1, leu2Δ0, met15Δ0, ura3Δ0). For SILAC, a modified BY4741 strain was used (YTM1173: MATa, his3Δ1, leu2Δ0, ura3Δ0, MET15, arg4Δ::KanMX6, lys2Δ0).
METHOD DETAILS
Plasmids
pRS316-CUP1p-mCherry-sfGFP-ADH1t (BPM1455) was generated by Gibson assembly of the PCR fragments of pRS316-CUP1p (from BPM1066) and mCherry-sfGFP-ADH1t from pFA6a-mCherry-sfGFP-natNT2 (BPM44, gift from Matthias Meurer). All used oligos are listed in Table S5. pRS316-CUP1p-RPL12B-mCherry-sfGFP-ADH1t (BPM1761) and pRS316-CUP1p-OLA1-mCherry-sfGFP-ADH1t (BPM1762) were generated by PCR of the respective genes from yeast genomic DNA and Gibson assembly into pRS316-CUP1p-mCherry-sfGFP-ADH1t. All tandem fluorescent protein timer plasmids were transformed into BY4741 cells (MATa, his3Δ1, leu2Δ0, met15Δ0, ura3Δ0). ARG1, HRI1, RPL12A and TPI1 were amplified from genomic DNA and inserted into pRS426-GAL1p-3HA-CYC1t (BPM1809) by Gibson assembly to generate pRS426-GAL1p-TPI1-3HA-CYC1t (BPM1819), pRS426-GAL1p-HRI1-3HA-CYC1t (BPM1820), pRS426-GAL1p-RPL12A-3HA-CYC1t (BPM1822), and pRS426-GAL1p-ARG1-3HA-CYC1t (BPM1823). Note that RPL12A and RPL12B encode for the same protein. All the HA-tagged constructs were transformed into BY4741 cells.
Yeast culture and sample preparation
Yeast cells were incubated at 25°C, unless otherwise stated. For the pulse SILAC Experiment 1, cells were grown in light labeled (0.03mg/mL Lys-0, 0.02mg/mL Arg-0) amino acids in synthetic defined (SD) medium with 2% dextrose for at least 7 generations. The equivalent of 80 OD600 of cells were taken and washed with heavy labeled SILAC medium (0.03mg/mL D4 Lys-4 and 0.02mg/mL 13C6 Arg-6) twice at room temperature and then resuspend in 100mL heavy SILAC medium and incubated at 25°C for 15 minutes before heat shock for 20 minutes at 45°C in a shaking water bath before cell collection. For pulse SILAC Experiment 2, cells were grown in light labeled (0.03mg/mL Lys-0, 0.02mg/mL Arg-0) amino acids in SD medium with 2% dextrose for at least 7 generations. The equivalent of 80 OD600 of cells were taken and washed SD-Lys medium (with no Lys or Arg) twice at room temperature and then resuspend in 100mL SD-Lys medium. The culture was heat shock for 2 minutes at 45°C before the addition of heavy labeled Lys and Arg to a 2x final concentration (0.06mg/mL Lys-4 and 0.04mg/mL Arg-6). The culture was heat shocked for another 18 minutes in a shaking water bath before cell collection. Cells were collected as in Experiment 1. For pulse SILAC Experiment 3, cells were grown in light labeled (0.03mg/mL Lys-0, 0.02mg/mL Arg-0) amino acids in SD medium with 2% dextrose for at least 7 generations. An equivalent of 80 OD600 of cells were taken and washed with either medium (0.03mg/mL Lys4 and 0.02mg/mL Arg6) or heavy (0.03mg/mL 13C615N2 Lys-8 and 0.02mg/mL 13C615N4 Arg-10) labeled SILAC media twice at room temperature and then resuspend in 100mL of their respective SILAC medium and incubated at 25°C for 15 minutes. The medium labeled culture was collected after 15 minutes incubation and the heavy labeled culture was heat shock for 20 minutes at 45°C in a shaking water bath before cell collection. All cell harvests were done by centrifugation at 3,220xg for 5 minutes at 4°C, washed twice with cold 1×TBS (50mM Tris pH 7.5, 150mM NaCl), mixed, and re-suspended in equal volume of 2×Native lysis buffer (200mM Tris pH 7.5, 150mM NaCl, 2mM PMSF, 2×Protease Inhibitor Cocktails). Re-suspended cells were snap-frozen drop by drop in liquid nitrogen. The resulting cells pellets were lysed by cryo-grinding in a Retsch MM400 (4 × 30Hz for 90sec) with 1.5mL grinding jar (Retsch #014620230) and one 2mm stainless steel grinding ball (Retsch #224550010). The lysates were thawed on ice and further diluted 3 times by adding ice-cold 1×Native lysis buffer with 1% NP40. Total cell lysates were pre-cleared twice by centrifugation at 1,000×g at 4°C for 15min. Pellet fractions were separated from the resulting supernatant by centrifugation at 16,100×g at 4°C for 15min. The insoluble protein pellet was washed twice with ice-cold 1 × Native lysis buffer containing 1% NP40 and re-solubilized in 1×Laemmli Sample Buffer. Protein concentrations were determined by using BioRad DC™ Protein Assay. In these conditions, we estimated that the protein mass in the pellet fraction account for ~6–7% of protein mass in total cell lysate. Based on the fact the median H/L labeling is about 11% in the total cell lysate and 14% in the pellet fraction, ~ 8.5% of newly synthesized proteins (i.e., heavy labeled) end up in the pellet fraction following heat shock. For the LiP experiment cells were grown in light labeled amino acids in synthetic defined (SD) medium with 2% dextrose for at least 7 generations. The equivalent of 80 OD600 of exponentially growing cells were taken and washed with heavy labeled SILAC medium (0.03mg/mL D4 Lys-8 and 0.02mg/mL 13C6 Arg-10) twice at room temperature and then resuspend in 100mL heavy SILAC medium and incubated at 25°C for 15 minutes. In parallel, cells were grown in medium labeled SILAC medium (0.03mg/mL D4 Lys-4 and 0.02mg/mL 13C6 Arg-6) for at least 7 generations to the equivalent of 80 OD600 of cells. The lysis was done in absence of PMSF and protease inhibitor and 0, 0.01, 0.05, 0.2, 1, 5, and 20ng of Proteinase K (SIGMA P2308-100MG) per μg of lysate was added for a 5 min incubation at 20°C. SDS was added to 1% and sample boiled at 5°C for 5 min. No PK was added to medium SILAC labeled cells in which SDS was directly added following lysis.
For the GAL expression of select HA-tagged proteins, the transformed strains were pre-cultured in SD-Ura media with 2% raffinose split into two cultures at 0.65 OD600. To assess the long-lived proteins, 2% galactose was added for 30 min, then supplemented with 2% dextrose for another 30 min. To assess newly translated proteins 2% galactose was added for 15 min prior adding 2% dextrose. 50mL of cells was harvested immediately by centrifugation at 3,220xg at 4°C (no heat shock control) while another 50mL of cells was heat shocked for 30 min at 45°C before being collected. Cell lysis was performed as for the pulse SILAC experiment to produce the total cell lysate, supernatant and pellet fractions for Western blot analysis by loading 5% of TCL or supernatant (25μg) and 20% of pellet fractions with rabbit α-PGK1 (Acris AP21371AF-N; 1:10,000) followed by IRDye® 800CW goat α-rabbit IgG (LI-COR; 1:20,000), alongside with mouse α-HA tag (12CA5; 1:3000) then IRDye® 680RD goat α-Mouse IgG (LI-COR; 1:20,000) for Rpl12-HA and Arg1-HA, while Tpi1-HA and Hri1-HA were stripped in 2% (w/v) NaOH for 15 min and re-probed with mouse α-HA tag followed by IRDye® 800CW goat α-Mouse IgG (LI-COR; 1:20,000). Western blots were imaged with the LI-COR Odyssey® CLx imager and quantified with Image Studio.
Microscopy
For epifluorescence microscopy, cells were grown to mid-log phase (~OD600 = 0.6) in SD medium with low fluorescence yeast nitrogen base (LoFlo, Formedium) and 2% dextrose. Expression of the protein of interest was induced by addition of CuSO4 to the final concentration of 100μM for 10 minutes. 1mL of cultures were heat shocked in a thermomixer at 45°C for 15 minutes. Cells were subsequently collected by centrifugation in a microfuge at 6,000xg for 30 seconds. Live cells were resuspended in growth media before imaging with a Zeiss AxioObserver Z1 equipped with a 470nm and 590nm Colibri light sources and a 63 × 1.4 NA oil immersion DIC objective. Images were acquired and processed with the Zen 3.0 blue edition software.
Mass spectrometry
200μg of protein samples from pellet or total cell lysate fractions were cleaned up and trypsin digested using Single-Pot Solid-Phase-enhanced Sample Preparation (SP3) method as previously described (Hughes et al., 2019). The resulting peptides were desalted with high-capacity C18 (Phenomenex) STAGE Tips before an offline high pH reversed-phase chromatography fractionation as previously described (Udeshi et al., 2013). Fractions were collected at 2 minutes intervals. The resulting 40 fractions were pooled in a non-contiguous manner into 12 fractions per SILAC experiment. Each fraction was then dried in a Vacufuge plus (Eppendorf). Prior to mass spectrometry analysis each sample was resuspended in 0.1% formic acid with 2% acetonitrile in water. For the LiP experiment, 5μg of lysates treated with Proteinase K were mixed 1:1 with the medium labeled extract and subjected to SP3 method. A single fraction was analyzed per dilution of Proteinase K.
Mass spectrometry spectra were acquired on an Impact II (Bruker) on-line coupled to either an EASY-nLC 1000 (Thermo Scientific) or a nanoElute (Bruker) liquid chromatography (LC). The LC was equipped with a 2-cm-long, 100-μm-inner diameter trap column packed with 5 μm-diameter Aqua C-18 beads (Phenomenex) and a 40-cm-long, 50-μm-inner diameter fused silica analytical column packed with 1.9 μm-diameter Reprosil-Pur C-18-AQ beads (Dr. Maisch) and it was heated to 50°C using tape heater (SRMU020124, Omega.com and in-house build temperature controller). Buffer A consisted of 0.1% aqueous formic acid and 2% acetonitrile in water, and buffer B consisted of 0.1% formic acid in 90% acetonitrile. Samples were run with a 120 minutes gradient from 10% Buffer B to 17% Buffer B during the first 45 min, then Buffer B was increased to 35% by 90 min and to 80% at 95 min. The scanning range was from m/z 200 to 2000 Th. The Impact II was set to acquire in a data-dependent auto-MS/MS mode with inactive focus fragmenting the 20 most abundant ions (one at the time at 18 Hz rate) after each full-range scan from m/z 200 Th to m/z 2000 Th (at 5 Hz rate). The isolation window for MS/MS was 2 to 3 Th depending on parent ion mass to charge ratio and the collision energy ranged from 23 to 65 eV depending on ion mass and charge (Beck et al., 2015). Parent ions were then excluded from MS/MS for the next 0.3 min and reconsidered if their intensity increased more than 5 times. Singly charged ions were excluded since in ESI mode peptides usually carry multiple charges. Strict active exclusion was applied. Mass accuracy: error of mass measurement is typically within 5 ppm and is not allowed to exceed 10 ppm. The nano ESI source was operated at 1900 V capillary voltage, 0.25 Bar nanoBuster pressure with methanol in the nanoBooster, 3 L/min drying gas and 150°C drying temperature.
The results were analyzed against SGD_orf_trans_all_20150113 released from the Saccharomyces Genome Database (yeastgenome.org) using MaxQuant (version 1.6.14) with built-in common contaminants. The searches were done using the following parameters: multiplicity matching specific SILAC experiment design for Lys and Arg isotope type, trypsin enzyme specificity, fixed modifications - carbamidomethyl, variable modifications - methionine oxidation and N-acetyl peptides with default software instrument specific search settings, plus match-between-runs and re-quantification and an FDR set below 0.01. All raw proteomics data have been deposited to the ProteomeXchange Consortium through the PRIDE partner repository with the identifier PXD024336 for Experiments 1–3, and identifier PXD028934 for Experiment 1 supernatant fractions and the LiP experiment (Tables S1 and S3) (Deutsch et al., 2016; Vizcaíno et al., 2014).
Bioinformatics
Figures were generated in R and assembled in Adobe Illustrator (R Core Team, 2020). Analysis was carried out using in-house Perl scripts and statistical tests were performed in R. In all cases of non-binary data, p-values were obtained using the Mann-Whitney-Wilcoxon test in conjunction with the Hochberg procedure for multiple testing corrections to determine significance thresholds and reduce the false discovery rate (Bauer, 1972). GO analysis was done using gprofiler2 R package (Raudvere et al., 2019). Intrinsic protein disorder was calculated with DISOPRED3 (Jones and Cozzetto, 2015). Protein abundances were used from the integrated yeast proteome on PaxDb 4.0 (Wang et al., 2015). Protein half-life data was extracted from the study done by Christiano and colleague (Christiano et al., 2014). Secondary structure and solvent exposure calculations were performed using the SSpro8 and ACCpro programs in the SCRATCH-1D 1.1 package (Magnan and Baldi, 2014). GRAVY score was calculated with in-house scripts using previously derived parameters (Kyte and Doolittle, 1982). Aggregation prone patches were determined by TANGO software package (Linding et al., 2004). Yeast protein complex data was extracted from CYC2008 2.0 (Pu et al., 2008). Hsp70/Ssb and TRiC/CCT binding site data was extracted from the study done by Stein and colleague (Stein et al., 2019). Pfam domain information is from the Pfam website version 31.0. GO enrichment was done using DAVID (Huang et al., 2009a; 2009b). Contact order (CO) was calculated using a modified version of the Perl script provided by the Baker lab (Plaxco et al., 1998) which was run using PDB files downloaded from the AlphaFold database (Jumper et al., 2021; Varadi et al., 2022) associated with yeast Swissprot reviewed Uniprot entries (Consortium et al., 2021). To assess protein entanglements, the Protein Data Bank (Berman et al., 2002) was datamined to assign a single high-quality structures (less than 3Å resolution) that have maximal gene coverage (95% Identity score to canonical sequence determined by BLAST (Altschul et al., 1990)) to each gene in the ntSP, npCP, proteome. In total 1023 genes were assigned high quality PDB structures. Native lasso-like self-entanglements in each high-quality structure were found using the Gaussian linker integration method (Baiesi et al., 2019; Jiang et al., 2022; Nissley et al., 2022). All entanglements were reanalyzed a second time using the plane piercing method (Dabrowski-Tumanski et al., 2020) to remove any false entanglements due to incomplete loop closures in the Gaussian linker integration method. The degeneracy caused by multiple native contacts forming the same loop was removed by density based clustering on the native contacts and thread residues determined to be near the point of crossing the loop plane (i.e. crossing residues). Each gene in the ntSP, ntCP, and proteome sets were annotated as having self-entanglements present or not (Table S6). Confidence intervals for the fraction of genes that have entanglements present in a given set were computed from the 2.5 and 97.5 percentiles of an estimated population distribution generated with 100,000 basic bootstrapped iterations. Ascertaining statistical differences between each treatment and the control gene sets were done by permutation testing the difference 100,000 times and the final p-values were corrected using the false discovery rate Benjamini-Hochberg method. To further analyze secondary structure, DSSP calculations (Kabsch and Sander, 1983) were extracted from these files and to assess peptide solvent exposure solvent accessible surface area (SASA) calculations were performed in Pymol (The PyMOL Molecular Graphics System, Version 2.0 Schrödinger, LLC.) (Shrake and Rupley, 1973). The SASA was calculated on a per-residue basis and then summed for each peptide, then normalized by peptide length.
QUANTIFICATION AND STATISTICAL ANALYSIS
All mass spectrometry quantitation was performed using MaxQuant. p-values used in volcano plots were calculated using Student’s t-test. Pair-wised comparison and Pearson correlation were performed using R package GGally. For the feature analysis, Fisher test was used for Figures S5A, 6D, 6E and 7B, a permutation test was used in Figures 6C and 7D, and the Mann-Whitney-Wilcoxon test in the remaining panels in Figures 5, 6, 7, S5, and S6. Sample size for each protein group is indicated for each analysis in the figure panels. All p-values were corrected using the Hochberg procedure for multiple testing corrections and are listed in Table S4.
Supplementary Material
Highlights.
A subset of newly synthesized proteins is more thermo-sensitive
Newly translated and thermo-sensitive proteins share distinct features
Thermo-sensitive proteins have more β sheet and complex folding topology
Many abundant proteins are sensitive to aggregation until reaching the native state
ACKNOWLEDGMENTS
We thank Dr. Michael Knop for sharing the fluorescent timer protein plasmid, Dr. Eric Jan for support with labeling experiments, Dr. Khanh Dao Duc for analyzing codon usage, Jason Rogalski for mass spectrometry instrument maintenance, the laboratories of Drs. Measday and Hieter for sharing strains, and members of the Mayor laboratory for discussions. This work was supported by a grant from the Natural Sciences and Engineering Research Council of Canada (NSERC; 04248). Additional support was provided by the Canadian Institutes of Health Research (CIHR; PJT 148489), the National Institutes of Health (R35-GM124818)), and the National Science Foundation (MCB-1553291). T.M. is the recipient of Career Awards from the Michael Smith Foundation for Health Research, and M.Z. is the recipient of the Alexander Graham Bell Canada Graduate Scholarships-Doctoral and the Killam Scholarship.
Footnotes
SUPPLEMENTAL INFORMATION
Supplemental information can be found online at https://doi.org/10.1016/j.celrep.2022.111096.
DECLARATION OF INTERESTS
The authors declare no competing interests.
INCLUSION AND DIVERSITY
One or more of the authors of this paper self-identifies as an underrepresented ethnic minority in science. One or more of the authors of this paper self-identifies as a member of the LGBTQ+ community.
REFERENCES
- Agozzino L, and Dill KA, (2018). Protein evolution speed depends on its stability and abundance and on chaperone concentrations. Proc. Natl. Acad. Sci. USA 115, 9092–9097. 10.1073/pnas.1810194115. [DOI] [PMC free article] [PubMed] [Google Scholar]
- Altschul SF, Gish W, Miller W, Myers EW, and Lipman DJ, (1990). Basic local alignment search tool. J. Mol. Biol 215, 403–410. 10.1016/s0022-2836(05)80360-2. [DOI] [PubMed] [Google Scholar]
- Baiesi M, Orlandini E, Seno F, and Trovato A, (2019). Sequence and structural patterns detected in entangled proteins reveal the importance of co-translational folding. Sci. Rep 9, 8426. 10.1038/s41598-019-44928-3. [DOI] [PMC free article] [PubMed] [Google Scholar]
- Bauer DF, (1972). Constructing confidence sets using rank statistics. J. Am. Stat. Assoc 67, 687–690. 10.1080/01621459.1972.10481279. [DOI] [Google Scholar]
- Beck S, Michalski A, Raether O, Lubeck M, Kaspar S, Goedecke N, Baessmann C, Hornburg D, Meier F, Paron I, et al. (2015). The impact II, a very high-resolution quadrupole time-of-flight instrument (QTOF) for deep shotgun proteomics. Mol. Cell. Proteomics 14, 2014–2029. 10.1074/mcp.m114.047407. [DOI] [PMC free article] [PubMed] [Google Scholar]
- Berman HM, Battistuz T, Bhat TN, Bluhm WF, Bourne PE, Burkhardt K, Feng Z, Gilliland GL, lype L, Jain S, et al. (2002). The protein Data Bank. Acta Crystallogr. Sect. D Biol. Crystallogr 58, 899–907. 10.1107/s0907444902003451. [DOI] [PubMed] [Google Scholar]
- Bryngelson JD, Onuchic JN, Socci ND, and Wolynes PG, (1995). Funnels, pathways, and the energy landscape of protein folding: a synthesis. Proteins 21, 167–195. 10.1002/prot.340210302. [DOI] [PubMed] [Google Scholar]
- Chang H-C, Kaiser CM, Hartl FU, and Barral JM, (2005). De novo folding of GFP fusion proteins: high efficiency in eukaryotes but not in bacteria. J. Mol. Biol 353, 397–409. 10.1016/j.jmb.2005.08.052. [DOI] [PubMed] [Google Scholar]
- Christiano R, Nagaraj N, Fröhlich F, and Walther T, (2014). Global proteome turnover analyses of the yeasts S. cerevisiae and S. pombe. Cell Rep. 9, 1959–1965. 10.1016/j.celrep.2014.10.065. [DOI] [PMC free article] [PubMed] [Google Scholar]
- Consortium TU, Bateman A, Martin M-J, Orchard S, Magrane M, Agivetova R, Ahmad S, Alpi E, Bowler-Barnett EH, Britto RB, et al. (2021). UniProt: the universal protein knowledgebase in 2021. Nucleic Acids Res. 49, D480–D489. 10.1093/nar/gkaa1100. [DOI] [PMC free article] [PubMed] [Google Scholar]
- Cooper AA, Gitler AD, Cashikar A, Haynes CM, Hill KJ, Bhullar B, Liu K, Xu K, Strathearn KE, Liu F, et al. (2006). Alpha-synuclein blocks ER-Golgi traffic and Rab1 rescues neuron loss in Parkinson’s models. Science 313, 324–328. 10.1126/science.1129462. [DOI] [PMC free article] [PubMed] [Google Scholar]
- Dabrowski-Tumanski P, Rubach P, Niemyska W, Gren BA, and Sulkowska JI, (2020). Topoly: Python package to analyze topology of polymers. Brief. Bioinform 22, bbaa196. 10.1093/bib/bbaa196. [DOI] [PMC free article] [PubMed] [Google Scholar]
- Deuerling E, Gamerdinger M, and Kreft SG, (2019). Chaperone interactions at the ribosome. Cold Spring Harb. Perspect. Biol 11, a033977. 10.1101/cshperspect.a033977. [DOI] [PMC free article] [PubMed] [Google Scholar]
- Deutsch EW, Csordas A, Sun Z, Jarnuczak A, Perez-Riverol Y, Ternent T, Campbell DS, Bernal-Llinares M, Okuda S, Kawano S, et al. (2016). The ProteomeXchange consortium in 2017: supporting the cultural change in proteomics public data deposition. Nucleic Acids Res. 45, D1100–D1106. 10.1093/nar/gkw936. [DOI] [PMC free article] [PubMed] [Google Scholar]
- Döring K, Ahmed N, Riemer T, Suresh HG, Vainshtein Y, Habich M, Riemer J, Mayer MP, O’Brien EP, Kramer G, and Bukau B, (2017). Profiling ssb-nascent chain interactions reveals principles of Hsp70-assisted folding. Cell 170, 298–311.e20. 10.1016/j.cell.2017.06.038. [DOI] [PMC free article] [PubMed] [Google Scholar]
- Drummond DA, Bloom JD, Adami C, Wilke CO, and Arnold FH, (2005). Why highly expressed proteins evolve slowly. Proc. Natl. Acad. Sci. USA 102, 14338–14343. 10.1073/pnas.0504070102. [DOI] [PMC free article] [PubMed] [Google Scholar]
- Duttler S, Pechmann S, and Frydman J, (2013). Principles of cotranslational ubiquitination and quality control at the ribosome. Mol. Cell 50, 379–393. 10.1016/j.molcel.2013.03.010. [DOI] [PMC free article] [PubMed] [Google Scholar]
- Ellis RJ, and Minton AP, (2006). Protein aggregation in crowded environments. Biol. Chem 387, 485–497. 10.1515/bc.2006.064. [DOI] [PubMed] [Google Scholar]
- Fan J-Q, Ishii S, Asano N, and Suzuki Y, (1999). Accelerated transport and maturation of lysosomal α–galactosidase A in Fabry lymphoblasts by an enzyme inhibitor. Nat. Med 5, 112–115. 10.1038/4801. [DOI] [PubMed] [Google Scholar]
- Gershenson A, Gierasch LM, Pastore A, and Radford SE, (2014). Energy landscapes of functional proteins are inherently risky. Nat. Chem. Biol 10, 884–891. 10.1038/nchembio.1670. [DOI] [PMC free article] [PubMed] [Google Scholar]
- Gsponer J, Futschik ME, Teichmann SA, and Babu MM, (2008). Tight regulation of unstructured proteins: from transcript synthesisto protein degradation. Science 322, 1365–1368. 10.1126/science.1163581. [DOI] [PMC free article] [PubMed] [Google Scholar]
- Hammarström P, Wiseman RL, Powers ET, and Kelly JW, (2003). Prevention of transthyretin amyloid disease by changing protein misfolding energetics. Science 299, 713–716. 10.1126/science.1079589. [DOI] [PubMed] [Google Scholar]
- Hartl FU, Bracher A, and Hayer-Hartl M, (2011). Molecular chaperones in protein folding and proteostasis. Nature 475, 324–332. 10.1038/nature10317. [DOI] [PubMed] [Google Scholar]
- Hipp MS, Kasturi P, and Hartl FU, (2019). The proteostasis networkand its decline in ageing. Nat. Rev. Mol. Cell Biol 20, 421–435. 10.1038/s41580-019-0101-y. [DOI] [PubMed] [Google Scholar]
- Huang DW, Sherman BT, and Lempicki RA, (2009a). Systematic and integrative analysis of large gene lists using DAVID bioinformatics resources. Nat. Protoc 4, 44–57. 10.1038/nprot.2008.211. [DOI] [PubMed] [Google Scholar]
- Huang DW, Sherman BT, and Lempicki RA, (2009b). Bioinformatics enrichment tools: paths toward the comprehensive functional analysis of large gene lists. Nucleic Acids Res. 37, 1–13. 10.1093/nar/gkn923. [DOI] [PMC free article] [PubMed] [Google Scholar]
- Hughes CS, Moggridge S, Müller T, Sorensen PH, Morin GB, and Krijgsveld J (2019). Single-pot, solid-phase-enhanced sample preparation for proteomics experiments. Nat. Protoc 14, 68–85. 10.1038/s41596-018-0082-x. [DOI] [PubMed] [Google Scholar]
- Jain S, Wheeler J, Walters R, Agrawal A, Barsic A, and Parker R, (2016). ATPase-modulated stress granules contain a diverse proteome and substructure. Cell 164, 487–498. 10.1016/j.cell.2015.12.038. [DOI] [PMC free article] [PubMed] [Google Scholar]
- Jiang Y, Neti SS, Sitarik I, Pradhan P, To P, Xia Y, Fried SD, Booker SJ, and O’Brien EP, (2022). How synonymous mutations alter enzyme structure and function over long time scales. Preprint at bioRxiv. 10.1101/2021.08.18.456802. [DOI] [PMC free article] [PubMed] [Google Scholar]
- Jones DT, and Cozzetto D, (2015). DISOPRED3: precise disordered region predictions with annotated protein-binding activity. Bioinformatics 31, 857–863. 10.1093/bioinformatics/btu744. [DOI] [PMC free article] [PubMed] [Google Scholar]
- Jumper J, Evans R, Pritzel A, Green T, Figurnov M, Ronneberger O, Tunyasuvunakool K, Bates R, Židek A, Potapenko A, et al. (2021). Highly accurate protein structure prediction with AlphaFold. Nature 596, 583–589. 10.1038/s41586-021-03819-2. [DOI] [PMC free article] [PubMed] [Google Scholar]
- Kabsch W, and Sander C (1983). Dictionary of protein secondary structure: pattern recognition of hydrogen-bonded and geometrical features. Biopolymers 22, 2577–2637. 10.1002/bip.360221211. [DOI] [PubMed] [Google Scholar]
- Khmelinskii A, Keller PJ, Bartosik A, Meurer M, Barry JD, Mardin BR, Kaufmann A, Trautmann S, Wachsmuth M, Pereira G, et al. (2012). Tandem fluorescent protein timers for in vivo analysis of protein dynamics. Nat. Biotechnol 30, 708–714. 10.1038/nbt.2281. [DOI] [PubMed] [Google Scholar]
- Kubelka J, Hofrichter J, and Eaton WA (2004). The protein folding ‘speed limit. Curr. Opin. Struct. Biol 14, 76–88. 10.1016/j.sbi.2004.01.013. [DOI] [PubMed] [Google Scholar]
- Kuechler ER, Budzyńska PM, Bernardini JP, Gsponer J, and Mayor T, (2020). Distinct features of stress granule proteins predict localization in membraneless organelles. J. Mol. Biol 432, 2349–2368. 10.1016/j.jmb.2020.02.020. [DOI] [PubMed] [Google Scholar]
- Kuechler ER, Jacobson M, Mayor T, and Gsponer J, (2022). GraPES: the granule protein enrichment server for prediction of biological condensate constituents. Nucleic Acids Res, gkac279. 10.1093/nar/gkac279. [DOI] [PMC free article] [PubMed] [Google Scholar]
- Kyte J, and Doolittle RF (1982). A simple method for displaying the hydropathic character of a protein. J. Mol. Biol 157, 105–132. 10.1016/0022-2836(82)90515-0. [DOI] [PubMed] [Google Scholar]
- Linding R, Schymkowitz J, Rousseau F, Diella F, and Serrano L, (2004). A comparative study of the relationship between protein structure and β-aggregation in globular and intrinsically disordered proteins. J. Mol. Biol 342, 345–353. 10.1016/j.jmb.2004.06.088. [DOI] [PubMed] [Google Scholar]
- Magnan CN, and Baldi P, (2014). SSpro/ACCpro 5: almost perfect prediction of protein secondary structure and relative solvent accessibility using profiles, machine learning and structural similarity. Bioinformatics 30,2592–2597. 10.1093/bioinformatics/btu352. [DOI] [PMC free article] [PubMed] [Google Scholar]
- McKenzie SL, Henikoff S, and Meselson M, (1975). Localization of RNA from heat-induced polysomes at puff sites in Drosophila melanogaster. Proc. Natl. Acad. Sci. USA 72, 1117–1121. 10.1073/pnas.72.3.1117. [DOI] [PMC free article] [PubMed] [Google Scholar]
- Mönkemeyer L, Klaips CL, Balchin D, Körner R, Hartl FU, and Bracher A, (2019). Chaperone function of Hgh1 in the biogenesis of eukaryotic elongation factor 2. Mol. Cell 74, 88–100.e9. 10.1016/j.molcel.2019.01.034. [DOI] [PubMed] [Google Scholar]
- Morimoto RI, and Cuervo AM, (2014). Proteostasis and the aging proteome in Health and disease. J. Gerontol. A Biol. Sci. Med. Sci 69, S33–S38. 10.1093/gerona/glu049. [DOI] [PMC free article] [PubMed] [Google Scholar]
- Nguyen AT, Prado MA, Schmidt PJ, Sendamarai AK, Wilson-Grady JT, Min M, Campagna DR, Tian G, Shi Y, Dederer V, et al. (2017). UBE2O remodels the proteome during terminal erythroid differentiation. Science 357, eaan0218. 10.1126/science.aan0218. [DOI] [PMC free article] [PubMed] [Google Scholar]
- Nissley D, Jiang Y, Trovato F, Sitarik I, Narayan K, To P, Xia Y, Fried SD, and O’Brien EP, (2022). Universal protein misfolding intermediates can bypass the proteostasis network and remain soluble and less functional. Preprint at bioRxiv. 10.1101/2021.08.18.456613. [DOI] [PMC free article] [PubMed] [Google Scholar]
- Olzscha H, Schermann SM, Woerner AC, Pinkert S, Hecht MH, Tartaglia GG, Vendruscolo M, Hayer-Hartl M, Hartl FU, and Vabulas RM, (2011). Amyloid-like aggregates sequester numerous metastable proteins with essential cellular functions. Cell 144, 67–78. 10.1016/j.cell.2010.11.050. [DOI] [PubMed] [Google Scholar]
- Park S-H, Kukushkin Y, Gupta R, Chen T, Konagai A, Hipp M, Hayer-Hartl M, and Hartl F, (2013). PolyQ proteins interfere with nuclear degradation of cytosolic proteins by sequestering the Sis1p chaperone. Cell 154, 134–145. 10.1016/j.cell.2013.06.003. [DOI] [PubMed] [Google Scholar]
- Plaxco KW, Simons KT, and Baker D, (1998). Contact order, transition state placement and the refolding rates of single domain proteins. J. Mol. Biol 277, 985–994. 10.1006/jmbi.1998.1645. [DOI] [PubMed] [Google Scholar]
- Pu S, Wong J, Turner B, Cho E, and Wodak SJ, (2008). Up-to-date catalogues of yeast protein complexes. Nucleic Acids Res. 37, 825–831. 10.1093/nar/gkn1005. [DOI] [PMC free article] [PubMed] [Google Scholar]
- Raudvere U, Kolberg L, Kuzmin I, Arak T, Adler P, Peterson H, and Vilo J (2019). g:Profiler: a web server for functional enrichment analysis and conversions of gene lists (2019 update). Nucleic Acids Res. 47, W191–W198. 10.1093/nar/gkz369. [DOI] [PMC free article] [PubMed] [Google Scholar]
- Sammons MA, Samir P, and Link AJ (2011). Saccharomyces cerevisiae Gis2 interacts with the translation machinery and is orthogonal to myotonic dystrophy type 2 protein ZNF9. Biochem. Biophys. Res. Commun 406, 13–19. 10.1016/j.bbrc.2011.01.086. [DOI] [PubMed] [Google Scholar]
- Scazzari M, Amm I, and Wolf DH, (2015). Quality control of a cytoplasmic protein complex chaperone motors and the ubiquitin-proteasome system govern the fate of orphan fatty acid synthase subunit Fas2 of yeast. J. Biol. Chem 290, 4677–4687. 10.1074/jbc.m114.596064. [DOI] [PMC free article] [PubMed] [Google Scholar]
- Schopf FH, Huber EM, Dodt C, Lopez A, Biebl MM, Rutz DA, Mühlhofer M, Richter G, Madl T, Sattler M, et al. (2019). The Co-chaperone Cns1 and the recruiter protein Hgh1 link Hsp90 to translation elongation via chaperoning elongation factor 2. Mol. Cell 74,73–87.e8. 10.1016/j.molcel.2019.02.011. [DOI] [PubMed] [Google Scholar]
- Shalgi R, Hurt J, Krykbaeva I, Taipale M, Lindquist S, and Burge C (2013). Widespread regulation of translation by elongation pausing in heat shock. Mol. Cell 49, 439–452. 10.1016/j.molcel.2012.11.028. [DOI] [PMC free article] [PubMed] [Google Scholar]
- Shen K, Gamerdinger M, Chan R, Gense K, Martin EM, Sachs N, Knight PD, Schlömer R, Calabrese AN, Stewart KL, et al. (2019). Dual role of ribosome-binding domain of NAC as a potent suppressor of protein aggregation and aging-related proteinopathies. Mol. Cell 74,729–741.e7. 10.1016/j.molcel.2019.03.012. [DOI] [PMC free article] [PubMed] [Google Scholar]
- Shiber A, Döring K, Friedrich U, Klann K, Merker D, Zedan M, Tipp-mann F, Kramer G, and Bukau B, (2018). Cotranslational assembly of protein complexes in eukaryotes revealed by ribosome profiling. Nature 561, 268–272. 10.1038/s41586-018-0462-y. [DOI] [PMC free article] [PubMed] [Google Scholar]
- Shrake A, and Rupley JA (1973). Environment and exposure to solvent of protein atoms. Lysozyme and insulin. J. Mol. Biol 79, 351–371. 10.1016/0022-2836(73)90011-9. [DOI] [PubMed] [Google Scholar]
- Stein KC, Kriel A, and Frydman J, (2019). Nascent polypeptide domain topology and elongation rate direct the cotranslational hierarchy of Hsp70 and TRiC/CCT. Mol. Cell 75, 1117–1130.e5. 10.1016/j.molcel.2019.06.036. [DOI] [PMC free article] [PubMed] [Google Scholar]
- Sulkowska JI, (2020). On folding of entangled proteins: knots, lassos, links and θ-curves. Curr. Opin. Struct. Biol 60, 131–141. 10.1016/j.sbi.2020.01.007. [DOI] [PubMed] [Google Scholar]
- Sung M-K, Porras-Yakushi TR, Reitsma JM, Huber FM, Sweredoski MJ, Hoelz A, Hess S, and Deshaies RJ (2016). A conserved quality-control pathway that mediates degradation of unassembled ribosomal proteins. Elife 5, e19105. 10.7554/elife.19105. [DOI] [PMC free article] [PubMed] [Google Scholar]
- R Core Team (2020). R: A Language and Environment for Statistical Computing (R Foundation for Statistical Computing; ). [Google Scholar]
- Udeshi ND, Mertins P, Svinkina T, and Carr SA, (2013). Large-scale identification of ubiquitination sites by mass spectrometry. Nat. Protoc 8, 1950–1960. 10.1038/nprot.2013.120. [DOI] [PMC free article] [PubMed] [Google Scholar]
- Varadi M, Anyango S, Deshpande M, Nair S, Natassia C, Yordanova G, Yuan D, Stroe O, Wood G, Laydon A, et al. (2022). AlphaFold Protein Structure Database: massively expanding the structural coverage of protein-sequence space with high-accuracy models. Nucleic Acids Res. 50, D439–D444. 10.1093/nar/gkab1061. [DOI] [PMC free article] [PubMed] [Google Scholar]
- Vizcaíno JA, Deutsch EW, Wang R, Csordas A, Reisinger F, Ríos D, Dianes JA, Sun Z, Farrah T, Bandeira N, et al. (2014). ProteomeXchange provides globally coordinated proteomics data submission and dissemination. Nat. Biotechnol 32, 223–226. 10.1038/nbt.2839. [DOI] [PMC free article] [PubMed] [Google Scholar]
- Wallace E, Kear-Scott J, Pilipenko E, Schwartz M, Laskowski P, Rojek A, Katanski C, Riback J, Dion M, Franks A, et al. (2015). Reversible, specific, active aggregates of endogenous proteins assemble upon heat stress. Cell 162, 1286–1298. 10.1016/j.cell.2015.08.041. [DOI] [PMC free article] [PubMed] [Google Scholar]
- Wang M, Herrmann CJ, Simonovic M, Szklarczyk D, and Mering C, (2015). Version 4.0 of PaxDb: protein abundance data, integrated across model organisms, tissues, and cell-lines. Proteomics 15, 3163–3168. 10.1002/pmic.201400441. [DOI] [PMC free article] [PubMed] [Google Scholar]
- Wiedmann B, Sakai H, Davis TA, and Wiedmann M, (1994). A protein complex required for signal-sequence-specific sorting and translocation. Nature 370, 434–440. 10.1038/370434a0. [DOI] [PubMed] [Google Scholar]
- Willmund F, del Alamo M, Pechmann S, Chen T, Albanèse V, Dammer E, Peng J, and Frydman J, (2013). The cotranslational function of ribosome-associated Hsp70 in eukaryotic protein homeostasis. Cell 152, 196–209. 10.1016/j.cell.2012.12.001. [DOI] [PMC free article] [PubMed] [Google Scholar]
- Woolford JL, and Baserga SJ (2013). Ribosome biogenesis in the yeast Saccharomyces cerevisiae. Genetics 195, 643–681. 10.1534/genetics.113.153197. [DOI] [PMC free article] [PubMed] [Google Scholar]
- Yanagitani K, Juszkiewicz S, and Hegde RS (2017). UBE2O is a quality control factor for orphans of multiprotein complexes. Science 357, 472–475. 10.1126/science.aan0178. [DOI] [PMC free article] [PubMed] [Google Scholar]
- Zhu M, Kuechler ER, Zhang J, Matalon O, Dubreuil B, Hofmann A, Loewen C, Levy ED, Gsponer J, and Mayor T, (2020). Proteomic analysis revealsthe direct recruitment of intrinsically disordered regionsto stress granules in S. cerevisiae. J. Cell Sci 133, jcs244657. 10.1242/jcs.244657. [DOI] [PubMed] [Google Scholar]
Associated Data
This section collects any data citations, data availability statements, or supplementary materials included in this article.
Supplementary Materials
Data Availability Statement
All Raw proteomic data are deposited in the PRIDE repository from the ProteomeXchange Consortium (PXD024336 and PXD028934).
All original code is publicly available and has been deposited at Zenodo. DOIs are listed in the key resources table.
Any additional information required to reanalyze the data reported in this study is available from the lead contact upon request.
KEY RESOURCES TABLE
| REAGENT or RESOURCE | SOURCE | IDENTIFIER |
|---|---|---|
| Antibodies | ||
| Mouse Monoclonal Anti-HA | AbLab | Cat# 12CA5 |
| Rabbit Polyclonal Anti-Pgk1 | Acris | Cat# AP21371AF-N |
| IRDye® 800CW Goat Anti-Mouse IgG | LI-COR | Cat# 926-32210 |
| IRDye® 800CW Goat Anti-Rabbit IgG | LI-COR | Cat# 926-32211 |
| Bacterial and virus strains | ||
| NEB5α Competent E. coli | NEB | Cat# C2987I |
| Chemicals, peptides, and recombinant proteins | ||
| Difco™ Yeast Nitrogen Base without Amino Acids | BD Life Sciences | Cat# 291940 |
| 13C6 Arg-6 | Silantes | Cat# 201204102 |
| 13C6 15N4 Arg-10 | Silantes | Cat# 201604102 |
| D4 Lys-4 | Silantes | Cat# 211104113 |
| 13C6 15N2 Lys-8 | Silantes | Cat# 211604102 |
| IGEPAL® CA-630 (NP-40) | Sigma-Aldrich | Cat# I3021-100ML |
| Phenylmethylsulfonyl fluoride (PMSF) | Roche | Cat# 1359061 |
| cOmplete™, EDTA-free Protease Inhibitor Cocktail (PIC) | Roche | Cat# 5056489001 |
| Proteinase K | SIGMA | Cat# P2308-100MG |
| SigmaUltra Iodoacetamide | Sigma-Aldrich | Cat# I1149 |
| Tris-(2-carboxyethyl)phosphine (TCEP) | Gold Biotechnology | Cat# TCEP25 |
| Sequencing Grade Modified Trypsin, Frozen | Promega | Cat# V5113 |
| Sera-Mag™ SpeedBead Carboxylate-Modified [E7] Magnetic Particles | GE Healthcare | Cat# 45152105050250 |
| Sera-Mag™ SpeedBead Carboxylate-Modified [E3] Magnetic Particles | GE Healthcare | Cat# 65152105050250 |
| LoFlo Medium | Formedium | Cat# CYN6502 |
| Critical commercial assays | ||
| GeneJET Genomic DNA Purification Kit | Thermo Scientific | Cat# K0722 |
| GeneJET Plasmid Miniprep Kit | Thermo Scientific | Cat# K0502 |
| GenCatch™ PCR Cleanup Kit | Epoch Life Science | Cat# 2360250 |
| Pierce™ BCA Protein Assay Kit | Thermo Scientific | Cat# 23225 |
| Gibson Assembly Master Mix | NEB | Cat# E2611L |
| Deposited data | ||
| Mass spectrometry results of pellet and total cell lysate fractions for Experiments 1-3 | This paper, PRoteomics IDEntification (PRIDE) repository | PXD024336 |
| Mass spectrometry results of supernatant fractions of Experiment 1 and the LiP experiment | This paper, PRoteomics IDEntification (PRIDE) repository | PXD028934 |
| Codes used for the bulk of the feature analysis in Figures 5, 6 and 7 | This paper | https://doi.org/10.5281/zenodo.6640632 |
| Codes used for the number of pfam domains (Figure S5A), contact order (Figure 6B) and SASA analysis (Figure 7E) | This paper | https://doi.org/10.5281/zenodo.6639064 |
| Code and data set for the analysis of native lasso-like self-entanglements (Figures 6C and 7F) | This paper | https://doi.org/10.5281/zenodo.6642237 |
| Experimental models: Organisms/strains | ||
| BY4741 strains (MATa, his3Δ1, leu2Δ0, met15Δ0, ura3Δ0) | Hieter lab | YTM408 |
| SILAC strain (MATa, his3Δ1, leu2Δ0, ura3Δ0, MET15, arg4Δ::KanMX6, lys2Δ0) | Measday lab | YTM1173 |
| Oligonucleotides | ||
| Oligonucleotides, See Table S5 | This paper | n/a |
| Recombinant DNA | ||
| pRS316-CUP1p-mCherry-sfGFP-ADH1t | This paper | BPM1455 |
| pRS316-CUP1p-RPL12B-mCherry-sfGFP-ADH1t | This paper | BPM1761 |
| pRS316-CUP1p-OLA1-mCherry-sfGFP-ADH1t | This paper | BPM1762 |
| pRS426-GAL1p-3HA-CYC1t | This paper | BPM1809 |
| pRS426-GAL1p-TPI1-3HA-CYC1t | This paper | BPM1819 |
| pRS426-GAL1p-HRI1-3HA-CYC1t | This paper | BPM1820 |
| pRS426-GAL1p-RPL12A-3HA-CYC1t | This paper | BPM1822 |
| pRS426-GAL1p-ARG1-3HA-CYC1t | This paper | BPM1823 |
| Software and algorithms | ||
| Bruker Compass HyStar 5.0 SR1 | Bruker Daltonics | Ver. 5.0.37.0 |
| MaxQuant | Computational Systems Biochemistry under Prof. Jürgen Cox | 1.6.14 |
| Zen 3.0 | Zeiss | n/a |
| Illustrator | Adobe Creative | n/a |
| Image Studio | LI-COR | Ver. 2.1 |