Abstract
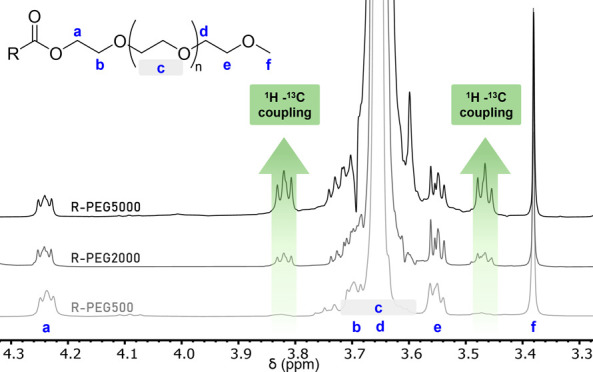
The molecular weight, purity, and functionalization of polyethylene glycols are often characterized by 1H NMR spectroscopy. Oft-forgotten, the typical 1H NMR pulse sequence is not 13C decoupled. Hence, for large polymers, the 13C coupled 1H peaks arising from the repeating units have integrations comparable to that of the 1H of the terminal groups. Ignoring this coupling leads to erroneous assignments. Once correctly assigned, these 13C coupled 1H peaks can be used to determine both the molecular weight of the polymer and the efficacy of conjugation of a terminal moiety more accurately than the uncoupled 1H of the repeating unit.
Introduction
Polyethylene glycols (PEG) are commonly used for the functionalization of biomacromolecules and nanoparticles because their high hydrophilicity increases the dispersion of their cargo in physiological media. Their stability in the serum and low immunogenicity are also key to their numerous biomedical applications, including several that are FDA approved.1,2 To increase their dispersion in biological media, metal and metal oxide nanoparticles are typically coated with either PEG or poly(ethylene glycol) methyl ether (mPEG) of molecular weights ranging between 2000 and 5000 g/mol.3−5 The length of the polymer and the density of the coating affects both the physical properties (e.g., relaxivity)6 and biological properties (e.g., cell uptake)7 of the nanoparticles. A chemical anchor is required to increase the density of PEG on nanoparticles. This anchoring is typically achieved via a functional group appropriate for the nanoparticle, following well-established coordination chemistry rules of hard and soft acids and bases. Because gold is a soft metal, gold nanoparticles are best coated with thiol-terminated PEGs. Hard ligands, such as phosphonate and catecholates, are best suited for iron oxide nanoparticles that typically consist of iron(III) or mixtures of iron(III) and iron(II).8 Dual imaging modality or drug delivery can often be achieved by conjugating either a luminescent probe or a drug to the second solvent-exposed end of the PEG. The synthesis of such bifunctional PEG requires orthogonal conjugation chemistries that are now well established.9−11
Best practices for nanoparticle functionalization require using mono- or difunctionalized PEGs that are pure. It is thus important to quantify the amount of functional groups per PEG polymer and to identify the presence and ratio of any unfunctionalized PEGs, where one or both terminal groups are hydroxyl moieties (Figure 1). Of the different polymer characterization techniques, size exclusion chromatography (SEC) is often ill-suited for such application because conjugation of an anchoring moiety, often a small thiol or phosphonate group, results in minor changes in the molecular weight of the macromolecule. Characterization of modified PEGs can rely on either mass-spectrometry techniques, such as electron spray ionization (ESI MS) or matrix-assisted laser desorption ionization (MALDI), or 1H nuclear magnetic resonance spectroscopy (1H NMR). ESI MS is best suited for m/z < 1,000, characterization of larger PEGs, used for nanoparticle functionalization, and often rely on multiple charged PEGs that carry multiple H+, Na+, and/or K+ ions. Because PEGs have a good affinity for alkali ions,12,13 the presence of multiple ion complexes for each m/z can render ESI MS characterization cumbersome. As such, this technique does not necessarily enable accurate and quantitative determination of the presence of unreacted PEGs.
Figure 1.
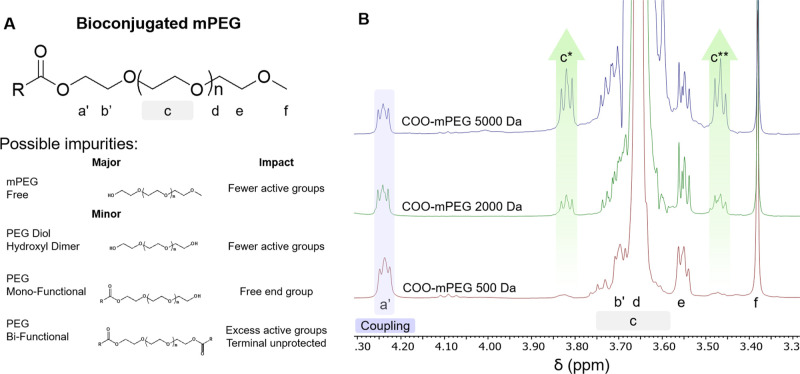
Importance of purity of a bioconjugated mPEG product. (A) Pure bioconjugate mPEG and possible impurities from side reactions and manufacturers. (B) 1H NMR spectra at 400 MHz, normalized to tetramethyl silane of ester bioconjugated mPEG 500, 2000, and 5000 Da. 1H–13C coupling is observed, peaks c* (δ = 3.82 ppm) and c** (δ = 3.47 ppm), which increase with the number of repeating units. Ester bioconjugation or ‘coupling’ peak is observed (δ = 4.28 ppm). Functional group labels refer to that in the chemical structure shown in A.
The most common practice is thus to characterize PEG functionalization with small anchoring moieties by 1H NMR.14−18 Unfortunately, many published 1H NMR of functionalized PEGs are incorrectly analyzed without taking into consideration the 13C–1H coupling, which leads to erroneous peak assignments and incorrect quantification of PEG functionalization. Herein, we walk the reader through correct interpretation of 1H NMR spectra of functionalized PEG.
Results and Discussion
Correct Assignment of 1H NMR Spectra of Functionalized Poly(ethylene glycol) Polymers
Carbon satellite peaks observed in 1H NMR spectra are due to the 1.1% natural abundance of 13C, an NMR active nucleus with spin 1/2 that couples with directly bonded non-equivalent 1H nuclei, splitting the 1H peak. The remaining 98.9% is 12C, which is NMR inactive, and does not couple to 1H. Carbon satellite peaks are frequently observed in spectra of polymers as the signals from the repeated units overlap to form large peaks. For the 1.1% of 1H nuclei, which are adjacent to a 13C, that signal is split into a doublet centered and evenly spaced on either side of the main peak. Oft-forgotten, the pulse sequence typically used for 1-dimensional 1H NMR spectroscopy is not 13C decoupled. Given the gyromagnetic ratio of 13C, this splitting results in two smaller peaks that are 115–140 Hz apart for a sp3-hybridized C. Each of those side peaks has an integration of 0.55% of the main peak. For most small molecules, this splitting is within the baseline and is usually ignored when visible. However, the 1H–13C coupling can become significant when analyzing functionalization of large polymers such as PEG with one functionalized terminal group given that the ratio of the terminal group to repeating polymer unit is typically to 2 to 0.9% (for 2000 and 5000 g/mol PEG, respectively). For a 5000 g/mol PEG, the integration of the 1H signal of a CH2 from the terminal (functionalized) group, as shown in Figure 1B (e, δ = 3.55 ppm), is thus close to that of the side bands due to the 1H–13C coupling of the repeating CH2–CH2–O unit (c**, δ = 3.46 ppm). Because they also have a similar chemical shift, researchers may erroneously assign the signal of the CH2 of the terminal group to 1H–13C coupling peaks of the PEG (peaks c* and c** in Figure 1B) and consequently misjudge the purity of the polymer and conjugation efficacy.
The significance of the 1H–13C coupling on the interpretation of one-dimensional 1H NMR spectra is exemplified in spectra of mPEG of different molecular weights in deuterated chloroform. The chemical structure of mPEG and the labels used in this discussion are shown in Figure 2A. Note that mPEG is terminated with an alcohol on one end and a methyl group on the other. In the absence of 1H–13C coupling, these polymers would be anticipated to display six signals in their 1H NMR spectra: the a, b, d, and e O–CH2 protons would each be triplets, whereas c would be a broad peak and f would be a singlet. Experimental 1H NMR spectra of 5 mPEGs of different molecular weights (500, 1000, 2000, 5000, and 10000) are shown in Figure 2B. A potential pitfall is to assign the leftmost triplet (δ = 3.82 ppm) to protons a, the small triplet right-adjacent to the right to the major peak (δ = 3.55 ppm) as those of protons b, and the rightmost triplet in Figure 2B to the major peak (δ = 3.47 ppm) to protons e. Alternatively, the triplets adjacent to the left (δ = 3.82 ppm) and right (δ = 3.47 ppm) of the major peaks have also been assigned to protons b and d. Such assignments1,15−18 are, however, incorrect.
Figure 2.
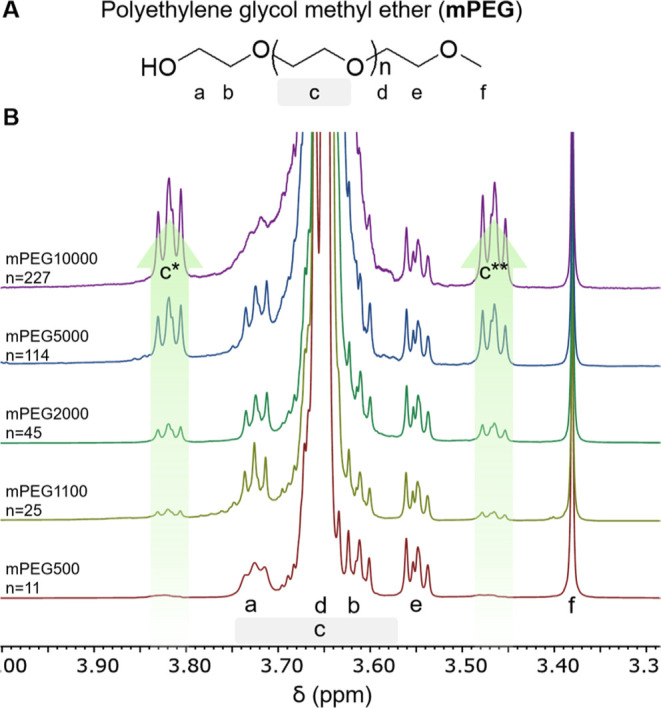
mPEG by MW (A). Chemical structure of mPEG with end groups and main polymer block protons labeled for reference. (B). 1H NMR spectra (400 MHz, CDCl3) normalized to tetramethyl silane stack of mPEGs with MW from 500 to 10000 Da. The integration of the 1H – 13C coupling peaks c* (δ = 3.82 ppm) and c** (δ = 3.47 ppm) increase with MW but resolution of peaks a and b from peak c decrease.
As shown in Figure 2, the integration of the peaks c* and c** both increase with increasing PEG molecular weight. Central peak c, which corresponds to the repeating monomer, broadens and eventually overlap with triplets a and b as the molecular weight of the polymer increases. This is to be expected because transverse relaxation time, and thus line broadening, increases with increasing rotational correlation time and polymer size. Those two peaks at 3.47 and 3.82 ppm, whose integration relative to the singlet of the protons f at 3.37 ppm increases with increasing PEG MW, are not due to impurities. They are the results of 1H–13C coupling of the naturally occurring 1.1% 13C1H2–O protons of the polymer repeating unit. This 1H–13C coupling contains other signature elements in 1H NMR spectra. For PEG, 1H–13C coupling creates two identical peaks positioned at ±70 Hz from the central peak. Because the two side peaks correspond to 13C1H2, whereas the central peak corresponds to 12C1H2, the integrations of the two side peaks always add up to 1.1% that of the central peak, in accordance with the naturally occurring ratio of 13C. Lastly, the splitting pattern of each 1H–13C coupled peak, which arises from 1H–1H coupling, is identical to that of the central 12C1H2 peak. As can be seen in Figure 2, for large polymers of 5000 or 10,000 g/mol, these side peaks arising from 1H–13C coupling (c* and c**) have a similar integration to the CH3 protons of the terminal methyl group. Their ratio can be calculated from eq 1 as shown below.
| 1 |
Coupling constants (J), unlike chemical shifts, are measured in Hz. Their values, in Hz, are independent of the magnetic field of a NMR spectrometer. Therefore, their chemical shift (δ) will vary with a magnetic field. As demonstrated by Harrel, side peaks due to 1H–13C couplings can be distinguished from peaks arising from chemical impurities by taking spectra at two different magnetic fields.17 This is exemplified with 1H NMR spectra of a 2000 MW mPEG measured at 400 and 600 MHz, shown in Figure 3. Regardless of the magnetic field, the 13C–1H-coupled peaks of CH2–O (c* and c**) are always 70 Hz upfield and downfield from the main peak. At 600 MHz, this translates to a difference of ±0.12 ppm; this difference is greater ( ±0.19 ppm) at a lower magnetic field (400 MHz). Alternatively, if one uses a 13C–1H-decoupled pulse sequence (Figure 3C), peaks c* and c** disappear.
Figure 3.
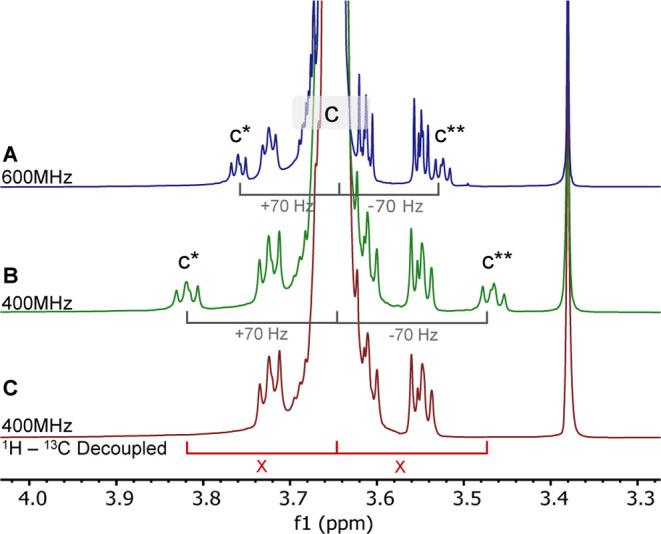
Effects of 1H–13C coupling in 1H NMR spectra of mPEG 2000 Da. Refer back to Figure 1 for labeling (A). 600 MHz 1H NMR spectra—c* (δ = 3.76 ppm) and c**(δ = 3.53 ppm) peaks are ±0.115 ppm (±70 Hz) from the c peak. (B). 400 MHz 1H NMR spectra c* (δ = 3.82 ppm) and c** (δ = 3.47 ppm) peaks are ±0.175 ppm (±70 Hz) from the c peak. NMR spectra are normalized to tetramethyl silane. (C). 1H–13C decoupled spectra—c* and c** peaks are no longer present.
Taking the above into consideration, correct 1H NMR assignments for PEG, mPEG, and a typical ester-functionalized mPEG are shown in Figure 4. In the case of mPEG, the triplet corresponding to the terminal CH2–O group (labeled e) appears at 3.56 ppm while that of the terminal CH3 group (labeled f) is at 3.38 ppm. Note the overlap of the signal of the d protons with that of the c protons. Further addition of a functional group via the formation of an ester shifts the triplet corresponding to the protons a’ and b’ downfield by 0.51 and 0.08 ppm, respectively (Figure 4A). Note that in this case, the triplet corresponding to a protons of compound B at 3.72 ppm did not fully disappear, indicating that conjugation (formation of the ester) was not quantitative.
Figure 4.
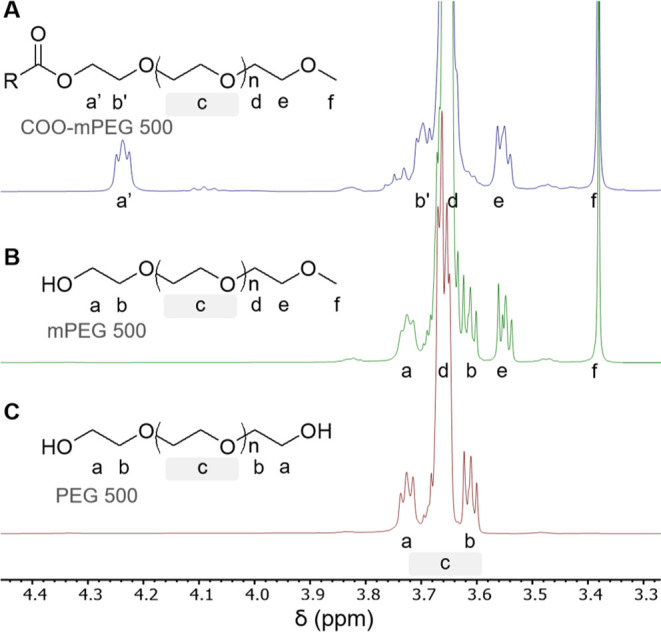
PEG conjugation. Area of interest (δ = 3.30–4.40 ppm) 1H NMR spectra (400 MHz, CDCl3) for PEG 500 Da with various end groups, normalized to tetramethyl silane. (A). Structure and spectrum of mPEG500 with general ester functionalization of terminal end group. (B). Structure and spectrum of mPEG500 with alcohol functionalization of the terminal end group. (C). Structure and spectrum of PEG500 with diol functionalization of terminal end groups.
Comparing NMR, MS, and SEC Techniques to Determine the Molecular Weight of mPEG
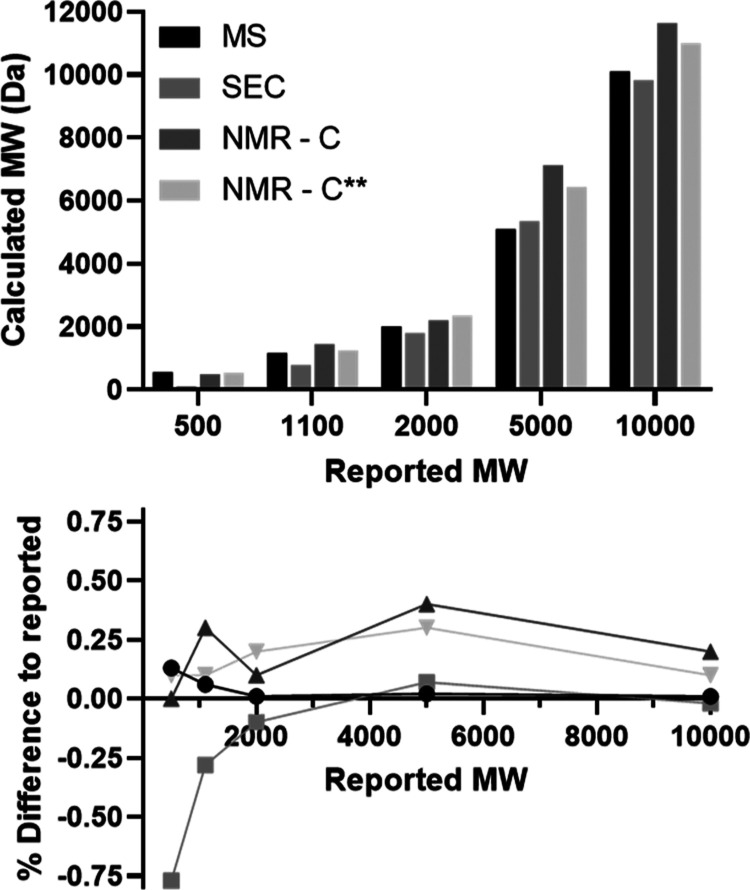
The correct assignment of 1H NMR spectra is key to correct determination of the molecular weight of functionalized PEGs. Once this is accomplished, the MW of the PEG can be determined by comparing the integration of the singlet of the methyl group (signal corresponding to the protons f) to either that of 1. the c signal corresponding to the repeating monomer unit (NMR—C in Figure 5) or 2. the 13C–1H coupled peaks of the CH2–O monomer (c* or c** signal in Figure 2, NMR—C** in Figure 5). The first method is the one most commonly attempted in the literature. Advantageously, the second method compares two integrations that are close in amount (see the Supporting Information for a more in-depth discussion on calculating MW with other NMR signals). Both methods were compared to both MS and SEC for commercial mPEG polymers ranging in size between 500 and 10 000 g/mol.
Figure 5.
MW calculation comparison. The MWs of mPEG were calculated using the three common techniques MS, SEC, and NMR normalizing peak f = 3 (see Figure 4) using the integration of main polymer–c peak, and NMR normalizing where c** = 0.0055 c. A set of five commercial mPEG MWs (500, 1100, 2000, 5000, and 10,000 Da, Figure 3 bottom) were chosen due to lab availability. Reported MW is what is commercially advertised. Top: MW values determined by indicated methodology. Bottom: Difference of calculated values to reported MW.
As shown in Figure 5, the common method, which compares the integration of the terminal methyl group to protons c of the 12C1H2–O to calculate MW results in values that are significantly higher than those determined by both SEC and MS techniques. On the other hand, except for the largest polymer, a comparison of the integration of the terminal methyl group to the integration of either c* or c** corresponding to the 13C1H2–O (the 13C coupled 1H peak of the repeating unit) yields MW that are within error, the same as those obtained by either SEC or MS. Advantageously, 13C coupling of 1H signals can thus be exploited to easily and more accurately determine the molecular weight of mPEG and functionalized mPEGs. Of note, in this case, the c* peak is better resolved and, therefore, gives more accurate results than the c** peak, thereby highlighting the necessity to use NMR peaks that are clearly resolved for MW calculations.
Quantifying Conjugation Yield and Purity of Functionalized PEGs
Nanoparticle coating and biomacromolecule conjugation requires PEGs that are further functionalized with either a small anchoring group (e.g., carboxylate, phosphonate, amine, and thiol) or a reactive group. These PEGs are typically achieved by conjugating a small molecule with the necessary orthogonal functional or reactive group. Because such conjugation leads to small changes in molecular weights and polarity, purification of such functionalized PEGs is difficult and is not always performed. Determination of the yield of the PEG functionalization is thus important. Although feasible, determination of the purity of functionalized PEGs by SEC requires a refractive index, and two wavelength channels are used in conjunction with a complex system of linear regressions in purity and polydispersity. It is significantly easier to determine the yield of conjugation and polymer purity by 1H NMR spectroscopy.
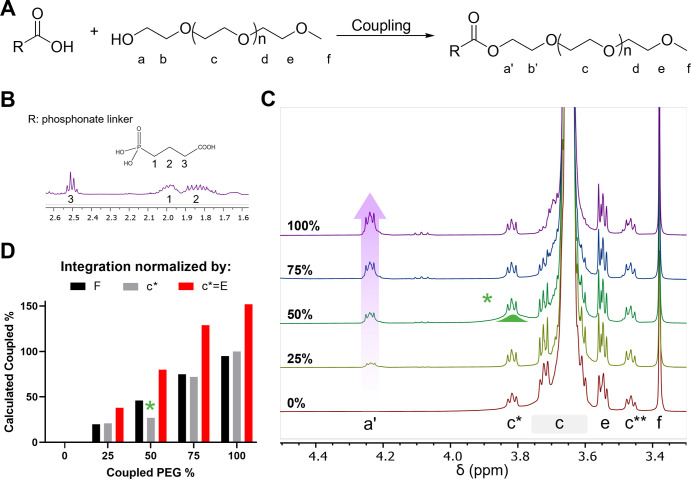
In the example shown in Figure 4A, the conjugation of a carboxylate to the alcohol via ester linkage shifts peak a’ (4.24 ppm) downfield by 0.51 ppm. The signal from a’ is sufficiently resolved from other peaks of the polymer that it can be accurately integrated. The conjugation yield can thus be determined by comparing the integration of that peak to that of a second well-resolved peak that does not shift upon conjugation. As outlined above, more accurate results are obtained if these two peaks have a similar integration. In the case of functionalized mPEG, such as compound B in Figure 6, the reference peak can either be protons f (3.38 ppm) of the methyl group, or protons c* or c** (3.81 and 3.45 ppm, respectively) corresponding to the 13C1H2–O (the 13C coupled 1H peak of the repeating unit). As noted above, c* and c** peaks, if well-defined, are very accurate for such calculations as long as they are interpreted correctly as belonging to the polymer repeating unit.
Figure 6.
Dilution of coupled mPEG. (A). Scheme of coupling ester to mPEG 2000, R group is shown in B. (B). Structure of the ester linker and area of interest 1H NMR spectrum (400 MHz, CDCl3). (C). 1H NMR spectra (400 MHz, CDCl3) of ester-conjugated mPEG2000 with free mPEG2000. The percentage value refers to the percent of ester-conjugated mPEG mixed with pure commercial mPEG, where 100% contains only ester-conjugated mPEG and 0% contains only pure mPEG at the same concentration. Spectra are normalized to tetramethyl silane. (D). Calculated % coupled amount based on normalization by integrating at one of four options, either f = 3, e = 2, c** = 0.55% C (mPEG 2000 c** = 1), or the misinterpretation of c** = e = 2.
The ease of this 1H NMR technique was demonstrated with monofunctionalized mPEG (Figure 6A). In this case, the mPEG was conjugated to a phosphonate (Figure 6B), which we previously demonstrated was an excellent anchoring group for iron oxide nanoparticles.8,19 To demonstrate the ability of this technique to determine purity of functionalized PEGs, 1H NMR spectra of the purified phosphonate linker, PLink-PEG2000 was recorded in the presence of increasing concentration of mPEG 2000 g/mol (Figure 6C). In each case, the purity of the PLink polymer was determined by comparing the integration of the CH2 of the phosphonate linker to either the methyl protons f or the 13C1H2–O of the polymer repeating unit. The results were compared to those obtained by SEC and MS (see Figure S11). In each case, normalizing the spectra to the correct integration of c** = 1 (0.0055 × 2000 Da/44 × 4 protons) consistently gave accurate purity levels. Interestingly, normalizing spectra to methyl protons f was far less accurate (Figure 6D).
Conclusions
1H NMR is a powerful technique to characterize the molecular weight, purity, and functionalization of polyethylene glycols. However, accurate interpretation requires acknowledgement that the number of terminal groups to repeating monomer unit is small. As such, unless a 13C decoupled 1H pulse sequence is used, one cannot ignore the 1.1% natural abundance of carbon-13 in standard one-dimensional 1H NMR spectra. Advantageously, if identified correctly, coupling of 13C to the two 1H of the repeating CH2 groups of the polymers gives an excellent chemical shift to calculate both the molecular weight and the conjugation efficacy of the polymer with similar accuracy and greater ease than SEC and MS. The method outlined above is applicable to protonated polymers other than PEG, a flow chart of the methodology is shown in Figure S12.
Acknowledgments
The authors thank Dr. Peter Flynn at the University of Utah, and Dr. Todd Rappe and Dr. Letitia Yao at the University of Minnesota for useful discussions. This work was supported by 5 F31 DK124968-02, NSF EEC 1941543, R01 HL135046, DK124333, and R01 DK117425. Research reported in this publication was supported by the Office of the Vice President of Research, College of Science and Engineering at the University of Minnesota.
Supporting Information Available
The Supporting Information is available free of charge at https://pubs.acs.org/doi/10.1021/acsomega.2c07669.
Experimental procedures, full 1H NMR spectra, SEC chromatograms, MALDI-MS spectra, further MW and functionalization analysis, and flowchart with description detailing procedure to calculate functionalization yield of PEG (PDF)
Author Contributions
The manuscript was written through contributions of all authors. All authors have given approval to the final version of the manuscript.
The authors declare no competing financial interest.
Supplementary Material
References
- Di Palma J. A.; Smith J. R.; Cleveland M. Overnight efficacy of polyethylene glycol laxative. Am. J. Gastroenterol. 2002, 97, 1776–1779. 10.1111/j.1572-0241.2002.05840.x. [DOI] [PubMed] [Google Scholar]
- Yuan L.; Xian Rong Q.; Yoshie M.; Tsuneji N. PEG–PLA diblock copolymer micelle-like nanoparticles as all-trans-retinoic acid carrier: in vitro and in vivo characterizations. Nanotechnol 2009, 20, 055106. [DOI] [PubMed] [Google Scholar]
- Walkey C. D.; Olsen J. B.; Guo H.; Emili A.; Chan W. C. W. Nanoparticle Size and Surface Chemistry Determine Serum Protein Adsorption and Macrophage Uptake. J. Am. Chem. Soc. 2012, 134, 2139–2147. 10.1021/ja2084338. [DOI] [PubMed] [Google Scholar]
- Cruje C.; Chithrani D. B. Polyethylene Glycol Density and Length Affects Nanoparticle Uptake by Cancer Cells. J. Nanomed. Res. 2014, 1, 00006. [Google Scholar]
- Li Y.; Kröger M.; Liu W. K. Endocytosis of PEGylated nanoparticles accompanied by structural and free energy changes of the grafted polyethylene glycol. Biomaterials 2014, 35, 8467–8478. 10.1016/j.biomaterials.2014.06.032. [DOI] [PubMed] [Google Scholar]
- Zhang W.; Martinelli J.; Peters J. A.; van Hengst J. M. A.; Bouwmeester H.; Kramer E.; Bonnet C. S.; Szeremeta F.; Tóth É.; Djanashvili K. Surface PEG Grafting Density Determines Magnetic Relaxation Properties of Gd-Loaded Porous Nanoparticles for MR Imaging Applications. ACS Appl. Mater. Interfaces 2017, 9, 23458–23465. 10.1021/acsami.7b05912. [DOI] [PMC free article] [PubMed] [Google Scholar]
- Xiao R. Z.; Zeng Z. W.; Zhou G. L.; Wang J. J.; Li F. Z.; Wang A. M. Recent advances in PEG–PLA block copolymer nanoparticles. Int. J. Nanomedicine 2010, 5, 1057–65. 10.2147/IJN.S14912. [DOI] [PMC free article] [PubMed] [Google Scholar]
- Smolensky E.; Park H.-Y.; Berquó T.; Pierre V. C. Surface Functionalization of Magnetic Iron Oxide Nanoparticles for MRI Applications – Effect of Anchoring Group and Ligand Exchange Protocol. Contrast Media Mol. Imaging 2011, 6, 189–99. 10.1002/cmmi.417. [DOI] [PMC free article] [PubMed] [Google Scholar]
- Amoozgar Z.; Yeo Y. Recent advances in stealth coating of nanoparticle drug delivery systems. Wiley Interdiscip. Rev.: Nanomed. Nanobiotechnol. 2012, 4, 219–233. 10.1002/wnan.1157. [DOI] [PMC free article] [PubMed] [Google Scholar]
- Cheng L.; Yang K.; Li Y.; Chen J.; Wang C.; Shao M.; Lee S.-T.; Liu Z. Facile Preparation of Multifunctional Upconversion Nanoprobes for Multimodal Imaging and Dual-Targeted Photothermal Therapy. Angew. Chem., Int. Ed. 2011, 50, 7385–7390. 10.1002/anie.201101447. [DOI] [PubMed] [Google Scholar]
- Ma Y.; Tong S.; Bao G.; Gao C.; Dai Z. Indocyanine green loaded SPIO nanoparticles with phospholipid-PEG coating for dual-modal imaging and photothermal therapy. Biomaterials 2013, 34, 7706–7714. 10.1016/j.biomaterials.2013.07.007. [DOI] [PubMed] [Google Scholar]
- Hortal A. R.; Hurtado P.; Martínez-Haya B.; Arregui A.; Bañares L. Solvent-Free MALDI Investigation of the Cationization of Linear Polyethers with Alkali Metals. J. Phys. Chem. B 2008, 112, 8530–8535. 10.1021/jp802089r. [DOI] [PubMed] [Google Scholar]
- Bogan M. J.; Agnes G. R. Poly(ethylene glycol) doubly and singly cationized by different alkali metal ions: Relative cation affinities and cation-dependent resolution in a quadrupole ion trap mass spectrometer. J. Am. Soc. Mass Spec. 2002, 13, 177–186. 10.1016/s1044-0305(01)00350-6. [DOI] [PubMed] [Google Scholar]
- Ait Bachir Z.; Huang Y.; He M.; Huang L.; Hou X.; Chen R.; Gao F. Effects of PEG surface density and chain length on the pharmacokinetics and biodistribution of methotrexate-loaded chitosan nanoparticles. Int. J. Nanomedicine 2018, 13, 5657–5671. 10.2147/ijn.s167443. [DOI] [PMC free article] [PubMed] [Google Scholar]
- Facchinatto W.; Fiamingo A.; Dos Santos D.; Campana-Filho S. Characterization and physical-chemistry of methoxypoly(ethylene glycol)-g-chitosan. Int. J. Biol. Macromol. 2019, 124, 828–837. 10.1016/j.ijbiomac.2018.11.246. [DOI] [PubMed] [Google Scholar]
- Mulay P.; Shrikhande G.; Puskas J. E. Synthesis of Mono- and Dithiols of Tetraethylene Glycol and Poly(ethylene glycol)s via Enzyme Catalysis. Catalysts 2019, 9, 228. 10.3390/catal9030228. [DOI] [Google Scholar]
- Harrell M. L.; Bergbreiter D. E. Using 1H NMR Spectra of Polymers and Polymer Products To Illustrate Concepts in Organic Chemistry. J. Chem. Ed. 2017, 94, 1668–1673. 10.1021/acs.jchemed.6b00801. [DOI] [Google Scholar]
- Izunobi J. U.; Higginbotham C. L. Polymer Molecular Weight Analysis by 1H NMR Spectroscopy. J. Chem. Ed. 2011, 88, 1098–1104. 10.1021/ed100461v. [DOI] [Google Scholar]
- Pasek-Allen J.; Wilharm R.; Gao Z.; Pierre V. C.; Bischof J. Phosphonate Coating of Commercial Iron Oxide Nanoparticles for Nanowarming Cryopreserved Samples. J. Mat. Chem. B. 2022, 10, 3734–3746. 10.1039/d1tb02483c. [DOI] [PMC free article] [PubMed] [Google Scholar]
Associated Data
This section collects any data citations, data availability statements, or supplementary materials included in this article.


