

Abstract
Background:
Older adults have many comorbidities contributing to mortality.
Objective:
To develop a summary Elixhauser (S-Elixhauser) comorbidity score to predict 30-day, in-hospital, and 1-year mortality in older adults using the 38 comorbidities operationalized by the Agency for Healthcare Research and Quality (AHRQ).
Design:
Retrospective cohort study.
Setting:
Medicare beneficiaries from 2017 to 2019.
Patients:
Persons hospitalized in 2018 (n = 899 844) and 3 disease-specific hospitalized cohorts.
Measurements:
Weights were derived for 38 comorbidities to predict 30-day, in-hospital, and 1-year mortality. The S-Elixhauser score was internally validated and calibrated. Individual Elixhauser comorbidity indicators (38 comorbidities), the modified application of the AHRQ-derived Elixhauser summary score, the Charlson comorbidity indicators (17 comorbidities), and the Charlson summary score were externally validated. The c-statistic was used to evaluate discrimination of a comorbidity score model.
Results:
The S-Elixhauser score was well calibrated and internally validated, with a c-statistic of 0.705 (95% CI, 0.703 to 0.707) in predicting 30-day mortality, 0.654 (CI, 0.651 to 0.657) for in-hospital mortality, and 0.743 (CI, 0.741 to 0.744) for 1-year mortality. In external validation of other comorbidity indices for 30-day mortality, the c-statistic was 0.711 (CI, 0.709 to 0.713) for the individual Elixhauser comorbidity indicators, 0.688 (CI, 0.686 to 0.690) for the AHRQ Elixhauser score, 0.696 (CI, 0.694 to 0.698) for the Charlson comorbidity indicators, and 0.690 (CI, 0.688 to 0.693) for the Charlson summary score. In 3 disease-specific populations, the discrimination of the S-Elixhauser score in predicting 30-day mortality ranged from 0.657 to 0.732.
Limitations:
Validation of the S-Elixhauser comorbidity score and head-to-head comparison with other comorbidity scores in an external population are needed to evaluate comparative performance.
Conclusion:
The S-Elixhauser comorbidity score is well calibrated and internally validated but its advantage over the AHRQ Elixhauser and Charlson summary scores is unclear.
Primary Funding Source:
National Institute on Aging.
Summary comorbidity scores, such as the Charlson comorbidity index and the Elixhauser comorbidity indictors, offer an efficient way to describe comorbidity burden and control confounding in observational studies; they can also be used for prognosis (1, 2). The set of Elixhauser comorbidity indicators was developed in 1998 and included 30 comorbidities based on International Classification of Diseases, 9th Revision, Clinical Modification (ICD-9-CM) algorithms (2). Nearly 10 years later, weights were developed to allow its use as a weighted summary score (3–5). Such weights offer advantages over the use of individual comorbidities because they describe comorbidity burden in a single score and increase statistical efficiency during confounding adjustment (6). Recently, researchers at the Agency for Healthcare Research and Quality (AHRQ) modified the Elixhauser comorbidity indicator for use with the International Classification of Diseases, 10th Revision, Clinical Modification (ICD-10-CM) coding system and expanded it to include 38 comorbidities (7). They also derived and evaluated the model fit of a summary Elixhauser (S-Elixhauser) score, based on weighting the individual comorbidities, to predict in-hospital mortality and 30-day all-cause readmissions in hospitalized adults. The performance of the summary score has not been evaluated for predicting longer-term mortality outcomes, nor has it been validated for use in older adults.
We hypothesized that using population- and outcome-specific weights to generate comorbidity scores provides better measurement of comorbidity burden (8). For example, weights derived for the Charlson comorbidity score for use in older adults did better than the original Charlson weights in predicting 1-year mortality (9). We therefore derived S-Elixhauser comorbidity scores for use with ICD-10-CM–coded data for older adults, termed the S-Elixhauser score, including separate scores for predicting in-hospital, 30-day, and 1-year mortality.
Methods
We use the term comorbidity indicator to mean a list of individual comorbidities that are included in a predictive model, whereas a summary comorbidity score is a value that summarizes comorbidities based on a scoring system from the weights derived from the model. We followed TRIPOD (Transparent Reporting of a multivariable prediction model for Individual Prognosis Or Diagnosis) guidelines for reporting (Supplement Table 1, available at Annals.org) (10).
Study Design and Data Source
We performed a retrospective cohort study using a 20% random sample of data from Medicare beneficiaries from 2017 to 2019. We used the Medicare Provider Analysis and Review file (inpatient claims), the outpatient file, the carrier file (professional claims), and the Medicare Beneficiary Summary file to capture demographic, enrollment, and vital status details. This study was deemed exempt by our institutional review board.
Study Cohort
Our primary study cohort included persons older than age 66 years who were hospitalized at least once between January 2018 and December 2018. The index hospitalization was the first hospitalization in that year. We required continuous enrollment in Medicare parts A and B, with no enrollment in a Medicare Advantage plan, in the year before hospitalization. We also created 3 disease-specific cohorts by using the primary discharge diagnosis to identify patients hospitalized for heart failure, chronic obstructive pulmonary disease, or diabetes mellitus (Supplement Table 2, available at Annals.org).
Outcomes
Our primary outcome was 30-day mortality, defined as death from any cause within 30 days of hospital admission. In-hospital mortality and 1-year mortality measured from the date of hospital admission were secondary outcomes. Death date was identified from the Medicare Beneficiary Summary File, and more than 99% of death dates are validated (11).
Generating Comorbidity Indicators and Scores
For Charlson and Elixhauser comorbidity indicators, we used diagnoses from all inpatient, outpatient, and professional claims in the 12 months before the hospital admission to identify comorbidities. We did not use diagnoses recorded in the index hospitalization. We considered persons to have a given comorbidity if there was at least 1 inpatient claim for a particular condition or 2 outpatient or physician claims that were recorded at least 30 days apart (12). Table 1 describes the population and outcomes used to generate Charlson and AHRQ Elixhauser scores.
Table 1.
Description of Charlson, AHRQ Elixhauser, and S-Elixhauser Comorbidity Scores
| Characteristic | Charlson Comorbidity Score (14)* | AHRQ Elixhauser Comorbidity Score (7)* | S-Elixhauser Comorbidity Score |
|---|---|---|---|
| Derivation population | Hospitalized persons age ≥18 y from Canada in 2004 (n = 55 929) | Hospitalized persons age ≥18 y from 45 states in 2018 (n = 17.85 million, 75% of 23.8 million discharges) | Medicare beneficiaries age ≥66 y hospitalized in 2018 (n = 899 844) |
| Validation population | Hospitalized persons age ≥18 y from Australia, Canada, France, Japan, New Zealand, and Switzerland; 2004 data were used for Canada, and 2008 for all of the other countries; sample size ranged from 352 200 to 2 361 957 | Hospitalized persons age ≥18 y from 45 states in 2018 (n = 5.95 million, 25% of 23.8 million discharges) | Same as derivation population; 3 disease-specific cohorts derived from the main cohort: congestive heart failure (n = 45 557), chronic obstructive pulmonary disease (n = 22 763), or diabetes mellitus (n = 10 067) |
| Outcome | In-hospital, 30-d, and 1-y mortality | In-hospital mortality and 30-d readmission | In-hospital, 30-d, and 1-y mortality |
| Performance (c-statistics) | Derivation cohort†: 0.881 (in-hospital mortality), 0.883 (30 d), 0.896 (1 y) Validation cohorts†: ranging from 0.727 to 0.878 (in-hospital mortality) |
Derivation cohort: not reported Validation cohort: not reported |
Derivation cohort: not reported Validation cohorts: 10-fold cross-validation,‡ 0.629 (in-hospital mortality), 0.667 (30 d), 0.704 (1 y); internal validation,§ 0.654 (in-hospital), 0.705 (30 d), 0.743 (1 y) |
| Algorithm to derive weights | Use of HRs to derive weights: 1 for HR of ≥1.2 but <1.5; 2 for HR of ≥1.5 but <2.5; 3 for HR of ≥2.5 but <3.5; 4 for HR of ≥3.5 but <4.5; 6 for HR of ≥6; no comorbidities had HR of ≥4.5 to <6 | The weight for each comorbidity was calculated as the value of its regression coefficient divided by the absolute value of the regression coefficient for the comorbidity with the smallest absolute value, rounded to the nearest integer | The weight for each comorbidity was calculated by multiplying the regression coefficient by 10 and rounding to the nearest integer |
| Comorbidities, n | 17 | 38 | 38 |
AHRQ = Agency for Healthcare Research and Quality; HR = hazard ratio; S-Elixhauser = summary Elixhauser.
From references 14 and 7, respectively.
Model included sex and age ≥65 y as independent variables.
Model did not include any other independent variables.
Model included age, sex, and race and ethnicity as independent variables.
Charlson Comorbidity Indicator and Score
We used the ICD-10-CM algorithm by Quan et al to create binary variables of 17 comorbidities for the Charlson comorbidity indicator (13). We then used updated weights from Quan et al to create a Charlson summary comorbidity score (14).
AHRQ Elixhauser Comorbidity Indicator and Score
We used Elixhauser Comorbidity Software Refined for ICD-10-CM v2022.1 from the AHRQ (7). The original AHRQ algorithm defines comorbidities as secondary diagnoses recorded during the index hospitalization and uses the present-on-admission indicator to differentiate comorbidities from complications arising during the hospitalization. However, we modified the algorithm and used all inpatient, outpatient, and professional claims in the 12 months before the hospital admission to capture comorbidities. We used the AHRQ weights, derived for in-hospital mortality, to calculate the AHRQ Elixhauser summary comorbidity score. This summary score derived using in-hospital mortality weights was also used for 30-day and 1-year mortality outcomes.
S-Elixhauser Comorbidities
To generate our new S-Elixhauser summary score, we used the modified AHRQ Elixhauser algorithm to define 38 comorbidities.
Statistical Analysis
Derivation of the S-Elixhauser Summary Score
In our cohort of older, hospitalized persons, we constructed separate multivariable logistic regression models for our 3 mortality outcomes (30 day, in-hospital, 1 year). All 3 models included the 38 individual S-Elixhauser comorbidities. We did not use any model-building process to select comorbidities. We generated β coefficients for each of the 38 comorbidities and then multiplied the β coefficients by 10 and rounded to the nearest integer to derive comorbidity weights (15). Weights were summed to calculate the S-Elixhauser summary score for a person, for each outcome.
Internal Validation and Calibration of the S-Elixhauser Summary Score
In the cohort of older persons, we evaluated the discrimination and calibration of the S-Elixhauser summary score. We used 10-fold cross-validation to evaluate model fit of the S-Elixhauser summary score in predicting 30-day, in-hospital, and 1-year mortality (16). We generated the concordance statistics (c-statistics) and calculated bias-corrected, bootstrap 95% CI using the %bootci macro in SAS. We evaluated the calibration of the S-Elixhauser summary score by plotting the observed and predicted mortality rates by the S-Elixhauser summary scores. We used the exact method to calculate the 95% CI for observed mortality rates (17).
Performance of Comorbidity Scores
We constructed a set of logistic regression models to predict 30-day mortality, in-hospital mortality, and 1-year mortality using each of the summary scores. The baseline model for each outcome included only age, sex, and race and ethnicity. Each subsequent model included these covariates plus 1 of the summary scores or set of indicators: the S-Elixhauser summary score (internal validation), 38 individual Elixhauser comorbidities, the AHRQ Elixhauser summary score, 17 individual Charlson comorbidities, or the Charlson summary score (external validation for last 4 models).
We evaluated the performance of different indices using c-statistics, Brier scores, Bayesian information criteria, and net reclassification improvement (NRI) (18). The c-statistic evaluates discrimination of a model (19). The Brier score measures discrimination and calibration simultaneously and estimates overall performance (20, 21). The NRI assesses the ability of 1 model to classify individuals more correctly into strata compared with the second model (22). Because there are no meaningful categories for mortality risk classification, we used the model-derived probability of death to create low-, medium-, and high-risk groups. The low-risk group was defined as having a probability between 0 and the median-predicted probability among those who did not die, the medium-risk group was defined as having a probability between the median-predicted probability among those who did not die and those who died, and the high-risk group was defined as having a probability between the median probability among those who died and 1. We calculated the NRI for all comorbidity scores in comparison to the baseline model.
In secondary analyses, we constructed similar models for each disease-specific cohort. When operationalizing the comorbidity indices and scores for the disease-specific populations, we excluded the index disease from the comorbidity score calculation because all patients will necessarily have that condition (Supplement Table 3, available at Annals.org). There were no missing data for age, sex, and race and ethnicity. All comorbidities were defined as present versus absent; therefore, there was no missingness for comorbidities. All analyses were done using SAS Enterprise statistical software v7.12 (SAS Institute). We provide the SAS code and the R script to define Elixhauser comorbidities and the AHRQ Elixhauser summary score in the Supplement (available at Annals.org).
Role of the Funding Source
The funders had no influence on the study’s design, conduct, or reporting.
Results
Cohort Characteristics
We identified 3 101 227 hospitalizations in 2018. After selecting the first hospitalization for each person and limiting the cohort to those who were 66 years or older and continuously enrolled, our final cohort included 899 844 persons (Supplement Figure 1, available at Annals.org). The mean age of the cohort was 78.9 years (SD, 8.3 years), 56.4% were female, 86.8% were White, and 7.5% were Black. Overall, 7.3% (n = 65 487) died within 30 days of hospital admission. In-hospital and 1-year mortality rates were 2.9% (n = 26 034) and 22.0% (198 288), respectively.
Derivation of the S-Elixhauser Summary Score
The most prevalent comorbidities were uncomplicated hypertension (54.2%), chronic pulmonary disease (23.6%), deficiency anemia (22.3%), complicated diabetes (21.2%), and hypothyroidism (21.2%) (Table 2). Metastatic cancer (odds ratio [OR], 3.22 [95% CI, 3.11 to 3.34]; weight 12), dementia (OR, 2.39 [CI, 2.34 to 2.45]; weight 9), congestive heart failure (OR, 1.60 [CI, 1.56 to 1.64]; weight 5), weight loss (OR, 1.59 [CI 1.55 to 1.64]; weight 5), severe renal failure (OR, 1.49 [CI, 1.43 to 1.55]; weight 4), and leukemia (OR, 1.42 [CI, 1.33 to 1.52]; weight 4) had the strongest associations with 30-day mortality (Table 2; Supplement Table 4, available at Annals.org), as well as in-hospital and 1-year mortality. Moderate to severe liver disease had a stronger association with 1-year mortality than short-term in-hospital and 30-day mortality. The weights that we generated for the 38 comorbidities for 30-day mortality ranged from −5 for obesity to 12 for metastatic cancer. The S-Elixhauser summary scores ranged from −17 to 41, with a median (interquartile range) of 0 (−2 to 4) (Supplement Table 5, available at Annals.org). We report the prevalence of Charlson comorbidities in Supplement Table 6 (available at Annals.org).
Table 2.
Prevalence of Elixhauser Comorbidities and Weights Derived for the S-Elixhauser Score to Predict Mortality From Logistic Regression Models*
| Elixhauser Comorbidities | Number (%) | Weight for 30-d Mortality† | Weight for In-Hospital Mortality‡ | Weight for 1-y Mortality§ | AHRQ Weights for In-Hospital Mortality|| |
|---|---|---|---|---|---|
| Metastatic cancer | 24 850 (2.76) | 12 | 7 | 18 | 23 |
| Dementia | 107 165 (11.91) | 9 | 5 | 11 | 5 |
| Congestive heart failure | 162 101 (18.01) | 5 | 5 | 6 | 15 |
| Weight loss | 47 589 (5.29) | 5 | 4 | 6 | 14 |
| Leukemia | 8995 (1.00) | 4 | 4 | 5 | 9 |
| Renal failure, severe | 35 575 (3.95) | 4 | 3 | 6 | 8 |
| Liver disease, moderate to severe | 6361 (0.71) | 3 | 2 | 7 | 17 |
| Coagulopathy | 44 045 (4.89) | 2 | 2 | 2 | 15 |
| Deficiency anemia | 200 439 (22.27) | 2 | 1 | 2 | −3 |
| Paralysis | 26 774 (2.98) | 2 | 2 | 2 | 4 |
| Peripheral vascular disease | 177 049 (19.68) | 2 | 1 | 2 | 3 |
| Pulmonary circulation disease | 36 031 (4.00) | 2 | 2 | 3 | 4 |
| Renal failure, moderate | 128 716 (14.30) | 2 | 1 | 3 | 3 |
| Solid tumor without metastasis, malignant | 93 817 (10.43) | 2 | 1 | 3 | 0 |
| Chronic pulmonary disease | 212 125 (23.57) | 1 | 1 | 2 | 2 |
| Lymphoma | 14 673 (1.63) | 1 | 1 | 2 | 6 |
| Cerebrovascular disease | 100 228 (11.14) | 0 | 0 | −1 | 5 |
| Hypothyroidism | 190 432 (21.16) | 0 | −1 | 0 | −3 |
| Liver disease, mild | 26 618 (2.96) | 0 | 0 | 0 | 2 |
| Neurologic disorders affecting movement | 42 063 (4.67) | 0 | −1 | 1 | −1 |
| Other neurologic disorders | 43 462 (4.83) | 0 | 0 | 1 | 23 |
| Peptic ulcer with bleeding | 10 765 (1.20) | 0 | 1 | −1 | 0 |
| Valvular disease | 116 084 (12.90) | 0 | 0 | 0 | 0 |
| Alcohol misuse | 12 817 (1.42) | −1 | 0 | −1 | −1 |
| Blood loss anemia | 16 214 (1.80) | −1 | −1 | 0 | −4 |
| Depression | 134 946 (15.00) | −1 | −1 | −1 | −9 |
| Diabetes, complicated | 190 458 (21.17) | −1 | 0 | 0 | −2 |
| Diabetes, uncomplicated | 98 145 (10.91) | −1 | 0 | 0 | 0 |
| Psychoses | 38 258 (4.25) | −1 | −1 | −2 | −9 |
| Seizures and epilepsy | 25 688 (2.85) | −1 | 0 | 0 | 2 |
| Solid tumor without metastasis, in situ | 7013 (0.78) | −1 | 0 | 0 | 10 |
| Arthroplasties | 48 116 (5.35) | −2 | −1 | −1 | −1 |
| Hypertension, uncomplicated | 488 102 (54.24) | −2 | −2 | −2 | 0 |
| Hypertension, complicated | 179 031 (19.90) | −3 | −3 | −2 | 1 |
| Other thyroid disorders | 25 641 (2.85) | −3 | −3 | −4 | −8 |
| AIDS/HIV | 1153 (0.13) | −4 | −2 | −3 | −4 |
| Drug misuse | 11 197 (1.24) | −4 | −4 | −3 | −7 |
| Obesity | 131 111 (14.57) | −5 | −4 | −5 | −7 |
AHRQ = Agency for Healthcare Research and Quality; S-Elixhauser = summary Elixhauser.
Weights for the S-Elixhauser score were derived by multiplying the regression coefficient by 10 and rounding to the nearest integer. Supplement Table 5 reports actual regression coefficients and the odds ratio for all comorbidities.
c-Statistic from 10-fold cross-validation is 0.667 (95% CI, 0.666–0.667) for 30-d mortality.
c-Statistic from 10-fold cross-validation is 0.629 (CI, 0.628–0.629) for in-hospital mortality.
c-Statistic from 10-fold cross-validation is 0.704 (CI, 0.704–0.704) for 1-y mortality.
The AHRQ weights were derived by dividing the regression coefficient for each comorbidity by the absolute smallest value of the regression coefficient for the comorbidity, rounded to the nearest integer.
Internal Validation of the Elixhauser Summary Score
After 10-fold cross-validation, the S-Elixhauser summary score for 30-day mortality had a c-statistic of 0.667 (CI, 0.666 to 0.667). The observed 30-day mortality ranged from 2.2% for S-Elixhauser scores less than −8 to 21.9% for scores exceeding 16 (Figure). The observed and predicted risks for 30-day mortality were largely similar except for the extreme scores above 16 where predicted mortality rates were overestimated. In contrast, predicted 1-year mortality was underestimated among persons with the highest S-Elixhauser scores (Supplement Figures 2 and 3, available at Annals.org).
Figure. Calibration plot of the S-Elixhauser summary score in predicting 30-day mortality.
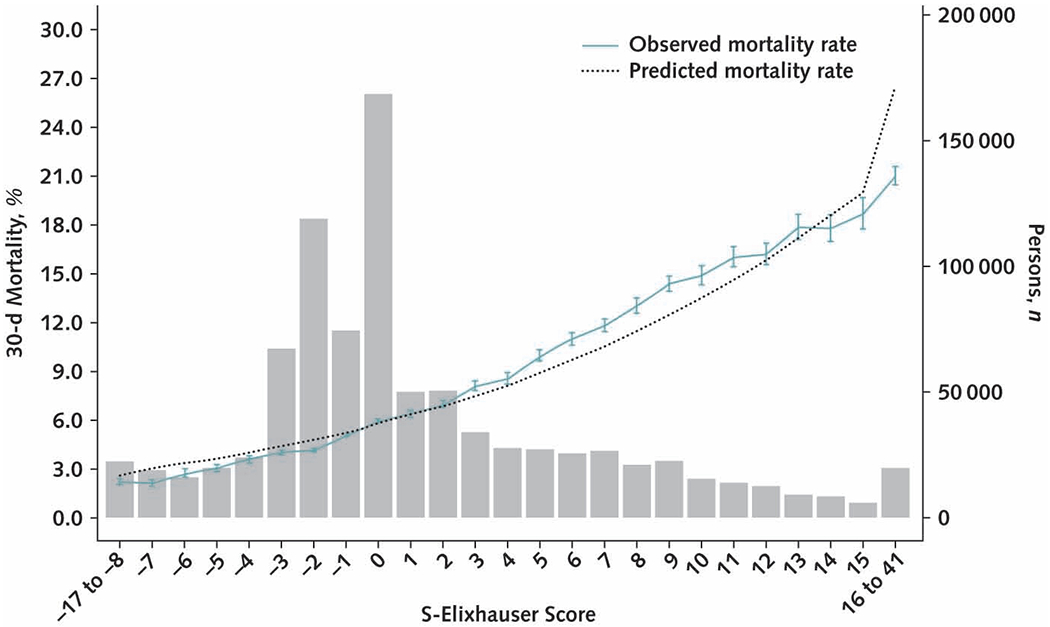
The gray bars present the number of people having each S-Elixhauser summary score. The dotted line is the predicted 30-day mortality rate and the solid line is the observed mortality rate, with 95% CIs calculated using the exact methods. S-Elixhauser = summary Elixhauser.
Performance of the S-Elixhauser Summary Score and Other Comorbidity Scores
The S-Elixhauser summary score (internal validation) had a c-statistic of 0.705 (CI, 0.703 to 0.707) in predicting 30-day mortality (Table 3). In our external validation exercises, the c-statistic was 0.711 (CI, 0.709 to 0.713) for the Elixhauser comorbidity indicators, 0.688 (CI, 0.686 to 0.690) for the AHRQ Elixhauser summary score, 0.696 (CI, 0.694 to 0.698) for the Charlson comorbidity indicators, and 0.690 (CI, 0.688 to 0.693) for the Charlson summary score. The individual Elixhauser comorbidity indicators had the highest c-statistic in predicting 30-day mortality (0.711 [CI, 0.709 to 0.713]), in-hospital mortality (0.658 [CI, 0.655 to 0.661]), and 1-year mortality (0.748 [CI, 0.747 to 0.749]). We found similar patterns for c-statistics for in-hospital and 1-year mortality (Supplement Table 7 and Supplement Figures 4 to 9, available at Annals.org). All comorbidity scores reclassified more people into correct risk strata compared with the baseline model (Supplement Table 8, available at Annals.org). For example, the S-Elixhauser summary score correctly reclassified 2.4% of persons who died within 30 days into a higher-risk strata and 11.9% of persons who did not die (nonevent) into a lower-risk strata, giving an overall NRI of 14.3. The respective estimates for the AHRQ Elixhauser summary score were 2.3%, 6.8%, and 9.1, whereas for the Charlson summary score, the respective estimates were 2.6%, 7.4%, and 10.0. For all comorbidity indices, overall NRI was mainly driven by the improvement in the nonevent NRI.
Table 3.
Performance of Comorbidity Measures in Predicting Mortality, Indicated by c-Statistic
| Variables | 30-d Mortality, c-Statistic (95% CI) | In-Hospital Mortality, c-Statistic (95% CI) | 1-y Mortality, c-Statistic (95% CI) |
|---|---|---|---|
| Model with demographics | 0.653 (0.651–0.655) | 0.610 (0.607–0.614) | 0.664 (0.663–0.664) |
| + S-Elixhauser summary score* | 0.705 (0.703–0.707) | 0.654 (0.651–0.657) | 0.743 (0.741–0.744) |
| + Elixhauser comorbidity indicator (38 individual comorbidities )* | 0.711 (0.709–0.713) | 0.658 (0.655–0.661) | 0.748 (0.747–0.749) |
| + AHRQ Elixhauser summary score* | 0.688 (0686–0.690) | 0.642 (0.638–0.645) | 0.719 (0.718–0.721) |
| + Charlson comorbidity indicator (17 individual comorbidities)* | 0.696 (0.694–0.698) | 0.641 (0.638–0.644) | 0.730 (0.729–0.731) |
| + Charlson summary score* | 0.690 (0.688–0.693) | 0.638 (0.634–0.641) | 0.726 (0.724–0.727) |
AHRQ = Agency for Healthcare Research and Quality; S-Elixhauser = summary Elixhauser.
Model with S-Elixhauser score reflects internal validation in the population in which it was derived, whereas all of the other models with Charlson or Elixhauser scores reflect external validation.
Performance of Comorbidity Scores in 3 Disease Specific Cohorts
Among patients hospitalized for heart failure, chronic obstructive pulmonary disease, or diabetes, the newly developed S-Elixhauser summary score (internally validated) had a c-statistic ranging from 0.657 to 0.732 in predicting 30-day mortality (Table 4). The c-statistic for other comorbidity scores in predicting 30-day mortality among the 3 disease-specific cohorts, in their external validations, ranged from 0.618 to 0.745. We found similar findings when we evaluated the performance of different comorbidity indices among 3 disease-specific cohorts in predicting in-hospital mortality (Supplement Table 9, available at Annals.org) and 1-year mortality (Supplement Table 10, available at Annals.org).
Table 4.
Performance of Comorbidity Measures in Predicting 30-Day Mortality in 3 Disease-Specific Samples, Indicated by c-Statistic
| Variables | Persons With CHF (n = 45 557), c-Statistic (95% CI) | Persons With COPD (n = 22 763), c-Statistic (95% CI) | Persons With T2DM (n = 10 067), c-Statistic (95% CI) |
|---|---|---|---|
| Model with demographics | 0.632 (0.623–0.640) | 0.618 (0.601–0.635) | 0.678 (0.651–0.705) |
| + S-Elixhauser summary score*† | 0.660 (0.651–0.668) | 0.657 (0.640–0.674) | 0.732 (0.708–0.757) |
| + Elixhauser comorbidity indicator (38 individual comorbidities)*† | 0.663 (0.655–0.672) | 0.672 (0.656–0.689) | 0.745 (0.721–0.769) |
| + AHRQ Elixhauser summary score | 0.647 (0.639–0.656) | 0.652 (0.635–0.669) | 0.714 (0.689–0.739) |
| + Charlson comorbidity indicator (17 individual comorbidities)*† | 0.650 (0.642–0.659) | 0.642 (0.625–0.659) | 0.719 (0.694–0.744) |
| + Charlson summary score*† | 0.644 (0.636–0.653) | 0.633 (0.616–0.650) | 0.711 (0.686–0.736) |
AHRQ = Agency for Healthcare Research and Quality; CHF = congestive heart failure; COPD = chronic obstructive pulmonary disease; S-Elixhauser = summary Elixhauser; T2DM = type 2 diabetes mellitus.
Model with S-Elixhauser score reflects internal validation in the population in which it was derived, whereas all of the other models with Charlson or Elixhauser scores reflect external validation.
For each disease-specific cohort, we excluded that particular disease from the comorbidity score. Please refer to Supplement Table 2.
Discussion
We derived an S-Elixhauser summary score for use with the ICD-10-CM coding system among older adults. We derived weights to calculate the S-Elixhauser comorbidity score for in-hospital, 30-day, and 1-year mortality. This newly developed S-Elixhauser score was internally validated and well calibrated for short- and long-term mortality outcomes among all older adults and those who were hospitalized for heart failure, chronic obstructive pulmonary disease, or diabetes. We also performed an external validation of Charlson and AHRQ Elixhauser comorbidity scores in predicting mortality among older adults. In all cases, the individual Elixhauser comorbidity indicators, operationalized as 38 individual comorbidities, had the highest discrimination in predicting mortality outcomes.
Consistent with previous studies, we found that the use of 38 individual Elixhauser comorbidities had the highest discrimination in predicting mortality (6, 23). Because inclusion of individual comorbidities in a model can freely estimate the effect of comorbidities on outcomes without a loss of information, it is more predictive than a summary score. However, a summary comorbidity score, such as an S-Elixhauser score, offers several advantages. It provides a single measure to describe comorbidity burden in a population, which is valuable for comparing populations and developing risk calculators (24). Statistically, it is more efficient to control for comorbidities using 1 variable than 38 variables in direct regression adjustment, especially if there are sample size limitations. Summary scores can also be useful to stratify patients based on their overall comorbidity burden for health services planning and exploration of heterogeneity of treatment effect (25).
The internally validated S-Elixhauser discrimination measures were minimally greater than the externally validated measures from the other scores, a difference that we expect to diminish or disappear when there is external validation of S-Elixhauser. When first derived, the Charlson and Elixhauser scores used weights from models that included adults of all ages, although we have demonstrated here that the scores perform well in predicting mortality among older adults (9, 23, 26). The developers of the Charlson comorbidity score used a Canadian population to generate weights for 1-year mortality, and those developing the Elixhauser score used a U.S. population to generate weights for in-hospital mortality. We applied these weights for all 3 of the mortality outcomes. In contrast, we developed separate weights for the S-Elixhauser score for the 3 outcomes. Therefore, one cannot directly compare the S-Elixhauser score with the other scores in this study and conclude superior performance of the S-Elixhauser score. The generalizability of S-Elixhauser is also limited to older adults enrolled in fee-for-service Medicare. Future studies should externally validate and perform head-to-head comparisons of S-Elixhauser with existing comorbidity scores in an outpatient population, in older adults enrolled in Medicare Advantage plans, and other disease-specific populations.
Summary comorbidity scores can be viewed as a limited version of prognostic scores or disease risk scores because they summarize only diagnosed health conditions without accounting for other nonhealth and noncomorbidity information. Summary scores simplify the measurement of comorbidity burden and are useful for descriptive purposes and for the exploration of magnitude and direction of confounding due to comorbidities (8). If the effect of an individual comorbidity on the outcome of interest differs substantially from the population in which it was derived, then summary comorbidity score can lead to suboptimal control of confounding due to comorbidities. Researchers can evaluate the appropriateness of a previously derived summary score in their studies by checking the balance of outcomes in the presence and absence of a given comorbidity after conditioning on comorbidity score (27). One should note that controlling for comorbidity scores does not guarantee an adequate control of confounding. In addition to comorbidities, other important confounders should be adequately controlled in the analysis.
Our study has limitations. First, the score cannot be used in studies that use both ICD-9-CM and ICD-10-CM data because weights are only applicable to comorbidities identified using the ICD-10-CM codes. In instances where researchers need to use data spanning both the ICD-9-CM and ICD-10-CM periods, they might use the 29 Elixhauser comorbidities based on the ICD-9-CM algorithm and its coding adaptation for ICD-10-CM, such as the algorithm of Quan et al (13). Second, we only compared the performance of the Elixhauser measures against the Charlson measures, primarily because both are widely used in health services research and clinical epidemiology. Future studies can compare the performance against other generic or disease-specific comorbidity scores. Third, although we tested comparative performance of comorbidity scores for 30-day, in-hospital, and 1-year mortality, additional research is required to evaluate performance for longer-term survival and rehospitalization outcomes. Fourth, for simplicity, we only included the 38 comorbidities as main effects and did not include possible 2-way and 3-way interactions of comorbidities. This was consistent with the AHRQ approach to developing a summary score. Fifth, we did not estimate weights for the S-Elixhauser comorbidity score for each disease-specific cohort, which may marginally outperform generic weights. From a practical viewpoint, using the whole-population weights developed for the S-Elixhauser comorbidity score did well in predicting mortality in disease-specific populations of older adults.
The newly derived S-Elixhauser summary score measures comorbidity burden and risk-stratifies older adults based on their overall comorbidity burden. Validation and comparative performance of the S-Elixhauser score in an external population is required to determine its utility in measuring comorbidities among older adults and whether there are instances where its use might be preferable to the AHRQ Elixhauser and Charlson summary scores.
Supplementary Material
Supplement. Supplementary Material
Grant Support:
By National Institute of Aging (NIA) grant 1K01AG070329 (Dr. Mehta), National Cancer Institute grant 5K05CA134923 (Dr. Goodwin), and NIA grant K24AG049036 (Dr. Segal)
Footnotes
Disclosures: Disclosures can be viewed at www.acponline.org/authors/icmje/ConflictOfInterestForms.do?msNum=M21-4204.
Reproducible Research Statement: Study protocol: Available from Dr. Mehta (e-mail, hbmehta@jhu.edu). Statistical code: SAS and R codes are provided in the Supplement. More information is available from Dr. Mehta (e-mail, hbmehta@jhu.edu). Data set: Data are available from the Centers for Medicare & Medicaid Services and can be requested through the Research Data Assistance Center (https://resdac.org/research-identifiable-files-rif-requests).
Contributor Information
Hemalkumar B. Mehta, Center for Drug Safety & Effectiveness and Department of Epidemiology, Johns Hopkins Bloomberg School of Public Health, Baltimore, Maryland.
Shuang Li, Sealy Center on Aging, Department of Internal Medicine, The University of Texas Medical Branch at Galveston, Galveston, Texas.
Huijun An, Center for Drug Safety & Effectiveness and Department of Epidemiology, Johns Hopkins Bloomberg School of Public Health, Baltimore, Maryland.
James S. Goodwin, Sealy Center on Aging, Department of Internal Medicine, The University of Texas Medical Branch at Galveston, Galveston, Texas.
G. Caleb Alexander, Center for Drug Safety & Effectiveness and Department of Epidemiology, Johns Hopkins Bloomberg School of Public Health, Baltimore, and Division of General Internal Medicine, Johns Hopkins Medicine, Baltimore, Maryland.
Jodi B. Segal, Center for Drug Safety & Effectiveness and Department of Epidemiology, Johns Hopkins Bloomberg School of Public Health, Baltimore, and Division of General Internal Medicine, Johns Hopkins Medicine, Baltimore, Maryland.
References
- 1.Charlson ME, Pompei P, Ales KL, et al. A new method of classifying prognostic comorbidity in longitudinal studies: development and validation. J Chronic Dis. 1987;40:373–83. doi: 10.1016/0021-9681(87)90171-8 [DOI] [PubMed] [Google Scholar]
- 2.Elixhauser A, Steiner C, Harris DR, et al. Comorbidity measures for use with administrative data. Med Care. 1998;36:8–27. doi: 10.1097/00005650-199801000-00004 [DOI] [PubMed] [Google Scholar]
- 3.van Walraven C, Austin PC, Jennings A, et al. A modification of the Elixhauser comorbidity measures into a point system for hospital death using administrative data. Med Care. 2009;47:626–33. doi: 10.1097/MLR.0b013e31819432e5 [DOI] [PubMed] [Google Scholar]
- 4.Thompson NR, Fan Y, Dalton JE, et al. A new Elixhauser-based comorbidity summary measure to predict in-hospital mortality. Med Care. 2015;53:374–9. doi: 10.1097/MLR.0000000000000326 [DOI] [PMC free article] [PubMed] [Google Scholar]
- 5.Moore BJ, White S, Washington R, et al. Identifying increased risk of readmission and in-hospital mortality using hospital administrative data: the AHRQ elixhauser comorbidity index. Med Care. 2017;55:698–705. doi: 10.1097/MLR.0000000000000735 [DOI] [PubMed] [Google Scholar]
- 6.Austin SR, Wong YN, Uzzo RG, et al. Why summary comorbidity measures such as the charlson comorbidity index and elixhauser score work. Med Care. 2015;53:e65–72. doi: 10.1097/MLR.0b013e318297429c [DOI] [PMC free article] [PubMed] [Google Scholar]
- 7.Agency for Healthcare Research and Quality. Elixhauser Comorbidity Software Refined for ICD-10-CM. Accessed at www.hcup-us.ahrq.gov/toolssoftware/comorbidityicd10/comorbidity_icd10.jsp on 25 May 2022.
- 8.Schneeweiss S, Maclure M. Use of comorbidity scores for control of confounding in studies using administrative databases. Int J Epidemiol. 2000;29:891–8. doi: 10.1093/ije/29.5.891 [DOI] [PubMed] [Google Scholar]
- 9.Schneeweiss S, Wang PS, Avorn J, et al. Improved comorbidity adjustment for predicting mortality in Medicare populations. Health Serv Res. 2003;38:1103–20. doi: 10.1111/1475-6773.00165 [DOI] [PMC free article] [PubMed] [Google Scholar]
- 10.Moons KG, Altman DG, Reitsma JB, et al. Transparent Reporting of a multivariable prediction model for Individual Prognosis or Diagnosis (TRIPOD): explanation and elaboration. Ann Intern Med. 2015;162:W1–73. doi: 10.7326/M14-0698 [DOI] [PubMed] [Google Scholar]
- 11.Research Data Assistance Center (ResDAC). Death Information in the Research Identifiable Medicare Data. Accessed at https://resdac.org/articles/death-information-research-identifiable-medicare-data on 19 May 2021.
- 12.Klabunde CN, Potosky AL, Legler JM, et al. Development of a comorbidity index using physician claims data. J Clin Epidemiol. 2000;53:1258–67. doi: 10.1016/s0895-4356(00)00256-0 [DOI] [PubMed] [Google Scholar]
- 13.Quan H, Sundararajan V, Halfon P, et al. Coding algorithms for defining comorbidities in ICD-9-CM and ICD-10 administrative data. Med Care. 2005;43:1130–9. doi: 10.1097/01.mlr.0000182534.19832.83 [DOI] [PubMed] [Google Scholar]
- 14.Quan H, Li B, Couris CM, et al. Updating and validating the Charlson comorbidity index and score for risk adjustment in hospital discharge abstracts using data from 6 countries. Am J Epidemiol. 2011;173:676–82. doi: 10.1093/aje/kwq433 [DOI] [PubMed] [Google Scholar]
- 15.Mehta HB, Mehta V, Girman CJ, et al. Regression coefficient-based scoring system should be used to assign weights to the risk index. J Clin Epidemiol. 2016;79:22–28. doi: 10.1016/j.jclinepi.2016.03.031 [DOI] [PubMed] [Google Scholar]
- 16.Steyerberg EW. Validation in prediction research: the waste by data splitting. J Clin Epidemiol. 2018;103:131–133. doi: 10.1016/j.jclinepi.2018.07.010 [DOI] [PubMed] [Google Scholar]
- 17.Fleiss JL, Levin B, Paik MC. Poisson regression. In: Statistical Methods for Rates and Proportions. 3rd ed. J Wiley; 2003:340–72. [Google Scholar]
- 18.Steyerberg EW, Vickers AJ, Cook NR, et al. Assessing the performance of prediction models: a framework for traditional and novel measures. Epidemiology. 2010;21:128–38. doi: 10.1097/EDE.0b013e3181c30fb2 [DOI] [PMC free article] [PubMed] [Google Scholar]
- 19.DeLong ER, DeLong DM, Clarke-Pearson DL. Comparing the areas under two or more correlated receiver operating characteristic curves: a nonparametric approach. Biometrics. 1988;44:837–45. [PubMed] [Google Scholar]
- 20.Brewer MJ, Butler A, Cooksley SL. The relative performance of AIC, AICC and BIC in the presence of unobserved heterogeneity. Methods Ecol Evol. 2016;7:679–92. doi: 10.1111/2041-210X.12541 [DOI] [Google Scholar]
- 21.Raftery AE. Bayesian model selection in social research. Sociol Methodol. 1995;25:111–63. doi: 10.2307/271063. [DOI] [Google Scholar]
- 22.Leening MJ, Vedder MM, Witteman JC, et al. Net reclassification improvement: computation, interpretation, and controversies: a literature review and clinician’s guide. Ann Intern Med. 2014;160:122–31. doi: 10.7326/M13-1522 [DOI] [PubMed] [Google Scholar]
- 23.Mehta HB, Dimou F, Adhikari D, et al. Comparison of comorbidity scores in predicting surgical outcomes. Med Care. 2016;54:180–7. doi: 10.1097/MLR.0000000000000465 [DOI] [PMC free article] [PubMed] [Google Scholar]
- 24.Garibaldi BT, Fiksel J, Muschelli J, et al. Patient trajectories among persons hospitalized for COVID-19: a cohort study. Ann Intern Med. 2021;174:33–41. doi: 10.7326/M20-3905 [DOI] [PMC free article] [PubMed] [Google Scholar]
- 25.Varadhan R, Seeger JD. Estimation and reporting of heterogeneity of treatment effects. In: Velentgas P, Dreyer NA, Nourjah P, et al. , eds. Developing a Protocol for Observational Comparative Effectiveness Research: A User’s Guide. Agency for Healthcare Research and Quality; January 2013. [PubMed] [Google Scholar]
- 26.Schneeweiss S, Seeger JD, Maclure M, et al. Performance of comorbidity scores to control for confounding in epidemiologic studies using claims data. Am J Epidemiol. 2001;154:854–64. doi: 10.1093/aje/154.9.854 [DOI] [PubMed] [Google Scholar]
- 27.Gilbert EA, Krafty RT, Bleicher RJ, et al. On the use of summary comorbidity measures for prognosis and survival treatment effect estimation. Health Serv Outcomes Res Methodol. 2017;17:237–255. doi: 10.1007/s10742-017-0171-2 [DOI] [PMC free article] [PubMed] [Google Scholar]
Associated Data
This section collects any data citations, data availability statements, or supplementary materials included in this article.
Supplementary Materials
Supplement. Supplementary Material