The advent of Ultra-High-Field (UHF) 7-Tesla (or higher) MRI lifted part of the limitations to assess functional responses of small brain structures in vivo. The resolution remains, however, far from invasive techniques applicable in animal models (1). Schoonderwoerd et al. recently investigated light response of the anterior hypothalamus using UHF fMRI (2). The hypothalamus portion they considered includes the suprachiasmatic nucleus (SCN), which is the site of the master circadian clock and receives strong photic inputs from the retina to contribute to the so-called nonvisual impact of light on physiology (3). While we applaud their intentions, we caution that they overlooked the potential limitations of their approach. The authors overstated that they provided functional responses of the SCN itself and delivered potentially erroneous recommendations.
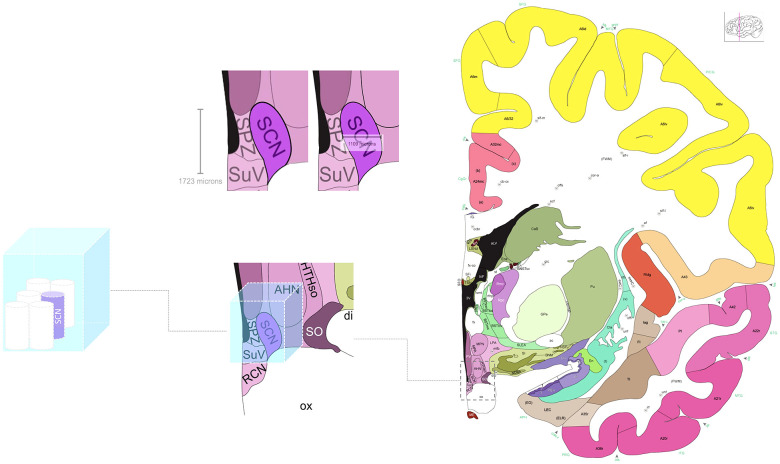
The size of the SCN is estimated to be (1.7 × 1.1 × 1.1) mm3 ~ 2.1 mm3 (4) which is close (but 20% smaller) to the voxel size used by Schoonderwoerd et al. [(1.25 × 1.25 × 1.65) mm3 ~ 2.6 mm3]. Because the SCN was most likely partly covered by several voxels, they averaged the blood oxygen level-dependent (BOLD) signal over a (3 × 4 × 3) mm3 VOI placed around the SCN location (=36 mm3), i.e., a volume 18 times larger than the SCN. As shown in Fig. 1, despite their careful and individually tuned manual placement around the SCN, the VOI undoubtedly contained nuclei surrounding the SCN, several of which also receive retinal inputs (5) triggering a decrease in their activity (6).
Fig. 1.
Representation of the (3 × 4 × 3) mm3 volume of interest (VOI) used by Schoonderwoerd et al. to extract and average BOLD signal around the SCN. Left: The SCN is estimated to be (1.7 × 1.1 × 1.1) mm3 (~2.1 mm3) cylinder that is ~18 times smaller than the 36 mm3 VOI. Middle and Right: The SCN and its surrounding nuclei. Its representation has been zoomed in from the brain atlas displayed on the right (4). The VOI is placed around the SCN.
Furthermore, the BOLD signal is inherently smooth further increasing partial volume effects. The value of a voxel depends therefore on its neighbors and may even be driven by a surrounding nucleus. Even, a local increase in the BOLD value located in the exact location of the SCN would provide support but no proof that the SCN drives the signal.
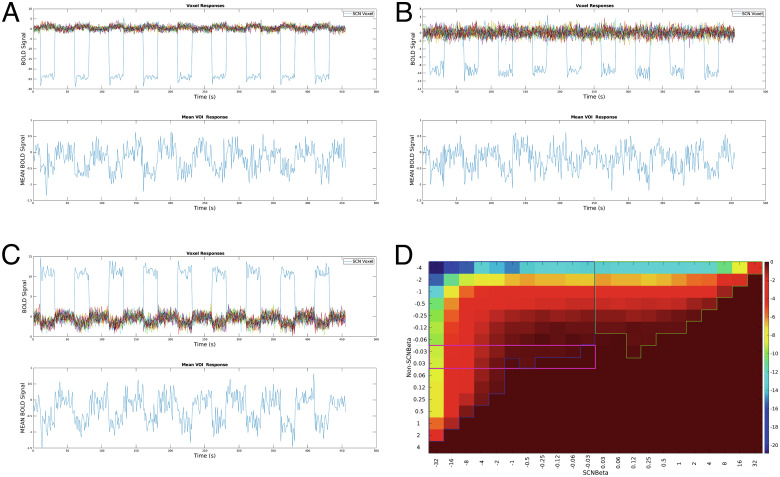
We further estimated that the amplitude of the BOLD signal induced by light should be ~15 times (output of a simulation (7); the exact value is not known) larger in the SCN than in the non-SCN structures to drive a deactivation over the entire VOI (Fig. 2). While this is possible, we show that most scenarios leading to the decrease in the BOLD signal over the VOI include signals from non-SCN structures and could even result from non-SCN structures showing decreased signals while the SCN presents increased signals (Fig. 2).
Fig. 2.
Simulation of BOLD signal change over a (3 × 4 × 3) mm3 VOI as used by Schoonderwoerd et al. to extract and average BOLD signal around the SCN. In the Top part of panels of A–C, we considered the BOLD signal change in the SCN (blue line), and in 13 surrounding non-SCN voxels, including additive noise, that could result in an overall decrease in BOLD signal when averaged over the VOI as displayed in the Bottom parts of panels of A–C. (A) The SCN shows a strong deactivation in response to light, while the non-SCN voxels show a slight activation; minimum SCN/non-SCN signal ratio = −15. (B) The SCN shows a strong deactivation in response to light, while the non-SCN voxels show no response; minimum SCN/non-SCN signal ratio = −24. (C) The SCN shows a strong activation in response to light, while the non-SCN voxels show deactivations; minimum SCN/non-SCN signal ratio = −7. (D) t-value map for the average signal in using different combinations of beta values of SCN and non-SCN voxels, along the horizontal and vertical axes, respectively (t-values > 0 are set to 0). A limited part of the scenarios corresponds to a decreased response in the SCN with no response in non-SCN surrounding structures (highlighted in purple). A substantial portion of scenarios correspond to diverse degrees of deactivations in SCN and non-SCN voxels (including larger deactivation in non-SCN structures) (highlighted in blue). Another substantial portion corresponds to activation of SCN and deactivations in the surrounding structures resulting in negative average value over the VOI (highlight in green).
These aspects, and others dealing with the fMRI sequence, statistics, and control procedures that, we detailed here (8), could contribute to the surprisingly reduced so-called SCN-response Schoonderwoerd et al. reported in response to light exposures of various wavelengths (λmax 470, 515, and 590 nm). As established notably by coauthors of Schoonderwoerd et al., the SCN is typically excited by light (9) particularly if it contains a large portion of blue-wavelength light (~460–480 nm) (6). Using positron-emission tomography (PET) in humans, a deactivation following exposure to light was reported around the putative suprachiasmatic area (10). This PET study cannot however be cited to corroborate findings obtained during light exposure.
In summary, the study of Schoonderwoerd et al. is truly original and opens interesting questions; their results should, however, be envisaged with care and cannot be used to recommend therapeutic light intervention.
Acknowledgments
Author contributions
R.S. and G.V. performed research; R.S. and C.P. analyzed data; R.S. and G.V. wrote the paper. All authors edited and approved the final version.
Competing interest
The authors declare no competing interest.
Contributor Information
Roya Sharifpour, Email: roya.sharifpour@uliege.be.
Gilles Vandewalle, Email: gilles.vandewalle@uliege.be.
References
- 1.Barron H. C., Mars R. B., Dupret D., Lerch J. P., Sampaio-Baptista C., Cross-species neuroscience: Closing the explanatory gap: Cross-species neuroscience. Philos. Trans. R. Soc. B Biol. Sci. 376, 20190633 (2021). [DOI] [PMC free article] [PubMed] [Google Scholar]
- 2.Schoonderwoerd R. A., et al. , The photobiology of the human circadian clock. Proc. Natl. Acad. Sci. U.S.A. 119, e2118803119 (2022). [DOI] [PMC free article] [PubMed] [Google Scholar]
- 3.Bumgarner J. R., Nelson R. J., Light at night and disrupted circadian rhythms alter physiology and behavior. Integr. Comp. Biol. 61, 1160–1169 (2021). [DOI] [PMC free article] [PubMed] [Google Scholar]
- 4.Ding S. L., et al. , Comprehensive cellular-resolution atlas of the adult human brain. J. Comp. Neurol. 524, 3127–3481 (2016). [DOI] [PMC free article] [PubMed] [Google Scholar]
- 5.M. L. Aranda, T. M. Schmidt, Diversity of intrinsically photosensitive retinal ganglion cells: Circuits and functions. Cell. Mol. Life Sci. 78, 889–907 (2021). [DOI] [PMC free article] [PubMed] [Google Scholar]
- 6.Brown T. M., Wynne J., Piggins H. D., Lucas R. J., Multiple hypothalamic cell populations encoding distinct visual information. J. Physiol. 589, 1173–1194 (2011). [DOI] [PMC free article] [PubMed] [Google Scholar]
- 7.Sharifpour R., Phillips C., Vandewalle G., BOLD-simulation. Available at GitLab. https://gitlab.uliege.be/CyclotronResearchCentre/Public/fasst/sharifpour_2022_codes. Accessed 14 July 2022.
- 8.Sharifpour R., et al. , Pitfalls in recording bold signal responses to light in small hypothalamic nuclei using ultra-high-field 7 Tesla MRI. (2022). SSRN:https://ssrn.com/abstract=4174993. Accessed 17 August 2022. [DOI] [PMC free article] [PubMed]
- 9.Meijer J. H., Watanabe K., Schaap J., Albus H., Détári L., Light responsiveness of the suprachiasmatic nucleus: Long-term multiunit and single-unit recordings in freely moving rats. J. Neurosci. 18, 9078–9087 (1998). [DOI] [PMC free article] [PubMed] [Google Scholar]
- 10.Perrin F., et al. , Nonvisual responses to light exposure in the human brain during the circadian night. Curr. Biol. 14, 1842–1846 (2004). [DOI] [PubMed] [Google Scholar]


