Abstract
Biomaterials serve as the basis of implants, tissue engineering scaffolds, and multiple other biomedical therapeutics. New technologies, such as single cell RNA sequencing (scRNAseq), are enabling characterization of the response to biomaterials to an unprecedented level of detail, facilitating new discoveries in the complex cellular environment surrounding materials. We performed scRNAseq and integrated data sets from multiple experiments to create a single cell atlas of the biomaterials response that contains 42,156 cells from biological extracellular matrix (ECM)-derived and synthetic polyester (polycaprolactone, PCL) scaffold biomaterials implanted in murine muscle wounds. We identified 18 clusters of cells, including natural killer (NK) cells, multiple subsets of fibroblasts, and myeloid cells, many of which were previously unknown in the response to biomaterials. To determine intra and intercellular signaling occurring between the numerous cell subsets, including immune-stromal interactions in the cellular response to biomaterials, we developed Domino (github.com/chris-cherry/domino), a computational tool which allows for identification of condition specific intercellular signaling patterns connected to transcription factor activation from single cell data. The Domino networks clustered into signaling modules and cellular subsets involved in signaling independent of clustering, defining interactions between immune, fibroblast, and tissue-specific modules with biomaterials-specific communication patterns. We then validated the results of Domino using an Il17ra−/− knockout model and found significant changes in gene expression for the transcriptional targets linked to IL17 by Domino. Further compilation and integration of biomaterials single cell data sets will delineate the impact of materials chemical and physical properties and biological factors, such as anatomical placement, age, or systemic disease, that will direct biomaterials design.
Introduction
Biomaterials serve as the basis of medical devices that first entered into clinical practice in the 1960s. After evidence of the body’s reaction to biomaterials emerged, the foreign body response (FBR) was defined and characterized. The FBR process initiates with an immune response and may develop into chronic inflammation and fibrosis around the implant1,2. This fibrosis is a major challenge in the design of therapeutic biomaterials. As the field of regenerative medicine and tissue engineering developed decades later, biomaterial design turned to building scaffolds that created a desired biological response, such as mobilizing stem cells, promoting vascularization and stimulating tissue development instead of causing FBR3. Biomaterial scaffolds are also employed as a tool to engineer tissue models to probe mechanisms of tissue development and disease, such as cancer in controlled three dimensional environments4. While previous foundational research described a number of key cell responses to biomaterials, recent technology development now enables an unprecedented ability to map cell responses and tissue composition. Armed with a comprehensive understanding of the cells responding to biomaterials, the local tissue environment, and cell interactions, we can better design biomedical implants and tissue engineering scaffolds to avoid FBR and understand mechanisms of clinical adverse events.
Developments in high parametric flow cytometry are expanding the tools available to evaluate which cells are responding to implantation of biomaterials based on expression of protein surface markers characteristic of a specific cell type. This technology enabled the discovery of more rare cell types responding to biomaterial implants, such as, CD4+ T helper cells expressing interleukin (IL)-4 and IL17 and B cells5,6. Single cell RNA sequencing (scRNAseq) is another method that can be applied to evaluate responses to biomaterials that uses unbiased identification of groups of cells based on gene expression without any a priori knowledge of cellular phenotypes or markers7. The resulting clusters of cells can be phenotyped based on their gene expression profiles and mapped back to experimental condition. scRNAseq has transformed experimental approaches and understanding in cancer8, autoimmunity9,10, and infection responses11,12 but has not been widely applied to biomaterials. Application of scRNAseq to the biomaterials response will provide new understanding of cellular response that may transform their design.
Cells from the innate and adaptive immune system respond to biomaterials when they are implanted in the body. Subsequently, fibroblasts are activated and programs of fibrosis and/or tissue repair develop. The communication network between the immune and stromal compartments in the cellular response to biomaterials is unknown. The application of scRNAseq introduces even more cell types that contribute to the response to biomaterials, creating a complex network of communication in the tissue. Reconstruction of cellular communication networks (ligand-receptor activity) from scRNAseq data sets can provide insight into tissue microenvironments and physiological responses despite missing cell types and limited sequencing depth to elucidate biological mechanisms and potential therapeutic targets. Computational tools currently available for ligand-receptor signaling analysis of scRNAseq data sets correlate expression of ligands and receptors across groups of cells with no phenotypic connection13–15 or require an a priori gene set16. Use of this method to identify signaling pathways connected with downstream phenotypic changes is not possible without a previously defined gene set which is not currently available for responses to biomaterials.
Here, we applied scRNAseq to biologic and synthetic biomaterial scaffolds implanted in muscle defects. We used integration techniques similar to those from the Human Cell Atlas17 and the Tabula Muris Consortium18 to pool multiple single cell data sets including sorted cells and to provide a single cell atlas of response to biomaterials. We believe the atlas and analysis techniques detailed here will provide a foundation for integration with data sets from other biomaterials and tissues in the future. The resulting atlas contains ~42,000 cells from a single murine wound model treated with both biologic and synthetic biomaterials. We identified new cell types responding to synthetic and biologic biomaterials and determined cell types not captured for single cell analysis through flow cytometry comparisons. To reconstruct cell communication networks that develop in response to biomaterials, we developed Domino, a computational program that reconstructs intracellular communication based on transcription factor activation. We link transcription factor activation with expression of receptors and their possible ligands. This process generates signaling hypotheses with specific, testable downstream biological function through transcription factor activation in specific cell types. Application of Domino to the biomaterials atlas defined signaling modules for stromal, immune, and tissue-specific cells independent of clustering. The signaling predictions identified validated signaling and identified new pathways associated with regeneration and fibrotic wound healing. To validate Domino’s use in other contexts, we applied it to a previously published dataset from Alzheimer’s patients19 and identified new signaling pathways specific to diseased or healthy brain.
Results
A single cell atlas of the biomaterials tissue microenvironment
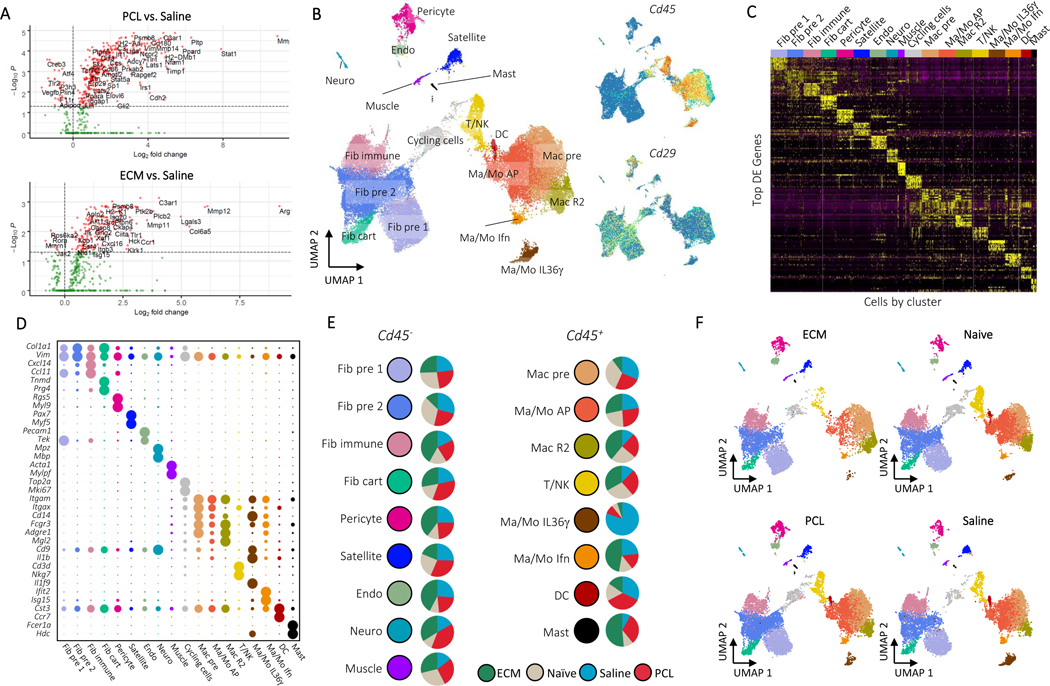
To construct a single cell atlas of the biomaterials microenvironment, we integrated single cell RNA sequencing (scRNAseq) data sets from multiple experiments and different cell preparations. Synthetic and biologic scaffolds were implanted in a murine model of volumetric muscle loss (VML) and compared to wound alone. The VML injury provides a combination of tissue damage and response to biomaterials and provides a pocket for biomaterial implantation20. A biologic scaffold derived from the extracellular matrix (ECM) of small intestinal submucosa (SIS) served as a model for a scaffold used in preclinical and clinical application of tissue repair that induces a Type 2 immune environment6,21. We evaluated polycaprolactone (PCL) as a model synthetic biomaterial. While the bulk form of PCL is a component of medical devices, we used a particulate form of PCL to fill the small murine tissue defect. PCL induces a Type 17 immune environment and fibrosis1,5. When the ECM and PCL materials are implanted in muscle, they induce significant changes in gene expression in the bulk tissue as measured by Nanostring™ after 1 week (Fig. 1A). Of the 770 genes that were tested, 397 were differentially expressed between PCL and saline and 194 between ECM and saline. Of the differentially expressed genes, 216 were unique to PCL and 13 were unique to ECM, confirming that the biomaterials induced different responses at the global tissue level (Supplementary Table 1). The differential functional outcomes in tissue morphology in response to the two materials is visible histologically 6 weeks after implantation in the model (Extended Data Fig. 1A) with the ECM implants showing injury resolution and muscle fibers while PCL treated wounds demonstrate increased collagen fibers and fibrosis similar to previously published results.
Figure 1: A Single Cell Atlas of the Biomaterials Immune Microenvironment.
A, NanoString gene expression analysis of mRNA isolated from whole muscle samples of animals treated ECM or PCL compared to saline treated animals. nSolver© software with default parameters was used for statistical testing with adjusted P ≤ 0.05 defining differential expression. B, Overview of cell clusters identified in the composite scRNAseq dataset. UMAP plots with cluster labels (left) and gene expression levels of Cd45 and Cd29 (right) are shown. C, Heatmap of up to 10 differentially expressed genes with highest log fold-change from each cluster. Cells are ordered and labeled by cluster with random sampling of up to 100 cells per cluster to ensure visibility of small clusters. D, Gene markers for single cell subsets. The dotplot shows expression of genes associated with cluster identity. Cluster averaged gene expression values after normalization to the maximum averaged expression are shown. E, Composition of cluster by condition. Cluster labels and colors are shown adjacent to pie charts of normalized number of cells by condition. Prior to comparison of conditions, cells were normalized to the total number CD45+ or CD45- cells by sample. The resulting values are compared across condition. Cycling cells are not shown. Only samples from non-sorted samples were used to calculate proportions (see methods). F, Visualization of cells by condition on UMAP. Each UMAP shows cells only from a given condition colored by cluster.
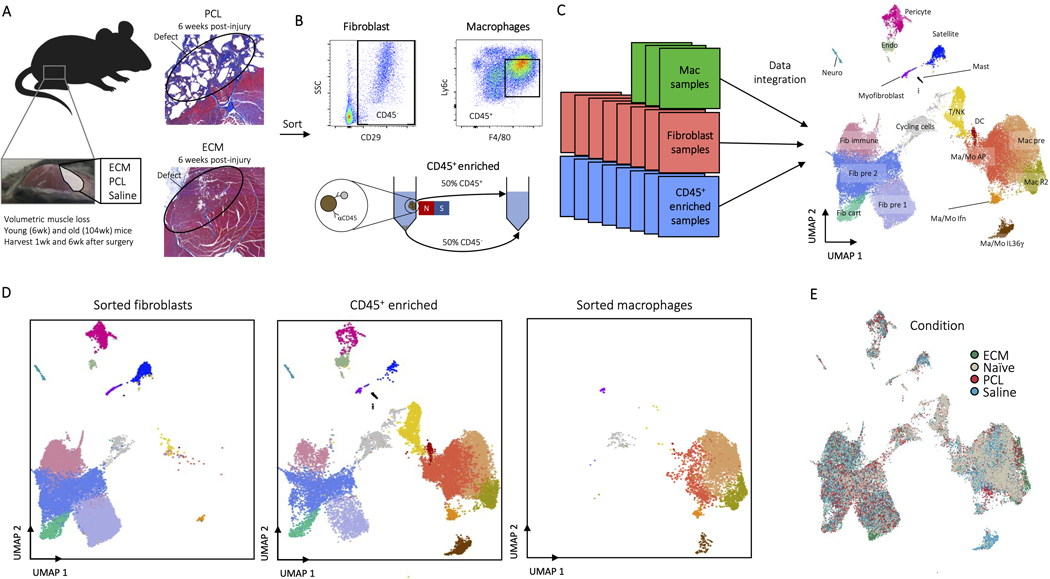
To generate the scRNAseq data sets we created single cell suspensions from the muscle tissue with and without biomaterials for application to 10X and Drop-seq. Single cell suspensions from whole tissue preparations were enriched for CD45+ cells to enable capture of less frequent cell populations and processed with Drop-seq. Fluorescence activated cell sorting (FACS) was used to apply mesenchymal/fibroblasts (CD45-CD19-CD31-CD29+) to Drop-seq. Finally, a previously published data set of sorted macrophages (CD45+F4/80hi+Ly6c+CD64+) was included22 (Extended Data Fig. 1A-C). Most samples collected were from young mice (6 week old at time of surgery) during the acute phase of injury one week after surgery. A detailed description of age, time of harvest, treatment, and sorting methodology for each of the samples in the atlas is provided in Supplementary Table 2. The resulting dataset includes 42,156 cells with an average of 198,000 reads and 1,167 genes per cell after filtering low-quality cells and genes across multiple time points and ages. To determine whether the integration of sorted cell data sets caused biases with clustering due to increased numbers of the sorted cell populations, we compared outcomes of the whole tissue analysis with and without the sorted cell data sets (Extended Data Fig. 1D). While inclusion of the macrophage and fibroblast sort data increased these populations and their resolution, cell populations present only in the unsorted dataset maintain clear, distinct phenotypes by both clustering and UMAP. The integrated dataset, including cells from sorted and CD45+ enriched whole tissue single cell suspensions, is used for all subsequent analyses.
Identification of immune and stromal single cell clusters in the response to biomaterials
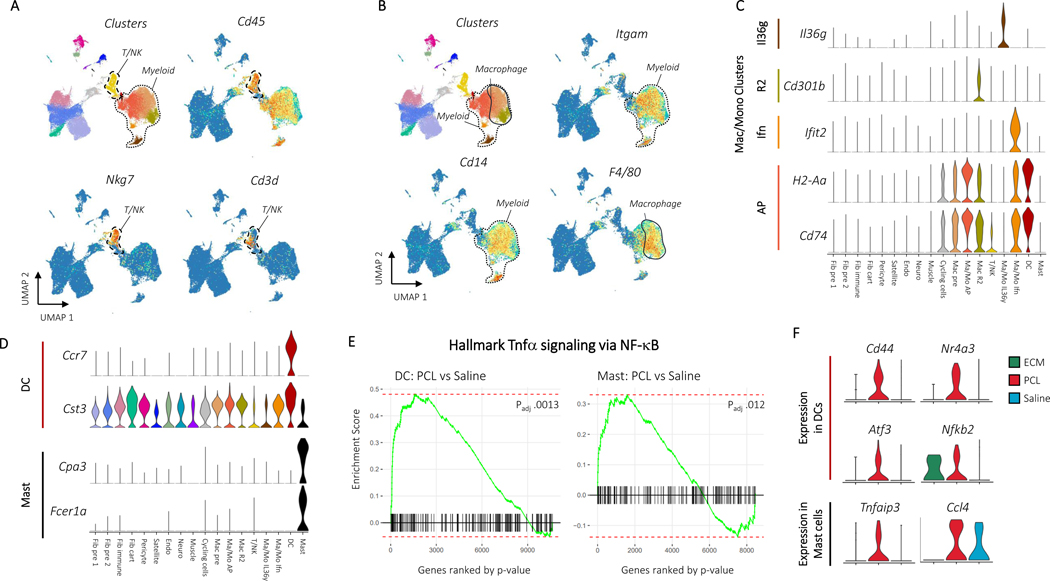
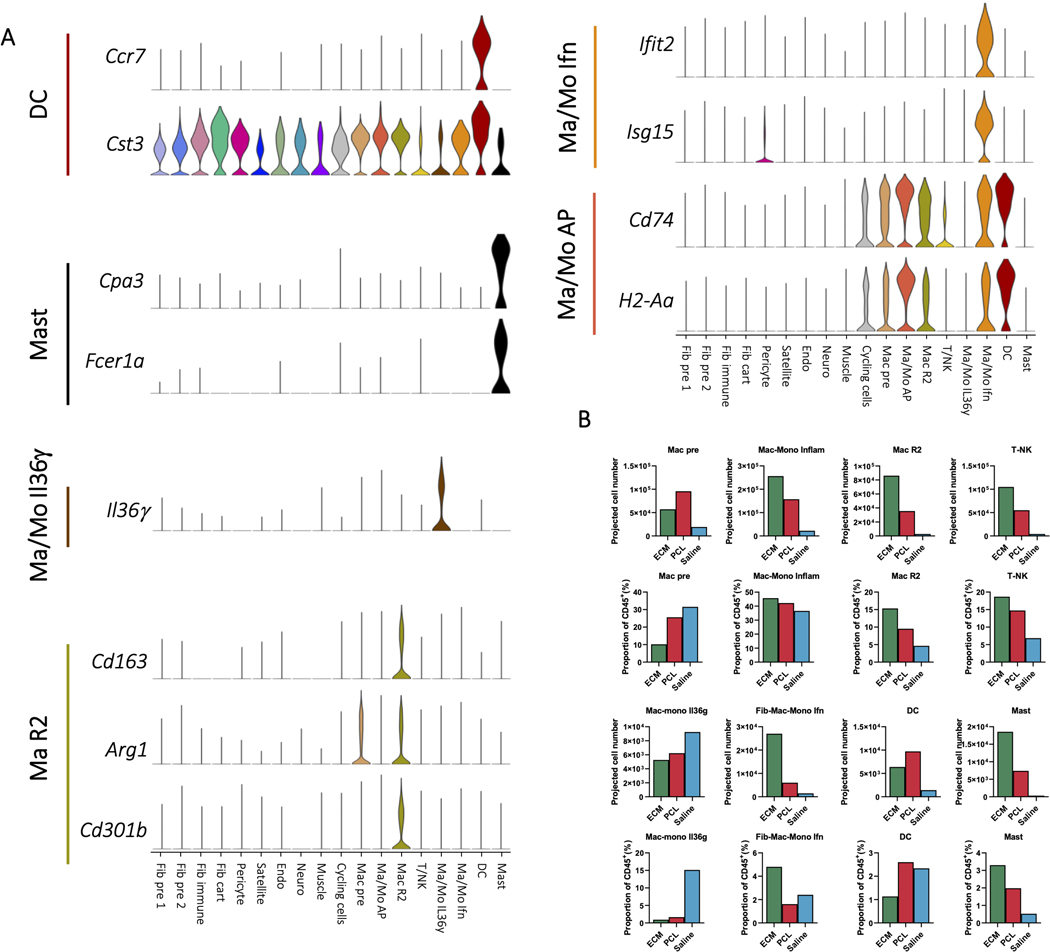
Unsupervised clustering identified 18 distinct clusters: nine CD45- clusters, eight CD45+ clusters, and one cluster of cycling cells with both CD45+ and CD45- cells (Fig. 1B). We used expression of canonical marker genes, as well as similarity of gene expression profiles, to classify clusters (Fig. 1C, D, Supplementary Table 3). The CD45+ clusters included a mixed cluster of T and natural killer (NK) cells (Cd3d, Ngk7) (T/NK), dendritic cells (Ccr7, Cst3) (DC), and mast cells (Cpa3, Fcer1a, Hdc) (Mast), as well as five clusters of monocytes and/or macrophages (Cd11b, Cd14, Adgre1) (Fig. 2A-B). The myeloid clusters were composed of an anti-inflammatory macrophage cluster (Cd163, Retnla) (Mac R2), a cluster performing antigen presentation (Cd74, H2-Ab1) (Mac/Mo AP), a type 17 inflammatory cluster (Il36γ) (Mac/Mo Il36γ)22, and a cluster of cells showing response to interferons (Ifit2, Isg15) (Mac/Mo Ifn) (Fig. 2C, D, and Extended Data Fig. 2A). To determine differences in gene expression profiles associated with different scaffold materials, we compared cells from an ECM or PCL treated wound with saline treated cells with in each cluster using differential expression. We then used gene set enrichment analysis with Hallmark gene sets to identify how phenotypes of each cluster changed with respect to untreated injury (saline) and then compared the enriched sets for PCL and ECM, identifying sets of genes that are uniquely varying in one of the two conditions (Supplementary Table 4). In both mast and dendritic cells, tumor necrosis factor alpha (TNF-α) signaling increased only in the PCL environment (Fig. 2E). A number of genes associated with TNF-α signaling and inflammation were also uniquely expressed in the PCL treated dendritic and mast cells (Fig. 2F).
Figure 2: CD45+ cells drive inflammation in response to synthetic materials A, Immune markers for T and NK cells.
Clusters are shown adjacent to Cd45, Nkg7, and Cd3d gene expression. The T/NK cell cluster and myeloid clusters are circled with dotted outlines. B, Gene expression for myeloid and macrophage cell markers. Clusters are shown adjacent to Itgam, Cd14, and F4/80 gene expression. Myeloid and macrophage clusters are circled and labeled. Gene expression for cluster specific monocyte, macrophage, dendritic cell, and mast cell markers are then shown in C and D. E, Plots of enrichment scores comparing cells from differing conditions within myeloid clusters with the Broad Institute’s Hallmark TNFa signaling via NFkB gene set. Genes were ordered by –log(p) after differential expression with MannWhitney U test between PCL and Saline cells from the dendritic cell (left) or mast cell (right) clusters. A larger enrichment score indicates over-representation of the gene set within the differentially expressed genes and a negative score indicates under-representation. Adjusted pvalues are after Benjamini-Hochberg correction of p values from fgsea. F, Gene expression for leading edge genes from gene set enrichment analysis in E. Violin plots show expression for dendritic cells (top) or mast cells (bottom) grouped by treatment condition.
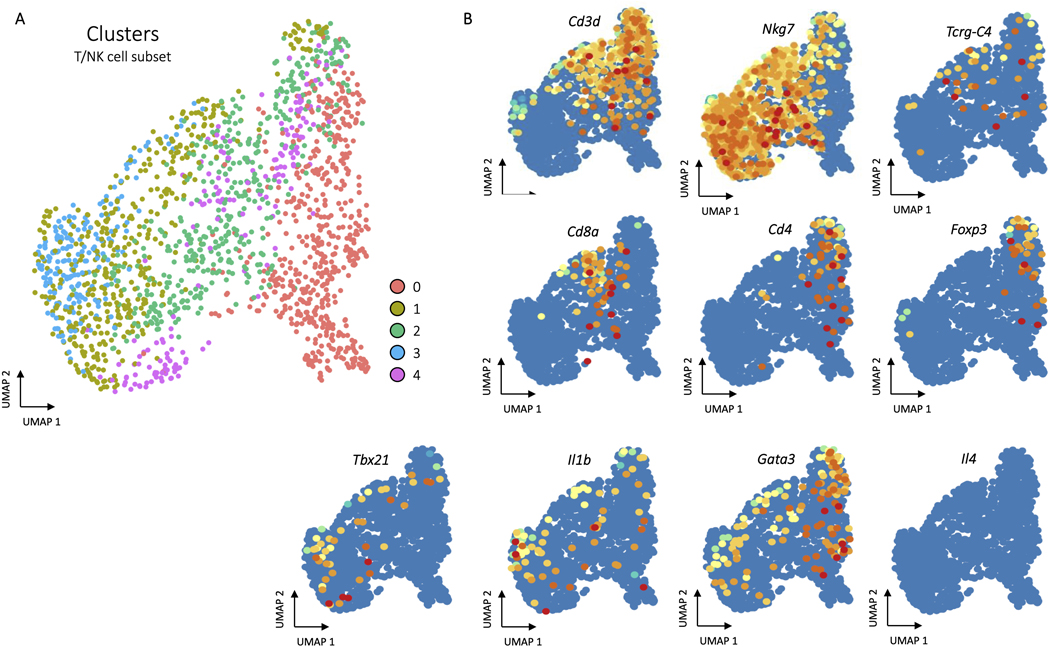
The T cell/NK cell subset included cells expressing Cd4, Cd8, Foxp3, and γδ markers, but there was not adequate expression resolution to differentiate other T cell functional populations like Type 2 or Type 3 T cells using common cytokine markers Il4 and 1l17 or transcription factors Gata3, or Rorc which were either not detected in our data set or had dispersed expression patterns across all T cell subsets (Extended Data Fig. 3). From flow cytometry data, including intracellular staining, there were CD4+ T cells and gamma deltas expressing different cytokines in the cellular response to biomaterials that were not captured with scRNAseq5,6. This is consistent with other publicly available single cell datasets that do not differentiate effector T cells and recent evidence that only low throughput sorting based scRNAseq techniques like SMART-Seq2 capture expression of these rare transcripts23,24. This further supports the need to integrate flow cytometry and single cell analysis to fully capture the immune profile in tissues.
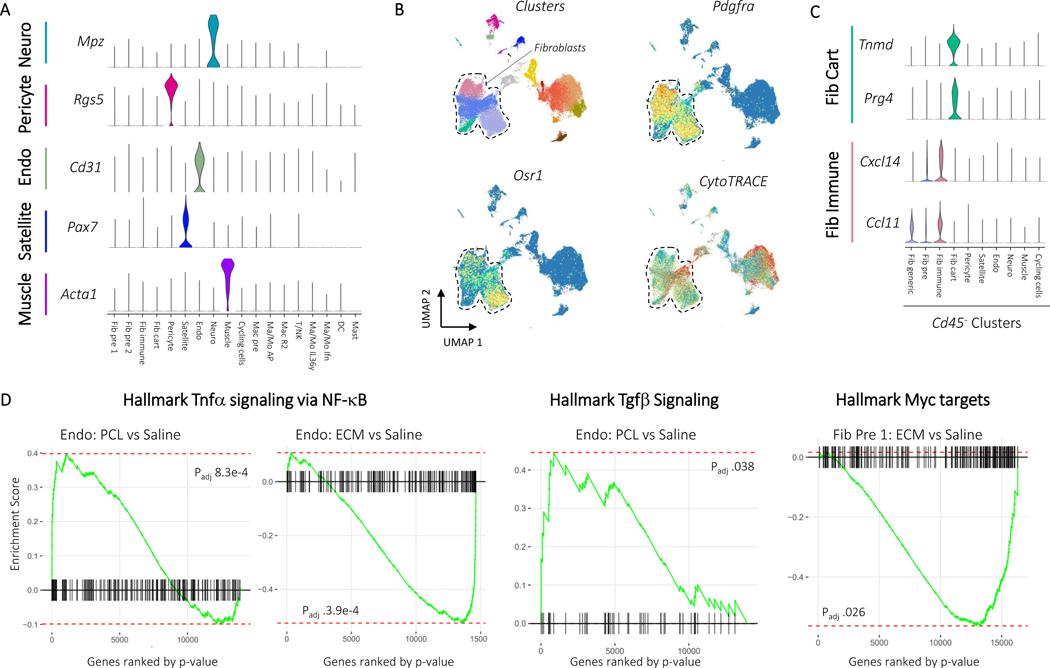
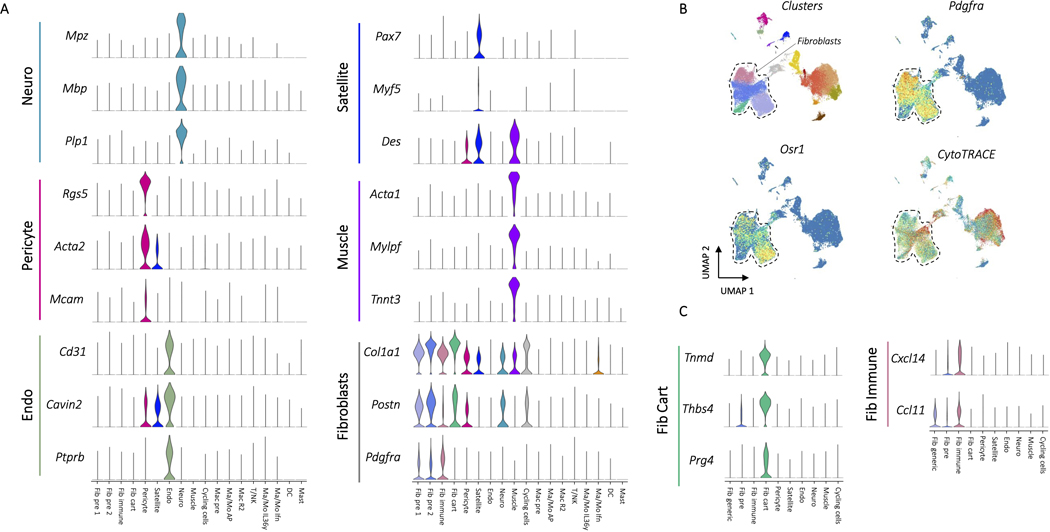
The CD45- clustering identified multiple types of mesenchymal, stromal, and fibroblast-like cells. Five clusters were identified as involved in specialized tissue formation, including Schwann cells (Mpz, Mbp, Plp1) (Neuro), pericytes (Rgs5, Acta2, Mcam) (Pericyte), endothelial cells (Cd31, Cavin2, Ptprb) (Endo), satellite cells (Pax7, Des, Myf5) (Satellite), and myoblasts (Acta1, Tnnt3, Mylpf) (Muscle), as well as four clusters of fibroblasts (Col1a1, Pdgfra, Postn) (Fig. 3A). Two of the fibroblast clusters expressed Osr1 (Fig. 3B), a transcription factor indicating stemness25. CytoTRACE, an algorithm used to score cells for stemness, gave high stemness scores to the same two clusters (Fig. 3B), suggesting these two populations serve a stem-like role in the wound environment (Fib pre 1, Fib pre 2). Of the remaining two fibroblast clusters, one appeared cartilage-like based on expression of Tnmd, Thbs4, and Prg4 (Fib cart) and one appeared to be involved in immune regulation based on expression of cytokines Cxcl14 and Ccl11 (Fib immune)(Fig. 3C and Extended Data Fig. 4). Like the immune populations, we used differential expression to identify genes that changed with ECM or PCL treatment compared to saline within each of the stromal clusters (Supplementary Table 4). Interestingly, gene set enrichment analysis identified a robust increase in TNF-α signaling in PCL treated endothelial cells with respect to saline while endothelial cells from an ECM treated wound showed a strong decrease in TNF-α signaling (Fig. 3D). TNF-α signaling has previously been shown to inhibit wound healing26. Combined with the enrichment of the TNF-α gene set in PCL treated myeloid cells, these findings suggest that TNF-α in response to synthetic materials drives inflammation and inhibits wound healing. Further, endothelial cells from a PCL treated environment were enriched for transforming growth factor beta (TGF-β) signaling. TGF-β signaling is active in fibrotic environments like the foreign body response27. Finally, Myc signaling, which has been associated with chronic wounds28, was only decreased in fibroblast precursor cells from an ECM treated wound, suggesting that decreased Myc signaling may play a role in the decreased fibrosis associated with biologic scaffolds by influencing fibroblast differentiation (Fig. 3E).
Figure 3: Myc activation and TGF-β signaling influence fibroblast differentiation in response to materials.
A, Marker gene expression for non-fibroblast CD45- cell populations. Up to three characteristic gene markers are shown for each cluster by violin plot of normalized gene expression data. Fibroblast markers were used to identify the four fibroblast clusters Fib pre 1, Fib pre 2, Fib immune, and Fib cart. B, Stemness markers for fibroblasts. Pdgfra expression and clusters are shown to demonstrate location of fibroblasts with a dotted line drawn surrounding the fibroblasts. Stem marker Osr1 and CytoTRACE score, an algorithm used to score cells for stemness, is shown below. C, Expression of characteristic markers for the tenocyte-like and immune fibroblast clusters. D, Gene set enrichment for intracluster differential expression using Hallmark gene sets. Genes were ordered by –log(p) after differential expression with Mann-Whitney U test comparing PCL or ECM to saline. A larger enrichment score indicates over-representation of the target gene set and a negative score indicates under-representation. P values are from fgsea after Benjamini-Hochberg correction.
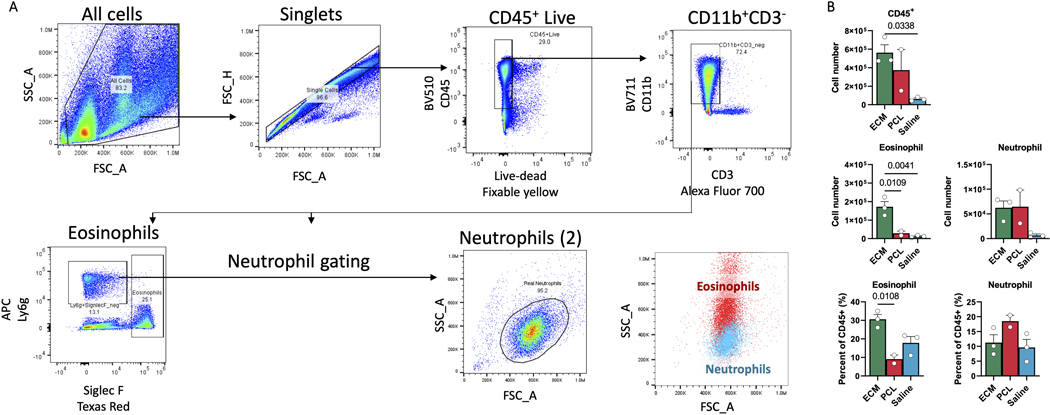
While single cell identified new populations in the cellular response to biomaterials, comparison of the scRNAseq dataset with multiparametric flow cytometry revealed several populations that were missing or underrepresented. Both eosinophils and neutrophils that comprise a large portion of the CD45+ population in ECM and PCL, respectively (Extended Data Fig. 5), were not captured in the single cell analysis. Recent work on granuloctyes, including basophils and neutrophils, demonstrate the challenge in capturing these cells and the requirement for additives to preserve their integrity for single cell29–31. The lymphoid populations in our single cell dataset were also limited compared to flow cytometry.
We next examined differences in cellular composition of clusters in the ECM and PCL environments. The number of cells in a particular cluster varied depending on experimental condition and biomaterial (Fig. 1E, F, and Supplementary Table 5). In particular, there were considerably more endothelial cells, mast cells, and anti-inflammatory macrophages (Mac R2) in the ECM implants compared to other conditions. The anti-inflammatory population has been associated with regeneration previously22, and increased endothelial cell populations may suggest increased vascularization which has been associated with regeneration32. The saline condition contained most of the Il36γ producing myeloid population. IL36γ producing myeloid populations have been previously shown to be dependent in IL17 signaling in wound healing22. Cell population comparisons in different experimental groups changed substantially when the total number of CD45+ cells from flow cytometry is used to predict total cell number for each of the CD45+ clusters (Extended Data Fig. 2C). Many clusters with similar proportions among the conditions, such as the inflammatory myeloid (Mac-Mono Inflam), have drastic differences in predicted cell number due to the ~10 fold increase in CD45+ cell number in the ECM environment compared to saline as determined by flow cytometry.
While there were proportional differences and signs of gene expression changes between some clusters in the different biomaterial environments, additional factors beyond cell composition may be responsible for the phenotypic differences observed experimentally between PCL and ECM environments. We hypothesized that differences in signaling between cells or groups of cells in the different biomaterial-tissue environments may be critical for determining the divergent physiological outcomes in these materials. Furthermore, differences in signaling and transcriptional activation may capture changes resulting from epigenetic and other changes that are not detected in standard single cell expression analysis.
Development of a computational program to generate inter- and intracellular signaling networks from single cell RNA sequencing data
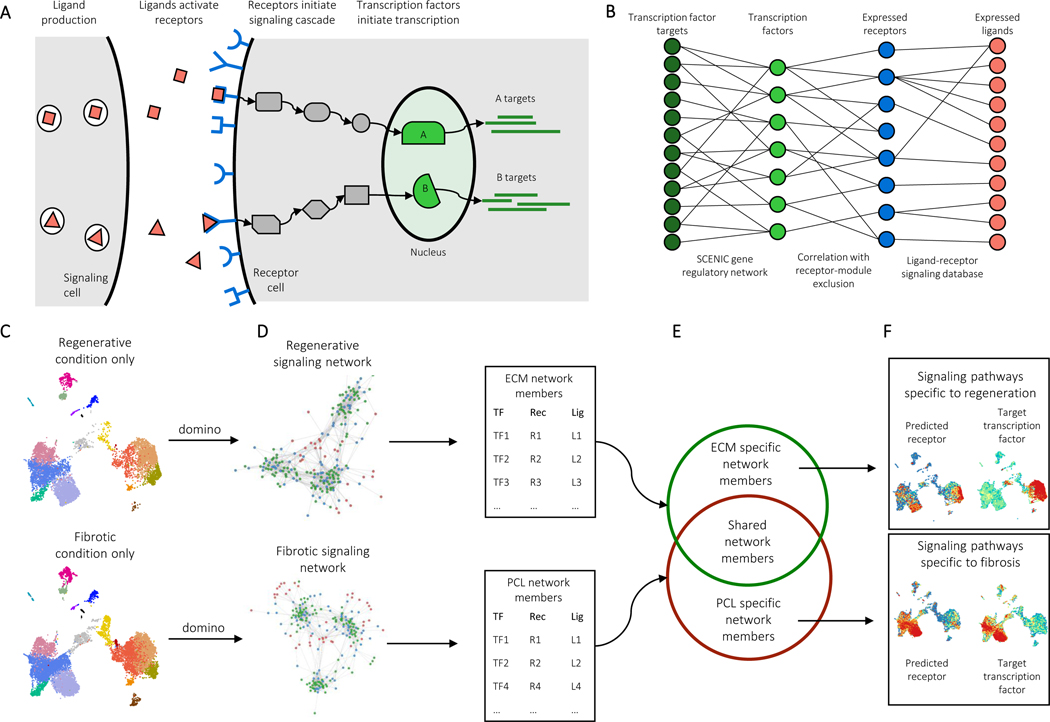
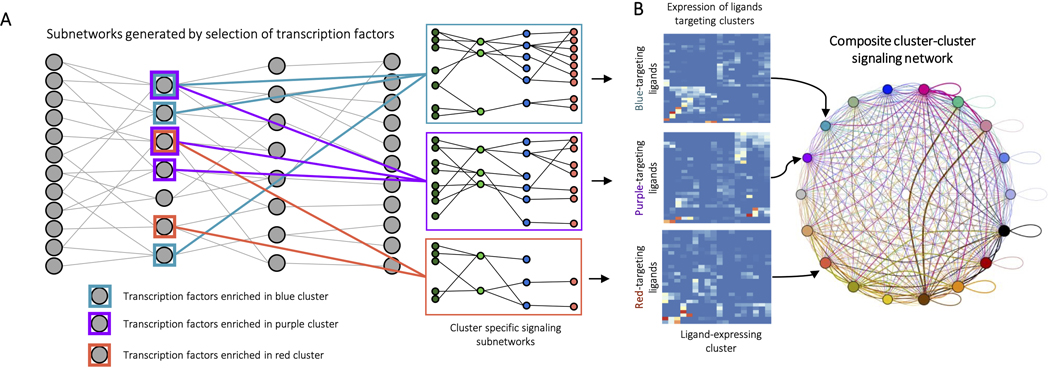
To further analyze the biomaterial single cell dataset, we developed a program to generate inter- and intracellular signaling networks. Intercellular communication can be modeled as the result of four biological steps (Fig. 4A). Ligands (L) are produced by signaling cells, ligands bind to and activate receptors (R) on target cells, receptor activation triggers a signaling cascade, and transcription factors (TF) at the end of the cascade initiate transcription of specific genes. These transcriptional changes then lead to phenotypic changes in the target cell population. Domino reconstructs cell communication events in reverse to identify signaling connected with specific changes in transcription factor activity (Fig. 4B).
Figure 4: Generation of intercellular and intracellular signaling networks.
A, A model of biological ligand-receptor signaling. Ligands expressed in a signaling cell bind and activate receptors on a target cell. Subsequent protein-protein signaling triggers activation of transcription factors in the nucleus and expression of target genes. B, Reconstruction of a dataset-wide signaling network. SCENIC is used to estimate transcription factor gene regulatory modules, as well as transcription factor activation scores on a cell-by-cell level. Receptors expression levels are correlated with transcription factor activation scores across the entire dataset with exclusion of receptors present in the transcription factor modules. Public receptor-ligand databases and then queried to identify ligands capable of activation receptors. C, Identification of condition specific signaling patterns. In order to identify signaling specific to experimental conditions, the dataset is first split by condition, for example PCL and ECM treated cells. Domino is run on each to identify a signaling network specific to each condition. D, Members of signaling networks represent transcription factors, receptors, and ligands that are predicted as active in each condition. E, Comparison of network members from each condition identifies transcription factors, receptors, and ligands that are only predicted as active in one condition. F, Condition specific members can be used to identify signaling pathways which are only active or are differentially activated in an experimental condition.
The signaling networks that Domino constructs can be used to identify signaling specific to experimental condition. The dataset is first split by condition, for example, cells from ECM-treated tissue and cells from PCL-treated tissue (Fig. 4C). We then generate a signaling network for each treatment, containing all TF, R, and L predicted to be active in each condition (Fig. 4D). We compare the two networks to identify members specific to each (Fig. 4E), identifying TF, R, and L predicted as active in only one condition. The network members active in only one condition can then be used to identify signaling pathways that are specific to that condition (Fig. 4F).
To reconstruct cell communication, Domino first uses the SCENIC gene regulatory network analysis pipeline33 to generate transcription factor activation scores from raw counts data. SCENIC uses transcription factor expression as input data with a gradient boosting machine (GBM) to predict gene expression of other genes. It extracts co-expression modules from the fitted GBM, prunes the modules for presence of cis-regulatory motifs upstream of target genes on the genome, and scores gene regulatory networks on a cell-by-cell basis with area under the recovery curve across the ranking of genes in a cell. Second, Domino connects transcription factor scores with receptor expression using Pearson correlation. Receptors highly correlated with transcription factors are potential candidates for activation of TFs. To ensure correlation is not due to transcription factor targeting of the receptor, Domino excludes receptors found that are predicted as targets of specific transcription factors. Finally, CellphoneDB, a publicly available ligand-receptor database13, is queried to identify potential ligands for receptors.
The L-R-TF linkages that Domino assembles from the cell communication reconstruction form a global signaling network for the dataset irrespective of any clustering. This independence from clustering allows for unsupervised exploration of L-R-TF activation in single cell data sets. Because Domino starts from activated transcription factors instead of receptors or ligands like other programs, signaling pathways in a target cell population can be identified in the absence of ligand expression which may not be captured by single cell analysis. The process also naturally selects for receptors which are more likely to be activated in vivo, rather than looking at all expressed receptors. Further, transcription factors are typically well documented in literature, making connection of specific ligand-receptor pairs with a hypothesized biological change possible. While generation of the signaling network is independent of clustering information, cluster labels can be used to generate an intercluster signaling network if desired (Extended Data Fig. 6).
Domino identifies signaling patterns associated with biomaterial conditions
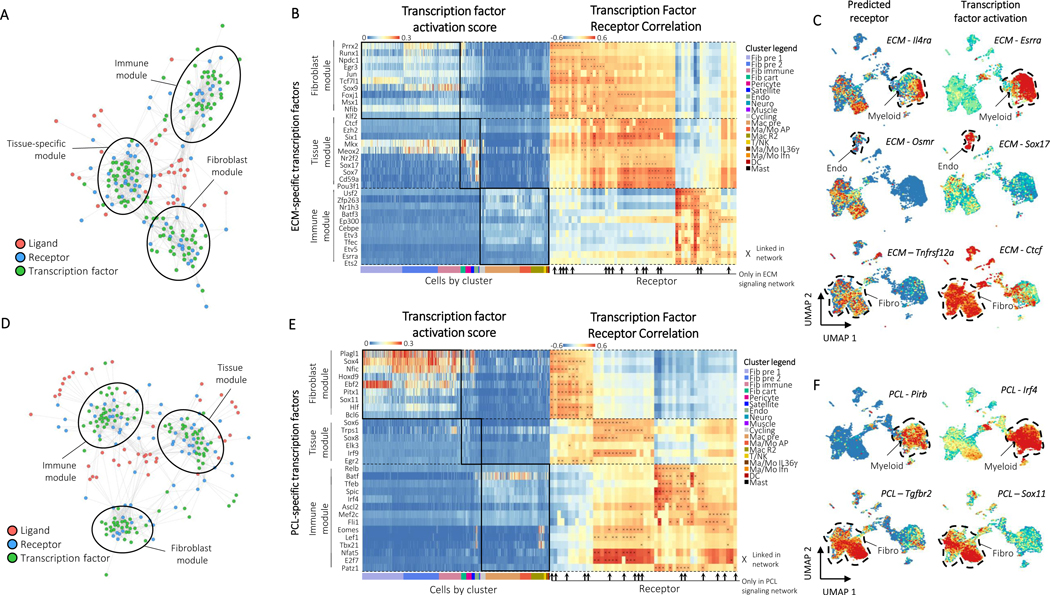
We then applied Domino to the biomaterials atlas to determine global signaling networks for the ECM (Fig. 5A) and PCL (Fig. 5D) tissue environments. Labeled, high resolution networks are available as supplementary files. Both the ECM and PCL signaling networks, receptors, and transcription factors clustered into modules of signaling in fibroblasts, immune cells, or tissue-specific cells when visualized with a force-directed graph. This clustering represents unsupervised assembly of both signaling patterns, as well as groups of cells involved in each signaling pathway, and demonstrates the importance of communication between immunestromal-tissue cell modules.
Figure 5: Domino identifies biomaterials condition specific signaling.
A, The ECM global signaling network. Three modules of receptors and transcription factors are readily apparent and labeled based on enrichment of transcription factors by cluster. B, Heatmaps of transcription factor activation score for ECM-specific transcription factors (left) and correlation of transcription factor activation score with receptor expression (right). Transcription factors are binned according to their membership to the fibroblast, tissue, or immune modules from the ECM global signaling network. Cells are ordered and colored according to their cluster. Receptors found only in the ECM condition are marked with arrows. Connections between receptor and transcription factors are marked with an ‘x’ on the correlation heatmap. C, Example feature plots of gene expression and activation scores for specific receptor-transcription factor pairs identified by domino in the ECM condition. D, The PCL global signaling network. Three modules of receptors and transcription factors are readily apparent and labeled based on enrichment of transcription factors by cluster. E, Heatmaps of transcription factor activation score for PCL-specific transcription factors (left) and correlation of transcription factor activation score with receptor expression (right). Transcription factors are binned according to their membership to the fibroblast, tissue, or immune modules from the PCL global signaling network. Cells are ordered and colored according to their cluster. Receptors found only in the PCL condition are marked with arrows. Connections between receptor and transcription factors are marked with an ‘x’ on the correlation heatmap. F, Example feature plots of gene expression and activation scores for specific receptor-transcription factor pairs identified by domino in the fibrotic (PCL) condition.
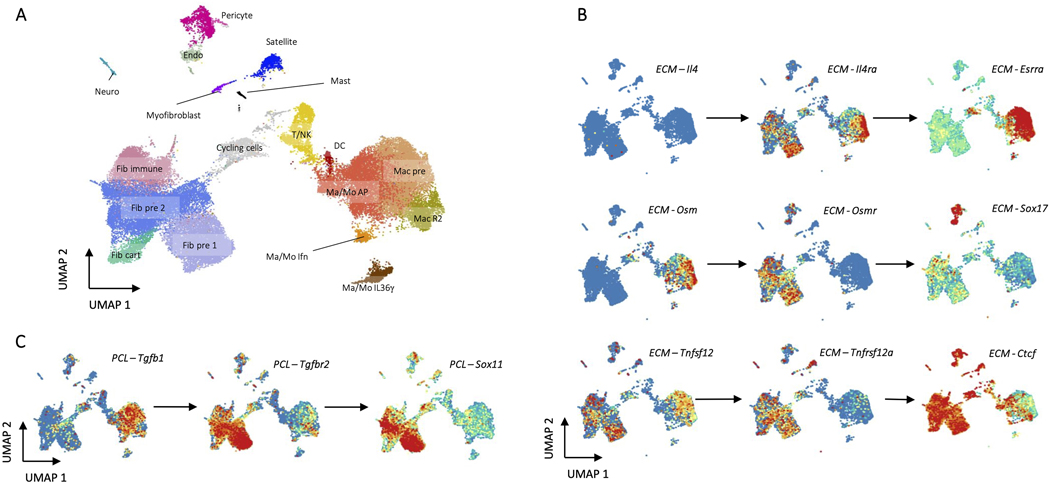
ECM specific transcription factors were enriched in fibroblasts, tissue-specific cells, and immune cells according to their modules as predicted by Domino (Fig. 5B). Many of their predicted receptors were specific to the ECM signaling network. Taken together, these pairs of transcription factors and receptors represent a number of signaling pathways which may be specifically activated in response to ECM (Fig. 5C). We show Esrra as a downstream target of Il4ra in myeloid cells in ECM, confirming alternative activation of macrophages. Esrra activates anti-inflammatory macrophages34 which are induced by IL4 and have been shown to be active in response to ECM. While there is nearly no detectable Il4 in the single cell dataset (Extended Data Fig. 7B), we were able to detect signaling through Il4ra because we base signaling on activation of transcription factors. IL4 has been shown to be abundant in the ECM environment21 but is likely not detected in the single cell dataset due to dropout as the primary IL4 producers are eosinophils, TH2 cells, and potentially ILC2s6,35,36.
We further show activation of Sox17 in endothelial cells linked to expression of the receptor Osmr activated by Osm (Fig. 5C) from myeloid populations (Extended Data Fig. 7B). Sox17 has been shown as critical for endothelial cell proliferation in response to injury37 but has not been identified in ECM response. This signaling may be responsible for the increased proportion of endothelial cells in ECM and posits a mechanism for myeloid involvement in wound healing and a critical immune-tissue module communication. Finally, we also identify activation of Ctcf, a muscle-specific transcription factor38, in fibroblasts linked to Tnfrsf12a or TweakR, recently shown to improve burn wound healing39. The ligand for TweakR, Tnfsf12 or Tweak, has elevated expression in both fibroblast and macrophage populations (Extended Data Fig. 7B). To our knowledge, TweakR has not been demonstrated as active in the ECM response. These three findings identify IL4, OSM, and TWEAK signaling pathways between fibroblasts and myeloid cells as potential therapeutic targets to promote regenerative wound healing and highlight the importance of immune-tissue module signaling.
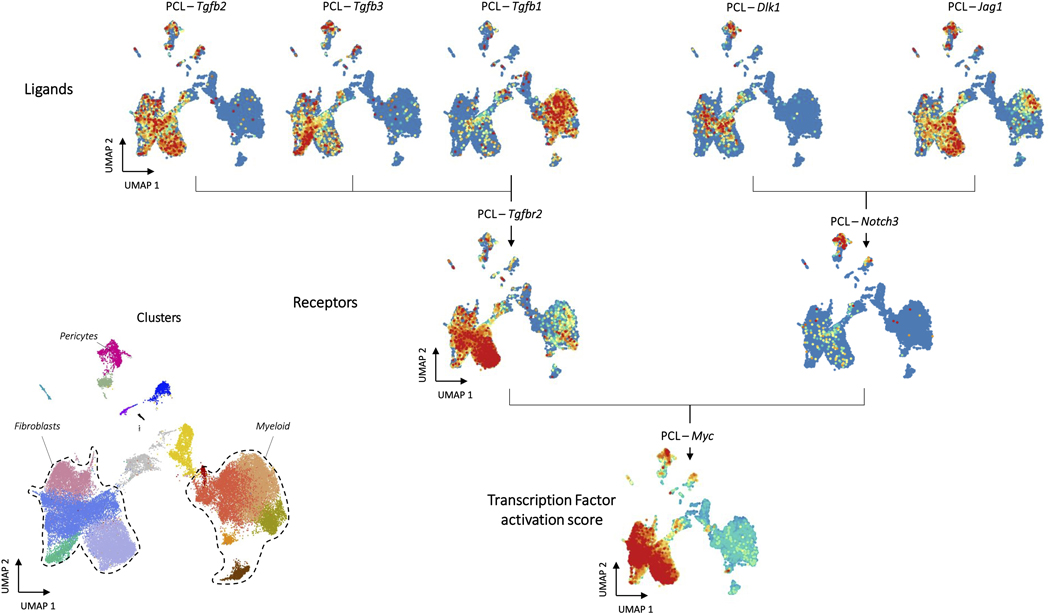
The PCL specific transcription factors and their predicted receptors were also organized by enrichment in specific cell modules (Fig. 5E). In contrast to ECM, the PCL transcription factors associated with tissue-specific cell subsets had modest to low expression levels suggesting less activation of the tissue module (Fig. 5E). Instead, the tissue-specific module shared expression patterns similar to fibroblasts which may suggest suppression of tissue-specific regenerative programs. We first used Domino to examine signaling patterns associated with Myc or TGF-β signaling, the signaling patterns enriched in the PCL treated environment by differential expression and gene set enrichment analysis (Extended Data Fig. 8). Domino identified TGF-β signaling upstream of Myc in fibroblast precursors. It further identified Notch3 as a potential regulator of Myc signaling in endothelial cells. Interestingly, Notch signaling through Notch3 between synovial fibroblasts and endothelial cells has been shown to drive inflammation in rheumatoid arthritis40. Our findings suggest that this signaling pathway is also active in the PCL-treated wound and further that it functions through activation of Myc in target populations.
Domino also identified a linkage between Tgfbr2 and both Sox11 and Sox4 (Fig. 5F) in fibroblasts triggered by Tgfb1 produced by myeloid populations (Extended Data Fig. 7C). It was previously demonstrated that Sox4 and Sox11 induce transformation of synoviocytes to fibroblast-like synoviocytes in rheumatoid arthritis41. These cells are thought to be responsible for the inflammatory environment that drives RA disease, but their existence and involvement in the biomaterials response was unknown. These findings suggest that induction of an inflammatory phenotype in fibroblasts driven by Sox4 and Sox11 may partially regulate TGF-β driven fibrosis. We also identify Pirb in the myeloid population correlated with pro-inflammatory transcription factor Irf4. While no readily accepted ligand for Pirb is known, it is an immune checkpoint regulating anti-inflammatory effects in myeloid populations42. This suggests that Pirb may be a novel target to reduce chronic inflammation associated with fibrosis in response to biomaterials.
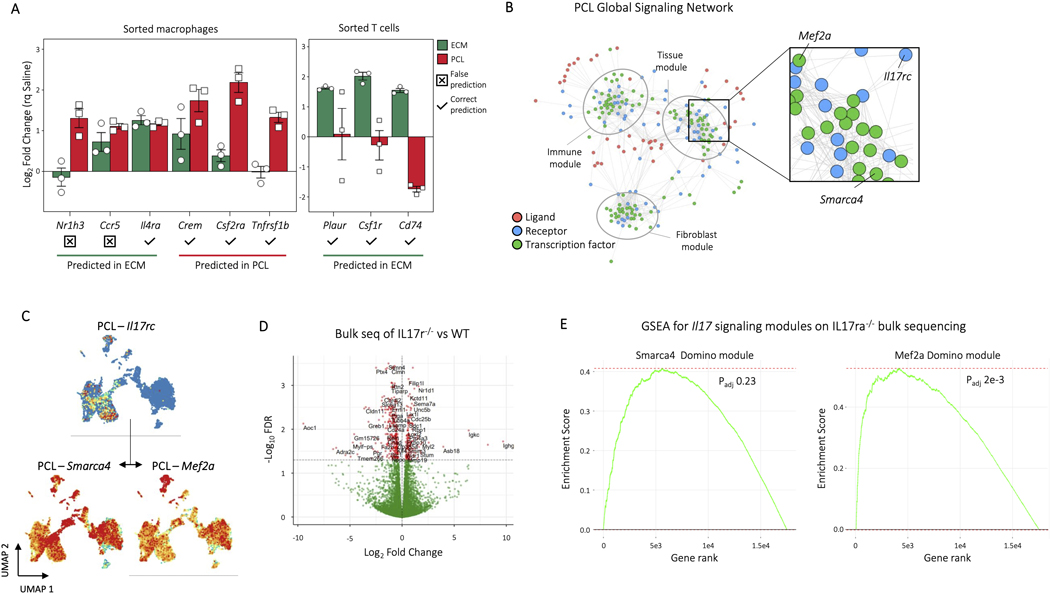
To validate our findings experimentally, we used NanoString to probe gene expression in sorted myeloid cells (CD45+ CD3-CD11b+) and T cells (CD45+CD3+) for genes predicted by Domino to be active only in ECM or PCL. Domino correctly predicted changes in gene expression for 7 of the 9 overlapping genes in the NanoString panel (Extended Data Fig. 9A). To validate the prediction of receptors upstream of transcription factors activated in the biomaterial environments, we used a Il17ra−/− model where IL17 signaling is abrogated and fibrosis reduced 5. We chose to investigate the IL17 signaling pathway to demonstrate Domino’s ability to identify signaling patterns in the absence of ligand expression. Il17 expression is not detected in any cells in our scRNAseq data set but Domino identified it as active in the PCL environment targeting Smarca4 and Mef2a in stromal populations (Extended Data Fig. 9B, C). Bulk RNA sequencing of Il17ra−/− and wild type animals with PCL implants identified a number of genes significantly up or downregulated in the knockout animals (Extended Data Fig. 9D). These differentially expressed genes were enriched for both transcription factor modules predicted as targets of Il17 by Domino with one of the two statistically significant after multiple testing correct (Extended Data Fig. 9E). These findings indicate that blocking Il17 signaling led to the changes in transcription factor activation and gene expression predicted by Domino.
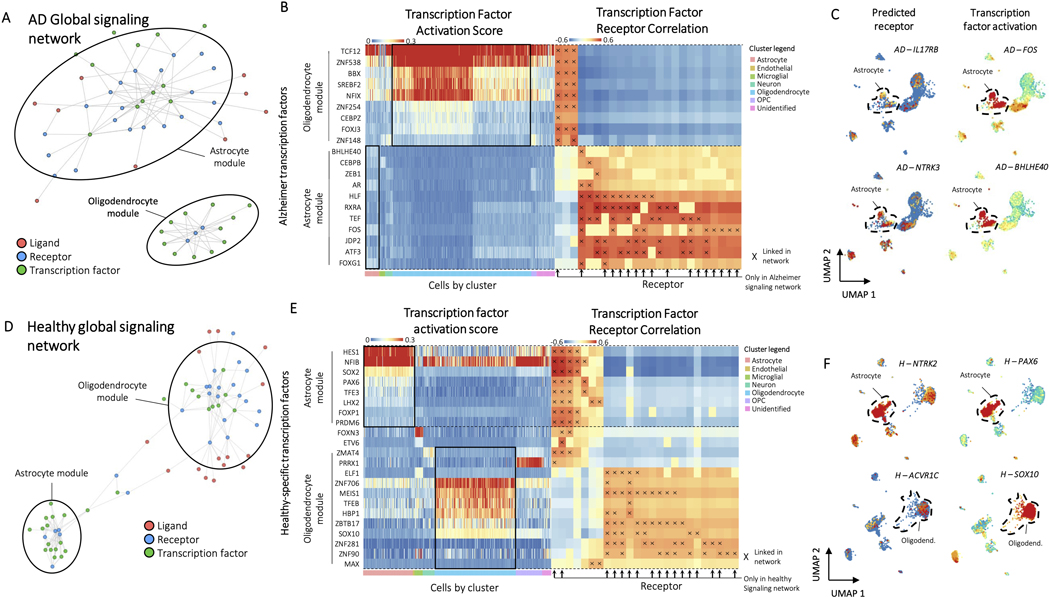
Finally, to test applicability of Domino in other data sets and diseases, we analyzed a publicly available dataset of healthy brain and brain with Alzheimer’s disease (AD)19. This is a good validation data set because the original authors perform gene regulatory network analysis. This allows us to compare whether Domino identifies new transcriptional signatures that would not be found by traditional gene regulatory network analysis. Both the AD and healthy signaling networks clustered into modules associated with cell types (Extended Data Fig. 10A, D). The results for AD indicated IL17RB as a potential receptor upstream of FOS, which is active in AD43, and NTRK3 upstream of BHLHE40 in astrocytes (Extended Data Fig. 10B, C). BHLHE40 has been linked with autoimmunity44, connecting it with IL17 signaling45, which has been demonstrated as involved in AD46. Domino also identified signaling pathways specific to healthy brain (Extended Data Fig. 10E). In astrocytes NTRK2 targeted PAX6. Polymorphisms in NTRK2 are correlated with AD47, and PAX6 activates neurogenesis in astrocytes48 (Extended Data Fig. 10F). Finally, SOX10, a transcription factor promoting survival of myelin-producing oligodendrocytes49, was activated by ACVR1C in healthy oligodendroctyes. While many of these transcription factors were present in the original author’s supplementary data, none were highlighted as notable findings, meaning connection of signaling with transcriptional activity allowed for identification of transcriptional signatures associated with signaling which were previously buried.
Outlook
While the presented atlas represents a powerful resource for integration with future single cell data sets and investigation of biomaterials response, it is bound by the same limitations as single cell RNA sequencing. Only the top 10% of transcript from each cell is captured, making identification of more subtle changes in gene expression difficult and changes in lower expressed genes impossible. Cost limitations can also prevent higher numbers of biological replicates. Domino reconstructs signaling networks between modules of cells connected with transcriptional changes in cells independent of clustering analysis. Networks can be compared to identify signaling specific to conditions even with limited sample numbers or absence of key cell types. Domino was also able to capture cell interactions or influence with cells that were lost in scRNAseq (eosinophils) or where ligand expression was not captured with the limited depth of RNA sequencing in single cell. However, Domino is based solely on correlations and does not have rigorous statistical testing; therefore, it may be best suited for hypothesis generation with experimental validation. Future experimental validation may include knockdown of key predicted transcription factors and pharmacological activation or inhibition of specific signaling pathways.
In the present study, we used biomaterials implanted in a muscle wound. The muscle wound is easily accessible and allows a substantial volume of material to be implanted in the small murine model. Clinically, multiple tissues such as skin, dermis, and muscle may be manipulated and damaged when an implant is placed in the body. However, the severity of the tissue trauma and the tissue type may impact the response to biomaterials. We used two types of biomaterials to represent a spectrum of biomaterials response. Other biomaterials may fall within the spectrum of the synthetic PCL and biological ECM materials and exhibit a combination of the immune and tissue response. Previous studies characterizing the Type 3 immune response to synthetic materials confirmed that all of the materials tested induced a similar immune response albeit to different degrees5. ECM materials derived from skin (dermis), bone, SIS and urinary bladder matrix are clinically available for numerous applications with demonstrated success in tissue reconstruction50,52. Research continues to elucidate mechanisms of tissue response and wound healing of ECM materials which can vary depending on the processing conditions and animal model. The physical properties and form of a biomaterial can also alter the body’s response. The particle form of the ECM and PCL may induce a greater immune response compared to larger implant forms. Particulate forms of synthetic and biological materials are used clinically today53,54 and the particles may mimic wear particles from larger devices, however they may not provide a direct correlation to the response to larger implants. Further research into the response to biomaterials in preclinical and clinical environments will continue to uncover the complexity in the immune and tissue responses and the many factors that contribute to patient outcomes.
Defining cell communication networks using Domino provides an unsupervised method to analyze single cell data sets that constructs and evaluates signaling networks using transcription factor activation. It generated signaling networks with modules connecting immune, stromal, and tissue-specific cell types independent of clustering information for both the biomaterial atlas. Comparison of networks yielded signaling pathways unique to experimental conditions, such as immune-tissue interactions in ECM, as well as tissue module suppression and inflammatory fibroblasts in the context of PCL. Communication between immune and tissue modules is an area of growing interest in tissue repair as demonstrated in immune-satellite signaling in muscle55 and lymphatic-stem cell signaling in skin56. We believe Domino provides a new resource for unsupervised exploration of condition specific signaling patterns and generation of biologically testable signaling hypotheses that can be applied to an expanding biomaterials atlas and multiple other applications.
Overall, the biomaterial atlas describes new cell populations not previously defined in the response to biomaterials, including NK cells and fibroblast subsets. The dataset and analysis methodology described here provides a cornerstone for future biomaterials development. Further expansion of the biomaterials atlas will enable comparison between a wide range of biomaterials implanted in different tissue environments and define cell signaling and communication patterns that regulate outcomes. This knowledge may facilitate better design of biomaterials to achieve desired responses such as tissue tolerance or repair and reduced incidence of adverse events associated with the foreign body response.
Methods
Volumetric muscle loss surgery
Animal procedures were performed in adherence to approved JHU IACUC protocols. Surgeries were performed when animals were 10 weeks of age. The bilateral traumatic muscle defect was created as previously described20. The defects were filled with 30 mg of a synthetic material or biological scaffold material. PCL was employed as a synthetic material (particulate, Mn = 50,000 g/mol, mean particle size < 600 μm, Polysciences). In turn, as a biological scaffold material, decellularized urinary bladder matrix (Matristem, Acell) was implanted from 0.05 ml of a 400 mg/ml suspension in phosphate buffered saline (PBS). Control surgeries were injected with 0.05 ml of PBS as a no implant control. All materials were UV sterilized prior to use. Mice were given subcutaneous carprofen (Rimadyl, Zoetis) at 5 mg/kg for pain relief. For the sample harvest, mice were euthanized at 1 and 6 weeks post-surgery.
Flow Cytometry
Tissue samples were obtained by cutting the quadriceps femoris muscle from the hip to just above the knee. Tissues were finely diced manually with standard razor blades and digested for 45 min at 37°C with 1.67 Wünsch U/mL (0.5 mg/mL) Liberase TL (Roche Diagnostics, Sigma Aldrich) and 0.2 mg/mL DNase I (Roche Diagnostics, Sigma Aldrich) in RPMI-1640 medium supplemented with L-Glutamine and 15 mM HEPES (Gibco). The digested tissues were then pestled through 70 μm cell strainers (ThermoFisher Scientific) with RPMI-1640 (supplemented as before), and then washed twice with 1X DPBS. A Percoll (GE Healthcare) density gradient centrifugation was used to enrich the leukocyte fraction and remove blood and debris from the muscle samples and centrifuged at 2100 x g for 30 min with the lowest acceleration and no brake. Cells were washed 1X DPBS, stained with a viability live/dead amine reactive dye, washed with 1X DPS, blocked with anti-mouse TruStain FcX (BioLegend), and surface stained (Supplementary Table 6). Flow cytometry was performed using an Attune NxT Flow Cytometer (ThermoFisher Scientific) with a Violet, Blue, Green, and Red laser configuration. All subsequent analyses were performed on Live singlet cells using Windows based FlowJo™ software v10 (Benton Dickinson), license supplemented courtesy of the Johns Hopkins Bloomberg Flow Cytometry and Immunology Core.
NanoString Gene Expression Analysis
Muscles harvested from animals treated with ECM or PCL were processed following the previously described preparation method for flow cytometry. Myeloid (CD45+CD3-CD11b+) and T (CD45+CD3+) were then sorted into FisherSci TRIzol™ Reagent. Qiagen RNeasy Mini Kits were used to purify RNA following TRIzol RNA extraction. Purified RNA was quantified using an Agilent 2100 Bioanalyzer RNA 6000 Nano Kit according to manufacturer’s protocol. All RNA samples had RNA integrity score (RIN score) greater than 8.0. For samples processed with NanoString, the NanoString™ nCounter© system was used with the nCounter© Fibrosis Gene Expression Panel following manufacturer’s recommendations with three biological replicates of each condition. Finally, the nSolver© software suite was used to analyze gene expression counts using the Advanced Analysis 2.0 module with default QC settings comparing the ECM and PCL samples with saline samples as a reference. To determine genes specific to ECM or PCL, we removed statistically significant genes in both ECM and PCL with the same direction of fold change. Volcano plots were generated using the EnhancedVolcano R package.
Bulk RNA sequencing
Muscles from Il17ra−/− or wild type mice treated with VML and PCL were collected 1 week after surgery, submerged in Trizol reagent, and minced and grinded in Trizol after which the same isolation protocol was followed as the sorted cells described in the NanoString section. Libraries were then prepared with the Illumina TruSeq RNA Library Prep Kit V2 and sequencing at a depth of 30M unique reads per sample using an Illumina HiSeq. The reads were aligned using STAR against the GENCODE Release 23 annotations and genome. Finally, differential expression was calculated using edgeR with default parameters using genotype as the only variable in the design matrix. The fgsea package was then used to calculate enrichment of transcription factor modules using -log(p) for the ranking statistic.
Histological staining
After harvest, muscle samples were fixed in 10% neutral buffered formalin for 48 hours followed by ethanol and xylenes dehydration and paraffin embedding. Sections were rehydrated by ethanol gradient before staining. We used the Masson’s Trichrome Stain Kit (Sigma Aldrich) following manufacturer’s guidelines. Slides subsequently were dehydrated by ethanol gradient, mounted using Fisher Chemical Permount Mounting Medium, and imaged with a Zeiss Axio Observer with Apotome.2 (Zeiss) with Zeiss Zen Blue software ver. 2.5 (Zeiss).
Collection of single cell data sets
Three separate data sets are presented as components of the atlas. The myeloid sorted data set was previously collected and published with a full description of methodology22. Briefly, macrophages were sorted (CD45+F4/80hi+Ly6c+CD64+) and input into the 10X Genomics Chromium© instrument with the first version of the 3’ gene expression single cell profiling kit. Drop-seq, a single cell microfluidics encapsulation technique, was used to prepare libraries for both the sorted stromal populations (CD45-CD19-CD31-CD29+) and CD45+ enriched cell populations. For the CD45+ enriched populations, dead cells were removed using the Miltenyi Biotec Dead Cell Removal Kit followed by Miltenyi Biotec CD45 MicroBeads to separate CD45+ and CD45- cells. After separation, an equal amount of CD45+ and CD45- cells were pooled directly prior to input to Drop-seq. Drop-seq was run following the McCarroll Lab’s December 2015 iteration of their published protocol57 available from their website (http://mccarrolllab.org/dropseq/).
Data and code availability
All raw data, processed files, and commented code are made available at GEOXXXXXXXXXX. Domino, our software package for analysis of intercellular communication, and sctools, a set of functions used in our code, are available at github.com/chris-cherry.
Data preprocessing and batch effect correction
Seurat was used for most processing steps where other software is not specified58. All cell counts were pruned of cells with UMI counts below 250, cells with more than 10% mitochondrial genes, and genes expressed in fewer than 0.1% of cells. We then normalized and scaled the data with regression on UMI count to account for batch effect and percent mitochondrial genes and calculated principle components using the top 2000 most variable genes. For muscle data sets we then corrected the principle components for batch effect using Harmony59. There are inevitably differences between experimental batches when running single cell RNA sequencing. Harmony and other batch effect correction algorithms are designed to align different batches prior to downstream clustering and dimensional reduction. UMAP and shared nearest neighbor graph construction with subsequent Louvain clustering was then run on principle components.
Cluster composition by condition
To calculate contribution of condition by cluster, we used only the CD45+ enriched samples to avoid biases in clusters containing sorted cells (i.e. fibroblasts and macrophages). Clusters from CD45+ and CD45- cells were normalized separately to avoid slight differences in percent of CD45+ cells from enrichment by sample skewing normalization. For each sample, total number of cells by cluster were calculated and then normalized to the total of CD45+ or CD45- cells in the dataset for the sample. The proportions of each sample were then averaged by condition to determine a condition-level average. Finally, in order to calculate a projected cell number, calculated proportions by sample (% of CD45+ cells) were multiplied by the total number of CD45+ cells determined by flow cytometry. CD45- cells were not calculated due to inclusion of large amounts of debris in flow cytometry data without a positive marker.
Phenotypic assignment of clusters
Seurat’s CellCycleScoring function was used to score cells based on expression of a subset of genes previously identified as associated with the G2M or S phase60. Differential expression testing for clusters was run using Mann-Whitney U tests. Each cluster was compared against all other clusters. The resulting gene expression profiles were examined to determine cluster phenotype. In many cases, unique expression of marker genes was sufficient to determine cluster identity. For the fibroblast clusters, we additionally used CytoSCAPE to determine stemness and assign precursor clusters. Finally, we cross-referenced the source publication for the macrophage dataset to determine precursor macrophage clusters22.
Intracluster differential expression and gene set enrichment
For each cluster, cells from PCL or ECM treated animals were compared to cells from saline treated animals using Mann-Whitney U test across all genes with Benjamini-Hochberg correction for multiple tests. The resulting fold-changes and adjusted p-values were collated and saved in tables. The fgsea package was then used for gene set enrichment analysis (GSEA) using the Broad Institute’s Hallmark gene sets with sign(foldchange)*-log(p) as the ranking statistic from each comparison (PCL vs saline and ECM vs saline). Finally, the results were collated and saved in tables. The tables from both analyses are available as supplementary table 4.
Gene regulatory network analysis
We used the SCENIC 33 analysis pipeline to identify modules of genes targeted by transcription factors and calculate cell level enrichment scores. Genome ranking databases and cis-regulatory motif annotations were obtained from cisTarget Databases. First, we used Arboreto to fit a stochastic gradient boost machine using transcription factor counts to predict gene counts. Modules of genes targeted by transcription factor were then formed from the adjacencies, including genes with feature importances greater than the 95 percentile. The modules were then pruned, cross-referencing the motif annotations and ranking databases to remove modules with less than 80% of genes mapping to regions near binding sites for transcription factors or with less than 20 gene targets. Finally, enrichment for these modules was calculated using AUCell to identify cells with enrichment of genes targeted by transcription factors.
Construction of a global signaling network
A list of human ligands, receptors, and their signaling relationships was obtained from CellphoneDB2 13. We then used biomaRt 61 to convert genes from HGNC to MGI symbols, taking all conversions for each gene when multiple were found. Prior to calculating signaling relationships, counts matrices were pruned for genes expressed in fewer than 2.5% of cells. Pearson correlations were calculated between transcription factor activation scores and normalized, z-scored expression for identified receptors across all cells. Correlation between receptors which were determined as transcription factor targets by gene regulatory network analysis were then set to zero. This prevents targets of transcription factors which would be correlated with transcription factor activation from being interpreted as upstream of its transcription factor. Finally, transcription factors and receptors were considered signaling connections if Pearson correlation was greater than 0.3 with a maximum of ten receptors per transcription factor. For all receptors connected with transcription factors, ligand signaling partners were identified from the CellphoneDB2 database. Ligands that were not found in the dataset were excluded.
Comparison of condition specific global signaling networks
In order to identify intracellular signaling patterns associated with an independent variable, we first split the single cell data by that variable. More specifically, we split the volumetric muscle dataset by treatment with ECM or PCL and the Alzheimer’s dataset by disease status of the patients. We then constructed a global signaling network for each of the separate data sets with identical parameters. Finally, we identified network items specific to each condition by set subtraction. Transcription factors or receptors only present in one condition’s signaling network were considered as potentially condition specific.
Cluster specific subnetwork identification
In order to identify intracellular signaling patterns within a cluster with ligands responsible for their activation, we first identified active transcription factors by cluster using Mann-Whitney U tests. For each cluster, the top over-expressed genes were selected based on p-value with positive log fold change as compared to all other clusters. Transcription factors with p-values below .001 were included with up to 10 transcription factors per cluster. We then generated a signaling subnetwork for each cluster by pruning all network items not connected to the cluster enriched transcription factors.
Prediction of intercellular signaling networks
Using the cluster specific signaling subnetworks, we identified ligands most likely to be responsible for activation of cellular phenotype for each target cluster. It’s important to note that in the data sets we’ve analyzed there tend to be many ligands below detection threshold, so we don’t use signaling pathways without expressed ligands in construction of intercellular signaling networks. To calculate intercluster signaling with ligands found in the data set, we first averaged z-scored ligand expression by cluster. We then generated a signaling score by summing the averaged z-scores by cluster. The signaling represents whether a particular cluster is over- or under-expressing the ligands predicted to activate the target cluster. These values are used as directed, weighted edges between clusters as nodes to construct an intercellular signaling network.
Extended Data
ED Fig. 1. Experimental overview of the assembled datasets.
A, All data sets were taken from mice after volumetric muscle loss treatment. After surgical excision of a large portion of the quadriceps, the wound site was filled with a biomaterial or saline control and stapled shut. Mice were then harvested 1 or 6 weeks after surgery. Young (6 week) or aged (104 week) old animals were used. Representative histological images of PCL and ECM treated muscles 6 week after injury are shown stained by Masson’s Trichrome. Muscle fibers are stained red and connective tissue is stained blue. The posterior (P) is labeled and the location of original defects circled. B, At time of harvest, cells were isolated one of three ways after digestions. For macrophages, cells were sorted as CD45+F4/80HiLy6c+, for fibroblasts cells were sorted as CD45-CD19-CD29+, and for the all-cell dataset CD45+ cells were enriched to ~50% using MACS beads. C, Data sets were integrated for analysis using Harmony. A complete summary of available data sets is given in Supplementary Table 2. D, Enrichment of fibroblasts and macrophages due to inclusion of sorted fibroblast and macrophage data sets. The sorted fibroblasts (left) and macrophages (right) are shown in comparison to the CD45+ enriched sample (middle). E, Cells by condition. Cells are colored by condition plotted on UMAP dimensions. Cells were plotted in order of ECM, PCL, Saline, and Naïve.
ED Fig. 2. Expression characteristics of the CD45+ cluster, and comparison with flow cytometry.
A, Gene expression for myeloid cluster markers. Single cell gene expression for marker genes used to identify myeloid clusters in tandem with CD14, CD11b, and F4/80 expression are shown as violin plots. B, Comparison of flow cytometry cell proportions to single cell proportions. Myeloid (CD45+CD11b+) and T cell (CD45+CD3+) numbers by flow cytometry given as raw counts (top left) and percent of the CD45+ population (top right) from ECM, PCL, or saline treated animals. Mean values are plotted with standard error shown on error bars. CD45- and CD45+ count values are shown, which were used to project single cell proportions to predicted raw numbers. Project single cell counts are shown by cluster (middle) by multipltying raw CD45+ and CD45- counts from flow cytometry with cluster proportions of CD45+ or CD45- populations from single cell (bottom).
ED Fig. 3. Subset clustering of T/NK cells.
A, Clustering of T/NK cells. After subsetting to only T/NK cells, principle component analysis, clustering, and UMAP was run following the same procedures as the whole dataset. The five resulting clusters are visualized in the T/NK cell specific UMAP space. B, Gene expression for T and NK cell markers.
ED Fig. 4. Expression characteristics of the CD45- cluster.
A, Marker gene expression for non-fibroblast CD45- cell populations. Up to three characteristic gene markers are shown for each cluster by violin plot of normalized gene expression data. Fibroblast markers were used to identify the four fibroblast clusters Fib pre 1, Fib pre 2, Fib immune, and Fib cart. B, Stemness markers for fibroblasts. Pdgfra expression and clusters are shown to demonstrate location of fibroblasts with a dotted line drawn surrounding the fibroblasts. Stem marker Osr1 and CytoTRACE score, an algorithm used to score cells for stemness, is shown below. C, Expression of characteristic markers for the tenocyte-like and immune fibroblast clusters.
ED Fig. 5. Flow cytometry of neutrophils and eosinophils.
A, Cells were gated on scatter (FSC_A, SSC_A) followed by doublet discrimination (FSC_A, FSC_H), selection of CD45+ live cells (Fixable Yellow-, CD45+), and selection of myeloid cells (CD3-, CD11b+). This population was used to identify eosinophils (Ly6g low, Siglec F+) and neutrophils (Ly6g+, Siglec F-) of correct size (FSC_A, SSC_A). B, Numbers of CD45+ cells, eosinophils, and neutrophils from ECM, PCL, or saline treated animals one week after surgery (top). Eosinophil and neutrophil amounts as proportion of CD45+ cells are given below. Data are mean ± SEM. Statistics shown are after analysis of variance (ANOVA) followed by Dunnett’s multiple comparison testing where P is adjusted p value.
ED Fig. 6. Identification of intercluster signalling with Domino.
A, Identification of cluster-specific signaling subnetworks. Transcription factors enriched by cluster are identified by Wilcoxon rank sum and networks pruned for disconnected nodes to generate signaling subnetworks relevant for biological activation of clusters. B, Calculation of intercluster signaling networks. Once phenotypically relevant receptors are identified by cluster specific signaling subnetworks, cluster-cluster signaling scores are calculated by cluster averaged scaled expression of ligands present in cluster-specific subnetworks. Every potential cluster-cluster combination is scored, and these weights used to generate an intercluster signaling network.
ED Fig. 7. Signalling pathways for ECM and PCL treated cells visualized with their known ligands.
A, A UMAP plot with clusters labeled for reference when viewing feature plots. B, ECM specific signaling pathways specified in Figure 3. Each pathway contains gene expression of ligands and receptors from each pathway, as well as transcription factor activation scores for the predicted transcription factor target. Ligands completely absent from the data set are not shown, although they may still be viable targets for a target receptor. C, PCL specific signaling pathways specified in Figure 3. No readily accepted ligands for Pirb have been identified, so the Pirb Irf4 pathway is not shown.
ED Fig. 8. Myc signaling in the PCL-treated wound.
Gene expression of ligands and receptors predicted to be involved in activation of Myc in the PCL Domino signaling network for cells from PCL treated animals (top and middle). Myc expression values are SCENIC transcription factor activation scores (bottom). A reference of clusters is provided in the bottom left.
ED Fig. 9. In vivo validation of signalling predictions by Domino.
A, Nanostring gene expression profiling for receptors and transcription factors identified as enriched in either ECM or PCL for specific cell types. After identifying genes specific to either ECM or PCL within the myeloid or T cell populations in Domino, we used Nanostring to probe expression of those genes in sorted myeloid (CD45+CD11b+) or T cells (CD45+CD3+). Of the 9 genes found to overlap between Domino and Nanostring, 7 were predicted correctly and 2 incorrectly. Error bars are standard error. B, The Domino global signaling network for PCL as seen in Figure 5. The region surrounding the IL17 signaling pathway is enlarged and the components labeled. C, Expression of Il17rc and activation of it’s predicted transcription factor targets Smarca4 and Mef2a in the PCL signaling network. D, Volcano plot for bulk RNA sequencing of IL17ra−/− and wild type animals one week after VML. Direction of log fold change indicates expression in IL17ra−/− animals compared to wild type. An FDR threshold of 0.05 was used to designate genes as significant. E, Gene set enrichment analysis (GSEA) of Domino transcription factor modules predicted as downstream of IL17 in the PCL signaling network. Both modules predicted to interact are shown. Genes from the edgeR bulk RNA seq comparison with respect to wild type ordered by FDR were used to calculate enrichment for genes present in the Domino transcription factor modules. Movement of the running enrichment score (green line) above zero indicates enrichment of genes in the module in the statistically significant portion of expressed genes while movement below zero indicates enrichment of genes in the module in the lower FDR portion of the genes. P values calculated by GSEA adjusted by Benjamini-Hochberg correction are shown.
ED Fig. 10. Pathological signaling found from a public dataset of Alzheimer’s Disease.
A, The Alzheimer’s disease (AD) global signaling network. two modules of receptors and transcription factors are readily apparent and labeled based on enrichment of transcription factors by cluster. B, Heatmaps of transcription factor activation score for AD-specific transcription factors (left) and correlation of transcription factor activation score with receptor expression (right). Transcription factors are binned according to their membership to the astrocyte or oligodendrocyte modules from the AD global signaling network. Cells are ordered and colored according to their cluster. Receptors found only in AD are marked with arrows. Connections between receptor and transcription factors are marked with an ‘x’ on the correlation heatmap. C, Example feature plots of gene expression and activation scores for specific receptor-transcription factor pairs identified by domino in the AD condition. D, The healthy global signaling network. Two modules of receptors and transcription factors are readily apparent and labeled based on enrichment of transcription factors by cluster. E, Heatmaps of transcription factor activation score for healthy-specific transcription factors (left) and correlation of transcription factor activation score with receptor expression (right). Transcription factors are binned according to their membership to the astrocyte or oligodendrocyte modules from the global signaling network. Cells are ordered and colored according to their cluster. Receptors found only in the healthy signaling network are marked with arrows. Connections between receptor and transcription factors are marked with an ‘x’ on the correlation heatmap. F, Example feature plots of gene expression and activation scores for specific receptor-transcription factor pairs identified by domino in healthy cells.
Supplementary Material
Acknowledgements
The authors gratefully acknowledge financial support from the Morton Goldberg Chair, NIH Directors Pioneer Award, the Department of Defense, Bloomberg-Kimmel Institute for Cancer Immunotherapy and R01EB028796 awarded from the NIH (JHE). JA was supported by 5T32AG058527 awarded by the NIA. Lana Garmire is supported by grants K01ES025434 awarded by NIEHS through funds provided by the trans-NIH Big Data to Knowledge (BD2K) initiative (www.bd2k.nih.gov), R01 LM012373 and LM012907 awarded by NLM, and R01 HD084633 awarded by NICHD. We thank Locke Davenport Huyer for help and expertise.
References
- 1.Anderson JM, Rodriguez A. & Chang DT Foreign body reaction to biomaterials. Seminars in Immunology 20, 86–100, doi: 10.1016/j.smim.2007.11.004 (2008). [DOI] [PMC free article] [PubMed] [Google Scholar]
- 2.Anderson JM Biological Responses to Materials. Annual Review of Materials Research 31, 81–110, doi: 10.1146/annurev.matsci.31.1.81 (2001). [DOI] [Google Scholar]
- 3.Zakrzewski JL, van den Brink MRM & Hubbell JA Overcoming immunological barriers in regenerative medicine. Nature Biotechnology 32, 786–794, doi: 10.1038/nbt.2960 (2014). [DOI] [PMC free article] [PubMed] [Google Scholar]
- 4.Zhang B, Korolj A, Lai BFL & Radisic M. Advances in organ-on-a-chip engineering. Nature Reviews Materials 3, 257–278, doi: 10.1038/s41578-018-0034-7 (2018). [DOI] [Google Scholar]
- 5.Chung L. et al. Interleukin 17 and senescent cells regulate the foreign body response to synthetic material implants in mice and humans. Science Translational Medicine 12, eaax3799, doi: 10.1126/scitranslmed.aax3799 (2020). [DOI] [PMC free article] [PubMed] [Google Scholar]
- 6.Sadtler K. et al. Developing a pro-regenerative biomaterial scaffold microenvironment requires T helper 2 cells. Science 352, 366, doi: 10.1126/science.aad9272 (2016). [DOI] [PMC free article] [PubMed] [Google Scholar]
- 7.Papalexi E. & Satija R. Single-cell RNA sequencing to explore immune cell heterogeneity. Nature Reviews Immunology 18, 35–45, doi: 10.1038/nri.2017.76 (2018). [DOI] [PubMed] [Google Scholar]
- 8.Suvà ML & Tirosh I. Single-Cell RNA Sequencing in Cancer: Lessons Learned and Emerging Challenges. Molecular Cell 75, 7–12, doi: 10.1016/j.molcel.2019.05.003 (2019). [DOI] [PubMed] [Google Scholar]
- 9.Zhang F. et al. Defining inflammatory cell states in rheumatoid arthritis joint synovial tissues by integrating single-cell transcriptomics and mass cytometry. Nature Immunology 20, 928–942, doi: 10.1038/s41590-019-0378-1 (2019). [DOI] [PMC free article] [PubMed] [Google Scholar]
- 10.Das R. et al. Early B cell changes predict autoimmunity following combination immune checkpoint blockade. The Journal of Clinical Investigation 128, 715–720, doi: 10.1172/JCI96798 (2018). [DOI] [PMC free article] [PubMed] [Google Scholar]
- 11.Steuerman Y. et al. Dissection of Influenza Infection In Vivo by Single-Cell RNA Sequencing. Cell Systems 6, 679–691.e674, doi: 10.1016/j.cels.2018.05.008 (2018). [DOI] [PMC free article] [PubMed] [Google Scholar]
- 12.Yao C. et al. Single-cell RNA-seq reveals TOX as a key regulator of CD8+ T cell persistence in chronic infection. Nature Immunology 20, 890–901, doi: 10.1038/s41590019-0403-4 (2019). [DOI] [PMC free article] [PubMed] [Google Scholar]
- 13.Efremova M, Vento-Tormo M, Teichmann SA & Vento-Tormo R. CellPhoneDB: inferring cell–cell communication from combined expression of multi-subunit ligand–receptor complexes. Nature Protocols 15, 1484–1506, doi: 10.1038/s41596-020-0292-x (2020). [DOI] [PubMed] [Google Scholar]
- 14.Noël F. et al. ICELLNET: a transcriptome-based framework to dissect intercellular communication. bioRxiv, 2020.2003.2005.976878, doi: 10.1101/2020.03.05.976878 (2020). [DOI] [Google Scholar]
- 15.Wang Y. et al. iTALK: an R Package to Characterize and Illustrate Intercellular Communication. bioRxiv, 507871, doi: 10.1101/507871 (2019). [DOI] [Google Scholar]
- 16.Browaeys R, Saelens W. & Saeys Y. NicheNet: modeling intercellular communication by linking ligands to target genes. Nature Methods 17, 159–162, doi: 10.1038/s41592-019-0667-5 (2020). [DOI] [PubMed] [Google Scholar]
- 17.Regev A. et al. The Human Cell Atlas. eLife 6, e27041, doi: 10.7554/eLife.27041 (2017). [DOI] [PMC free article] [PubMed] [Google Scholar]
- 18.Schaum N. et al. Single-cell transcriptomics of 20 mouse organs creates a Tabula Muris. Nature 562, 367–372, doi: 10.1038/s41586-018-0590-4 (2018). [DOI] [PMC free article] [PubMed] [Google Scholar]
- 19.Grubman A. et al. A single-cell atlas of entorhinal cortex from individuals with Alzheimer’s disease reveals cell-type-specific gene expression regulation. Nature Neuroscience 22, 2087–2097, doi: 10.1038/s41593-019-0539-4 (2019). [DOI] [PubMed] [Google Scholar]
- 20.Sicari BM et al. A murine model of volumetric muscle loss and a regenerative medicine approach for tissue replacement. Tissue Eng Part A 18, 1941–1948, doi: 10.1089/ten.TEA.2012.0475 (2012). [DOI] [PMC free article] [PubMed] [Google Scholar]
- 21.Badylak SF & Gilbert TW Immune response to biologic scaffold materials. Seminars in Immunology 20, 109–116, doi: 10.1016/j.smim.2007.11.003 (2008). [DOI] [PMC free article] [PubMed] [Google Scholar]
- 22.Sommerfeld SD et al. Interleukin-36γ–producing macrophages drive IL-17–mediated fibrosis. Science Immunology 4, eaax4783, doi: 10.1126/sciimmunol.aax4783 (2019). [DOI] [PMC free article] [PubMed] [Google Scholar]
- 23.Kim N. et al. Single-cell RNA sequencing demonstrates the molecular and cellular reprogramming of metastatic lung adenocarcinoma. Nature Communications 11, 2285, doi: 10.1038/s41467-020-16164-1 (2020). [DOI] [PMC free article] [PubMed] [Google Scholar]
- 24.Tibbitt CA et al. Single-Cell RNA Sequencing of the T Helper Cell Response to House Dust Mites Defines a Distinct Gene Expression Signature in Airway Th2 Cells. Immunity 51, 169–184.e165, doi: 10.1016/j.immuni.2019.05.014 (2019). [DOI] [PubMed] [Google Scholar]
- 25.Vallecillo-García P. et al. Odd skipped-related 1 identifies a population of embryonic fibro-adipogenic progenitors regulating myogenesis during limb development. Nature Communications 8, 1218, doi: 10.1038/s41467-017-01120-3 (2017). [DOI] [PMC free article] [PubMed] [Google Scholar]
- 26.Ashcroft GS et al. Tumor necrosis factor-alpha (TNF-α) is a therapeutic target for impaired cutaneous wound healing. Wound Repair and Regeneration 20, 38–49, doi: 10.1111/j.1524-475X.2011.00748.x (2012). [DOI] [PMC free article] [PubMed] [Google Scholar]
- 27.Gerarduzzi C. & Di Battista JA Myofibroblast repair mechanisms post-inflammatory response: a fibrotic perspective. Inflammation Research 66, 451–465, doi: 10.1007/s00011-016-1019-x (2017). [DOI] [PubMed] [Google Scholar]
- 28.Stojadinovic O. et al. Molecular Pathogenesis of Chronic Wounds: The Role of β-Catenin and c-myc in the Inhibition of Epithelialization and Wound Healing. The American Journal of Pathology 167, 59–69, doi: 10.1016/S00029440(10)62953-7 (2005). [DOI] [PMC free article] [PubMed] [Google Scholar]
- 29.Cohen M. et al. Lung Single-Cell Signaling Interaction Map Reveals Basophil Role in Macrophage Imprinting. Cell 175, 1031–1044.e1018, doi: 10.1016/j.cell.2018.09.009 (2018). [DOI] [PubMed] [Google Scholar]
- 30.Xie X. et al. Single-cell transcriptome profiling reveals neutrophil heterogeneity in homeostasis and infection. Nature Immunology 21, 1119–1133, doi: 10.1038/s41590-020-0736-z (2020). [DOI] [PMC free article] [PubMed] [Google Scholar]
- 31.Szczerba BM et al. Neutrophils escort circulating tumour cells to enable cell cycle progression. Nature 566, 553–557, doi: 10.1038/s41586-019-0915-y (2019). [DOI] [PubMed] [Google Scholar]
- 32.Joanisse S, Nederveen JP, Snijders T, McKay BR & Parise G. Skeletal Muscle Regeneration, Repair and Remodelling in Aging: The Importance of Muscle Stem Cells and Vascularization. Gerontology 63, 91–100, doi: 10.1159/000450922 (2017). [DOI] [PubMed] [Google Scholar]
- 33.Aibar S. et al. SCENIC: single-cell regulatory network inference and clustering. Nature Methods 14, 1083–1086, doi: 10.1038/nmeth.4463 (2017). [DOI] [PMC free article] [PubMed] [Google Scholar]
- 34.Yuk J-M et al. Orphan Nuclear Receptor ERRα Controls Macrophage Metabolic Signaling and A20 Expression to Negatively Regulate TLR-Induced Inflammation. Immunity 43, 80–91, doi: 10.1016/j.immuni.2015.07.003 (2015). [DOI] [PubMed] [Google Scholar]
- 35.Heredia Jose E. et al. Type 2 Innate Signals Stimulate Fibro/Adipogenic Progenitors to Facilitate Muscle Regeneration. Cell 153, 376–388, doi: 10.1016/j.cell.2013.02.053 (2013). [DOI] [PMC free article] [PubMed] [Google Scholar]
- 36.Zhu J. T helper 2 (Th2) cell differentiation, type 2 innate lymphoid cell (ILC2) development and regulation of interleukin-4 (IL-4) and IL-13 production. Cytokine 75, 14–24, doi: 10.1016/j.cyto.2015.05.010 (2015). [DOI] [PMC free article] [PubMed] [Google Scholar]
- 37.Liu M. et al. Sox17 is required for endothelial regeneration following inflammationinduced vascular injury. Nature Communications 10, 2126, doi: 10.1038/s41467-01910134-y (2019). [DOI] [PMC free article] [PubMed] [Google Scholar]
- 38.Delgado-Olguín P. et al. CTCF promotes muscle differentiation by modulating the activity of myogenic regulatory factors. J Biol Chem 286, 12483–12494, doi: 10.1074/jbc.M110.164574 (2011). [DOI] [PMC free article] [PubMed] [Google Scholar]
- 39.Liu J. et al. Topical TWEAK Accelerates Healing of Experimental Burn Wounds in Mice. Frontiers in Pharmacology 9, doi: 10.3389/fphar.2018.00660 (2018). [DOI] [PMC free article] [PubMed] [Google Scholar]
- 40.Wei K. et al. Notch signalling drives synovial fibroblast identity and arthritis pathology. Nature 582, 259–264, doi: 10.1038/s41586-020-2222-z (2020). [DOI] [PMC free article] [PubMed] [Google Scholar]
- 41.Bhattaram P, Muschler G, Wixler V. & Lefebvre V. Inflammatory Cytokines Stabilize SOXC Transcription Factors to Mediate the Transformation of Fibroblast-Like Synoviocytes in Arthritic Disease. Arthritis Rheumatol 70, 371–382, doi: 10.1002/art.40386 (2018). [DOI] [PMC free article] [PubMed] [Google Scholar]
- 42.Bashirova AA et al. Diversity of the human LILRB3/A6 locus encoding a myeloid inhibitory and activating receptor pair. Immunogenetics 66, 1–8, doi: 10.1007/s00251-013-0730-9 (2014). [DOI] [PMC free article] [PubMed] [Google Scholar]
- 43.Anderson AJ, Cummings BJ & Cotman CW Increased Immunoreactivity for Jun-and Fos-Related Proteins in Alzheimer’s Disease: Association with Pathology. Experimental Neurology 125, 286–295, doi: 10.1006/exnr.1994.1031 (1994). [DOI] [PubMed] [Google Scholar]
- 44.Chih-Chung L. The Role of Bhlhe40 in Autoimmune Neuroinflammation and Mycobacterial Infection. Arts & Sciences Electronic Theses and Dissertations 1125 (2017). [Google Scholar]
- 45.Zhu S. & Qian Y. IL-17/IL-17 receptor system in autoimmune disease: mechanisms and therapeutic potential. Clinical Science 122, 487–511, doi: 10.1042/CS20110496 (2012). [DOI] [PubMed] [Google Scholar]
- 46.Cristiano C. et al. Neutralization of IL-17 rescues amyloid-β-induced neuroinflammation and memory impairment. British Journal of Pharmacology 176, 3544–3557, doi: 10.1111/bph.14586 (2019). [DOI] [PMC free article] [PubMed] [Google Scholar]
- 47.Zeng F. et al. The relationship between single nucleotide polymorphisms of the NTRK2 gene and sporadic Alzheimer’s disease in the Chinese Han population. Neuroscience Letters 550, 55–59, doi: 10.1016/j.neulet.2013.06.061 (2013). [DOI] [PubMed] [Google Scholar]
- 48.Sakurai K. & Osumi N. The Neurogenesis-Controlling Factor, Pax6, Inhibits Proliferation and Promotes Maturation in Murine Astrocytes. The Journal of Neuroscience 28, 4604, doi: 10.1523/JNEUROSCI.5074-07.2008 (2008). [DOI] [PMC free article] [PubMed] [Google Scholar]
- 49.Takada N, Kucenas S. & Appel B. Sox10 is necessary for oligodendrocyte survival following axon wrapping. Glia 58, 996–1006, doi: 10.1002/glia.20981 (2010). [DOI] [PMC free article] [PubMed] [Google Scholar]
- 50.Aurora A, Corona BT & Walters TJ A Porcine Urinary Bladder Matrix Does Not Recapitulate the Spatiotemporal Macrophage Response of Muscle Regeneration after Volumetric Muscle Loss Injury. Cells Tissues Organs 202, 189–201, doi: 10.1159/000447582 (2016). [DOI] [PubMed] [Google Scholar]
- 51.Goldman SM & Corona BT Co-delivery of micronized urinary bladder matrix damps regenerative capacity of minced muscle grafts in the treatment of volumetric muscle loss injuries. PLOS ONE 12, e0186593, doi: 10.1371/journal.pone.0186593 (2017). [DOI] [PMC free article] [PubMed] [Google Scholar]
- 52.Yao Q. et al. Recent development and biomedical applications of decellularized extracellular matrix biomaterials. Materials Science and Engineering: C 104, 109942, doi: 10.1016/j.msec.2019.109942 (2019). [DOI] [PubMed] [Google Scholar]
- 53.Jain A. et al. Injectable formulations of poly(lactic acid) and its copolymers in clinical use. Advanced Drug Delivery Reviews 107, 213–227, doi: 10.1016/j.addr.2016.07.002 (2016). [DOI] [PubMed] [Google Scholar]
- 54.Paige JT et al. Modulation of inflammation in wounds of diabetic patients treated with porcine urinary bladder matrix. Regenerative Medicine 14, 269–277, doi: 10.2217/rme-2019-0009 (2019). [DOI] [PMC free article] [PubMed] [Google Scholar]
- 55.Burzyn D. et al. A special population of regulatory T cells potentiates muscle repair. Cell 155, 1282–1295, doi: 10.1016/j.cell.2013.10.054 (2013). [DOI] [PMC free article] [PubMed] [Google Scholar]
- 56.Gur-Cohen S. et al. Stem cell–driven lymphatic remodeling coordinates tissue regeneration. Science 366, 1218, doi: 10.1126/science.aay4509 (2019). [DOI] [PMC free article] [PubMed] [Google Scholar]
- 57.Macosko Evan Z. et al. Highly Parallel Genome-wide Expression Profiling of Individual Cells Using Nanoliter Droplets. Cell 161, 1202–1214, doi: 10.1016/j.cell.2015.05.002 (2015). [DOI] [PMC free article] [PubMed] [Google Scholar]
- 58.Satija R, Farrell JA, Gennert D, Schier AF & Regev A. Spatial reconstruction of single-cell gene expression data. Nature Biotechnology 33, 495–502, doi: 10.1038/nbt.3192 (2015). [DOI] [PMC free article] [PubMed] [Google Scholar]
- 59.Korsunsky I. et al. Fast, sensitive and accurate integration of single-cell data with Harmony. Nature Methods 16, 1289–1296, doi: 10.1038/s41592-019-0619-0 (2019). [DOI] [PMC free article] [PubMed] [Google Scholar]
- 60.Tirosh I. et al. Dissecting the multicellular ecosystem of metastatic melanoma by singlecell RNA-seq. Science 352, 189, doi: 10.1126/science.aad0501 (2016). [DOI] [PMC free article] [PubMed] [Google Scholar]
- 61.Durinck S, Spellman PT, Birney E. & Huber W. Mapping identifiers for the integration of genomic datasets with the R/Bioconductor package biomaRt. Nature Protocols 4, 1184–1191, doi: 10.1038/nprot.2009.97 (2009). [DOI] [PMC free article] [PubMed] [Google Scholar]
Associated Data
This section collects any data citations, data availability statements, or supplementary materials included in this article.
Supplementary Materials
Data Availability Statement
All raw data, processed files, and commented code are made available at GEOXXXXXXXXXX. Domino, our software package for analysis of intercellular communication, and sctools, a set of functions used in our code, are available at github.com/chris-cherry.


