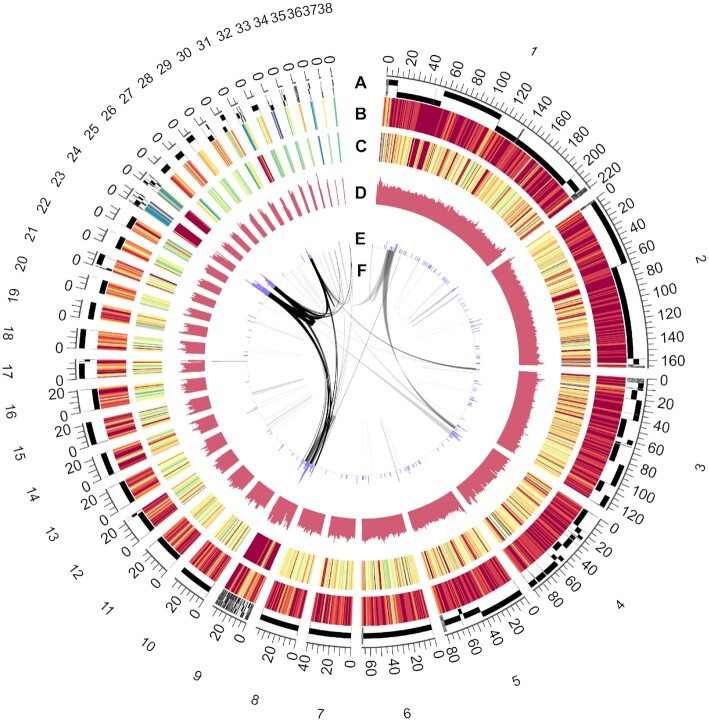
Figure 2:
Distribution of genomic features. Concentric circle diagram presents the distribution of genomic features of Lion-head goose using nonoverlapping sliding windows with sizes of 1 Mb (from outmost to innermost). (A) The assembled pseudo-chromosome and the corresponding position. (B) Gene density calculated on the basis of the number of genes. (C) Average expression level of overall 36 samples. Eight tissues (i.e., brain, pharyngeal pouch, head sarcoma, spleen, liver, chest muscle, kidney, and heart) and blood were collected from 4 healthy adult animals. (D) GC content. (E) Density of TE. (F) Gene synteny and collinearity analysis.

