

Abstract
Oxidative stress is a common feature of inflammation-driven cancers, and it promotes genomic instability and aggressive tumour phenotypes. It is known that oxidative stress transiently modulates gene expression through the oxidation of transcription factors and associated regulatory proteins. Neutrophils are our most abundant white blood cells and accumulate at sites of infection and inflammation. Activated neutrophils produce hypochlorous acid and chloramines, which can disrupt DNA methylation by oxidizing methionine. The goal of the current study was to determine whether chloramine exposure results in sequence-specific modifications in DNA methylation that enable long-term alterations in transcriptional output. Proliferating Jurkat T-lymphoma cells were exposed to sublethal doses of glycine chloramine and differential methylation patterns were compared using Illumina EPIC 850 K bead chip arrays. There was a substantial genome-wide decrease in methylation 4 h after exposure that correlated with altered RNA expression for 24 and 48 h, indicating sustained impacts on exposed cells. A large proportion of the most significant differentially methylated CpG sites were situated towards chromosomal ends, suggesting that these regions are most susceptible to inhibition of maintenance DNA methylation. This may contribute to epigenetic instability of chromosomal ends in rapidly dividing cells, with potential implications for the regulation of telomere length and cellular longevity.
Introduction
The functional relationship between inflammation and cancer is widely accepted, however, the molecular and cellular mechanisms that contribute towards this relationship remain poorly defined. During pathogenic invasion, enhanced cell proliferation occurs in an environment of increased inflammation, and a state of chronic inflammation increases the risk of cancer (1). Proliferating cells that are exposed to an inflammatory microenvironment may develop genetic or epigenetic changes that are propagated in subsequent cell generations, even after inflammation subsides. DNA methylation patterns are often modified in human cancers resulting in the silencing of tumour suppressor genes and/or the activation of oncogenes (2). In an attempt to gain insight into how the environment may influence disease outcomes, many studies investigate how exposure to environmental factors can change patterns of DNA methylation (3–6). However, few studies have investigated the mechanisms behind the modification of DNA methylation and how these changes become established in the methylome. Many of the environmental factors associated with epigenetic patterning, including inflammation, are also recognized as risk factors in cancer (7).
Neutrophils are a rich source of oxidants and excessive or prolonged oxidant production can lead to tissue damage and chronic disease states (8). There is now considerable evidence to implicate neutrophils in all stages of neoplastic disease progression, from initiation through to malignancy (9). Neutrophil oxidants can directly damage DNA leading to mutation; they can activate key enzymes and transcription factors pivotal for tumour growth and repress anti-cancer T-lymphocytes (10–13). While oxidants have been shown to interfere with T-lymphocyte functional properties during inflammation, less is known about their potential to disrupt the metabolic pathways essential for maintaining epigenetic fidelity in these cells (14). One study has shown that methylation of histone H3 (H3K79me2) in T-lymphocytes could be modified due to the depletion of methionine by tumour cells, leading to changes in gene expression and function. (15). Similarly, in an inflammatory environment, there is potential for neutrophil oxidants to oxidize methionine to methionine sulfoxide, restricting the availability of methionine not only to T-lymphocytes but also to tumour cells. Altered methionine levels can impact on DNA methylation machinery and conserved changes in methylation and subsequent gene expression could contribute to the transformed phenotypes observed in both these cell types as a consequence of neutrophil exposure.
Hypochlorous acid (HOCl), a major oxidant produced by the neutrophil enzyme myeloperoxidase (MPO), reacts with endogenous amines to yield chloramines (16). These species are cell permeable, longer lived and more selective in their reactivity than HOCl (17). Chloramines react readily with thiol groups and free methionine and cause cell damage and enzyme inactivation (18–20). We have previously observed that glycine chloramine (GlyCl) directly inhibits DNA methyltransferase 1 (DNMT1) activity and oxidizes methionine, leading to depletion of the methyl donor, S-adenosylmethionine (SAM) (19). This resulted in a global decrease in the maintenance of 5-methylcytosine in proliferating cells without significantly impacting cell viability (19). Through the use of Illumina850K EPIC arrays, we have now discovered that oxidative stress associated with GlyCl exposure causes site-specific alterations in DNA methylation and subsequent gene expression, and that the affected regions are enriched towards chromosomal ends.
Results
We investigated DNA methylation and gene expression changes in cultured Jurkat T-lymphoma cells following exposure to GlyCl. Since GlyCl is quickly consumed by cell and media thiols and methionine, and it acts to impair maintenance methylation during new DNA synthesis, cells were synchronized with a thymidine block to maximize the number undergoing DNA synthesis at the time of oxidant exposure (Fig. 1). Thymidine halts cell division at the G0/G1 phase of the cell cycle, and we have previously demonstrated that a large proportion of cells enter S-phase 2 h after release from thymidine block (21). We therefore exposed cells to GlyCl immediately after the thymidine was removed.
Figure 1.

Experimental design. Jurkat cells were arrested in S phase of the cell cycle by using a thymidine block (n = 3 independent experiments). (1) Cells were released from the block and split into treatment or control flasks. (2) The treatment flask immediately received 200 μm GlyCl and the control received the volumetric equivalent of PBS (Time 0). (3) DNA extracted from cell lysates from samples taken at the 4 and 72 h time points was bisulfite converted and used for analysis of DNA methylation. RNA extracted from cell lysates taken at the 4, 24 and 48 h time points was used for RNAseq analysis. Cell count, proliferation and viability were assessed at each major time point. In a separate set of experiments (n = 4), the treatment flask received 200 μm GlyCl and the control received the volumetric equivalent of PBS at 2 h after release from the thymidine block (step 2). RNA was not analyzed for this dataset. Figure created with Biorender.com
Glycine chloramine sensitivity and cell proliferation
Jurkat cells were treated with either a single bolus of 200 μM GlyCl (treatment) or left untreated (control). Exposure to GlyCl corresponded with a significant decrease in both percentage growth at 24 and 48 h (P = 0.02 and 0.01) (Fig. 2A), and a small decrease in cellular viability at 24, 48 and 72 h (P = 0.02, P= 0.01 and P = 0.03, respectively) (Fig. 2B). The synchronization process itself resulted in a ~ 20% loss in cell viability (Fig. 2B) (22).
Figure 2.

Viability, growth and CFSE dilution of GlyCl treated cells at each major time point. Cell measures were conducted at 24, 48 and 72 h post-release. Circles represent control samples and triangles represent treatment samples. Data are means and SE of three independent experiments. Significant differences were determined with paired t-tests and are denoted with asterisks * = P < 0.05, ** = P < 0.01. (A) Cell growth after treatment, (B) cellular viability after treatment, (C) relative proliferation of treatment cells compared to control. The percentage of total treated cells within the same gate as the control cells at each time point as a percent of all analyzed cells (n = 3). (D) CFSE dilution of GlyCl treated cells at 24, 48 and 72 h post-release. The number of cells is displayed on the y-axis and the concentration of CFSE fluorescence is on the x-axis. Representative cell histograms are shown for control (black) and treated (red) cells. The grey histograms represent the control cells from the 4 h time point for reference.
Cell proliferation was monitored with the cell permeable fluorescent dye carboxyfluorescein diacetate succinimidyl ester (CFSE) over 72 h for the control and treatment samples, with fluorescence intensity halving at each cell division. GlyCl treatment delayed cellular proliferation by an average of 7% compared to control 24 h post-treatment and sustained this delay with ~ 20% fewer cells undergoing proliferation compared to control at 48 and 72 h (Fig. 2C). However, the treated cells at 72 h had the same concentration of CFSE as the control cells at 48 h (Fig. 2D). These observations are consistent with the percentage growth rate (Fig. 1A), and we conclude that after oxidant treatment a large number of viable cells that had undergone at least one round of cell division remained.
Glycine chloramine alters DNA methylation
Principal component and hierarchical clustering analysis demonstrated that the 4 h treatment replicates clustered separately from all the other groups (Fig. 3A and B). This indicates that treatment corresponded with the most significant source of variation, and that consistent changes were observed within these samples.
Figure 3.

Unsupervized assessment of data variability. (A) Multidimensional scaling of M-values, with the distances for leading log2FC in dimension 1 represented on the x-axis and the leading log2FC in dimension 2 are represented on the y-axis. Red and blue dots represent control samples (4 h and 72 h time points respectively), green and purple dots represent GlyCl treated samples (4 h and 72 h time points, respectively). (B) Hierarchical clustering of β-values for all probes. The relative change in β-values is represented on the y-axis and individual samples are represented on the x-axis.
At 4 h, the largest and most significant fold changes were decreases in methylation in the treatment group, compared to the control (Fig. 4A). Both the effect size and significance were considerably reduced at 72 h, with very few probes achieving genome-wide significance (Fig. 4B). These results indicated that the majority of significant changes in DNA methylation due to GlyCl treatment observed at 4 h had reverted by 72 h (Fig. 4A and B).
Figure 4.
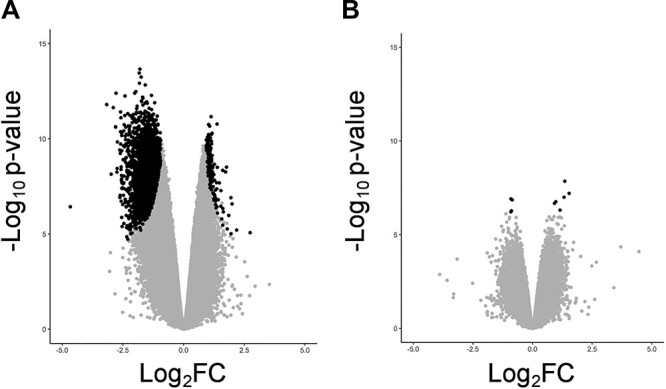
Volcano plots. Volcano plots displaying log2 fold changes (M-values) for all probes on the x-axis versus statistical significance on the y-axis -log10P-value. A log2 fold change cut-off of 1.5 is applied for the 4 h time point; however, this was not applied at the 72 h time point due to the smaller effect size. Black dots represent probes with an adj. P < 0.05. (A) GlyCl exposure at 4 h (log2 FC > 1.5), (B) GlyCl exposure at 72 h.
Our previous mechanistic studies indicated that chloramines affect methylation through depletion of SAM over 2 h (19). To determine if GlyCl can impact methylation by an alternate mechanism, we first performed a set of control experiments where thymidine blocked Jurkat cells were exposed to 200 μM GlyCl at 2 h post-release and methylation patterns assessed 2 h later. This differed from the main experiments (presented below) where treatment occurred at the time of cellular release (2 h earlier than the control experiments). Under the conditions in the control experiments, the cells would have sufficient SAM to undertake the necessary maintenance methylation, but it provides an opportunity for the oxidant to impact DNA methylation through an alternate mechanism (21). As expected, there was no significant difference in percentage growth or viability observed in the treatment cells at 24 or 72 h; however, a significant decrease in percentage growth was observed at 48 h (P = 0.03) (Supplementary Material, Fig. S1A and B). There were no distinctive groupings observed in principal component analysis and hierarchical clustering analysis revealed a lack of clustering in the treatment or control samples and groupings appeared random between replicates (Supplementary Material, Fig. S2A and B). Probe-wise comparisons of significance versus effect size change confirmed that GlyCl treatment at 2 h post-release from thymidine block did not correspond with significant changes in DNA methylation at either 4 or 72 h (Supplementary Material, Fig. S3A and B and Supplementary Material, Tables S1 and S2). No further analyses were undertaken with this dataset.
Glycine chloramine causes site-specific changes in DNA methylation
Epigenetic variability across a population of cells can result in transcriptional heterogeneity and promote diverse functional states (23,24). We therefore investigated the differential variability of all probes (DVP) after GlyCl exposure. At 4 h, the treatment group demonstrated an increase in differential variability at 5910 positions compared to control, and a decrease at 13 769 positions. At 72 h, 1892 positions demonstrated an increase and 2743 demonstrated a decrease. Twenty-three DVPs were observed at both 4 and 72 h; however, only 6 of these DVPs (26%) demonstrated a consistent direction of change between the two time points (Supplementary Material, Table S3).
We next identified site-specific DNA methylation changes that were associated with GlyCl exposure, by using a linear regression model that accounted for time and biological replicate. At 4 h, using a log2FC cut-off of 1.5, there were 2824 CpG sites that displayed a significant decrease in methylation and 144 that demonstrated an increase. These DNA methylation changes were mapped by genomic location, and it appeared that many significant changes were concentrated at specific gene loci (Fig. 5), and towards the chromosomal ends (Supplementary Material, Fig. S4). In order to select the DNA methylation changes that were most likely to be of biological interest, the log2FC was increased to 2. This returned 124 CpG sites that demonstrated decreased methylation and no CpG sites that demonstrated an increase, which indicates that the largest changes in differential methylation were all decreases. A subset of the differentially expressed CpG sites with the largest effect sizes are presented in Table 1 and a more detailed list is presented in Supplementary Material, Fig. S5.
Figure 5.
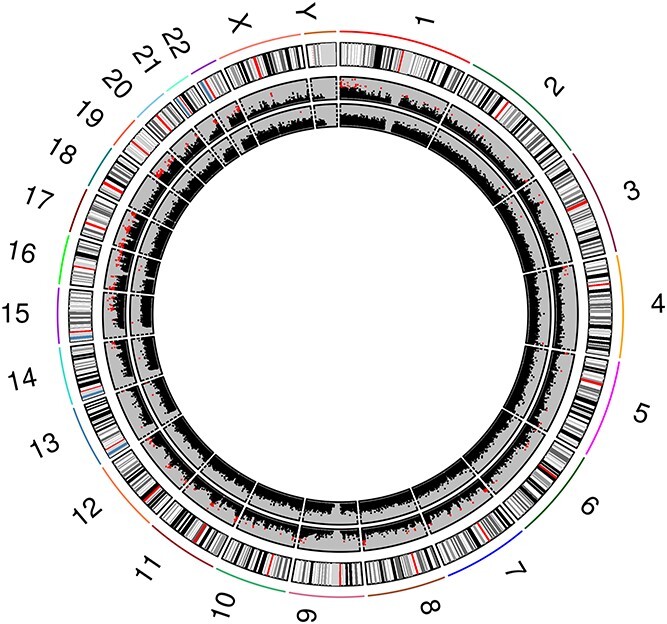
Genome-wide circular plot of all CpG sites. All CpG sites are ordered per chromosome position, and P-values as the log10 (P values) are presented on the y-axis. Positions that reached genome-wide significance as determined using the ‘Benjamini-Hochberg’ method within Limma are represented by the red squares. The 4 h time point is represented in the outer ring and the 72 h time point is represented on the inner ring. The bands in the outermost ring show the position of the centromere (red) and the states of chromatin packing (black representing the most densely packed chromatin through to light grey representing more loosely packed chromatin).
Table 1.
Top most significant differentially methylated probes with a Log2FC ~ 2 and a >20% mean change between treatment and control at 4 h
| logFC | adj.P.val | Direction | Gene | Chr | Location | |
|---|---|---|---|---|---|---|
| cg10553894 | −1.80 | <0.001 | Down | CPT1A | 11 | 68 550 534 |
| cg13782884a | −1.83 | <0.001 | Down | FAM46B | 1 | 27 339 287 |
| cg05372828a | −1.82 | <0.001 | Down | KCNAB2 | 1 | 6 111 632 |
| cg16852704a | −1.75 | <0.001 | Down | TLX2 | 2 | 74 743 243 |
| cg04946721 | −2.20 | 0.01 | Down | ERN1 | 17 | 62 131 780 |
| cg18862597 | −2.04 | 0.01 | Down | CROCC | 1 | 17 265 457 |
| cg06830450 | −1.96 | 0.01 | Down | LOC100130776;AGAP2 | 12 | 58 121 004 |
| cg12873037 | −1.84 | 0.02 | Down | C17orf56 | 17 | 79 205 369 |
| cg19635533 | −1.91 | 0.02 | Down | NACC1 | 19 | 13 249 050 |
| cg17049621 | −1.77 | 0.02 | Down | FZD2 | 17 | 42 635 778 |
| cg21871608 | −2.03 | 0.02 | Down | ITPK1 | 14 | 93 409 468 |
| cg07149030 | −1.90 | 0.02 | Down | ABR | 17 | 982 503 |
| cg02080909 | −1.94 | 0.02 | Down | BAIAP2 | 17 | 79 058 333 |
| cg23120934 | −1.83 | 0.02 | Down | SCRIB | 8 | 144 887 083 |
| cg10692302 | −2.01 | 0.02 | Down | GRM2 | 3 | 51 747 227 |
| cg27182230 | −4.67 | 0.02 | Down | ZFHX3 | 16 | 72 882 824 |
| cg08130783 | −2.08 | 0.02 | Down | TFAP2E | 1 | 36 056 577 |
| cg14899522 | −1.98 | 0.02 | Down | PRKCQ | 10 | 6 472 750 |
| cg15474728 | −1.93 | 0.02 | Down | ABR | 17 | 982 497 |
| cg04801085 | −2.13 | 0.03 | Down | RCOR1 | 14 | 103 150 012 |
| cg10068222 | −1.59 | 0.03 | Down | 16 | 899 108 | |
| cg08925720 | −2.00 | 0.03 | Down | SYT7 | 11 | 61 314 936 |
| cg16699148 | −2.33 | 0.03 | Down | TACSTD2 | 1 | 59 043 255 |
| cg00015930 | −2.22 | 0.03 | Down | 1 | 46 921 746 | |
| cg26924445 | −1.62 | 0.04 | Down | ACRC | X | 70 824 102 |
| cg15002761 | −1.87 | 0.04 | Down | IGSF9B | 11 | 133 816 097 |
| cg09400123 | −1.72 | 0.04 | Down | RUNDC2C | 16 | 29 324 046 |
| cg10040530 | −2.09 | 0.04 | Down | 14 | 104 010 839 | |
| cg08298555 | −2.17 | 0.05 | Down | CACNA1H | 16 | 1 260 656 |
aCpG methylation validated using BSAS (Supplementary info).
At 72 h, there were no significant CpG sites when assessed using a using a log2FC cut-off of 1.5. However, six CpG sites demonstrated a significant increase in differential methylation and four CpG sites demonstrated a significant decrease (adj. P < 0.05), when assessed using a log2FC cut-off of 1 (Supplementary Material, Table 4). Two of these differentially methylated CpG sites were also significant at 4 h. These CpG sites corresponded to the ERC2 and the MLF1IP genes, and had a smaller log2FC at 4 h than at 72 h. Furthermore, neither exhibited a consistent direction of change (Supplementary Material, Fig. S6A and B).
To identify differentially methylated gene regions (DMRs), we limited analysis to investigate loci containing five or more consecutive probes that displayed a significant average change in differential methylation greater than 10%. Eighty-five significant DMRs were observed at 4 h, and 14 of these consisted of 10 or more adjacent significant CpGs (Supplementary Material, Table S5). The top two DMRs with the highest number of significant adjacent CpGs mapped to the MAPK8IP3 gene region (18 CpGs) (Fig. 6A) and the TFAP2E gene region (16 CpGs) (Fig. 6B). No significant DMRs were observed at 72 h under these parameters. When the parameters were relaxed to detect changes in methylation greater than 5%, there were four significant DMRs (Supplementary Material, Table S6); however, the direction of methylation changes was opposing between the 4 and 72 h time points.
Figure 6.
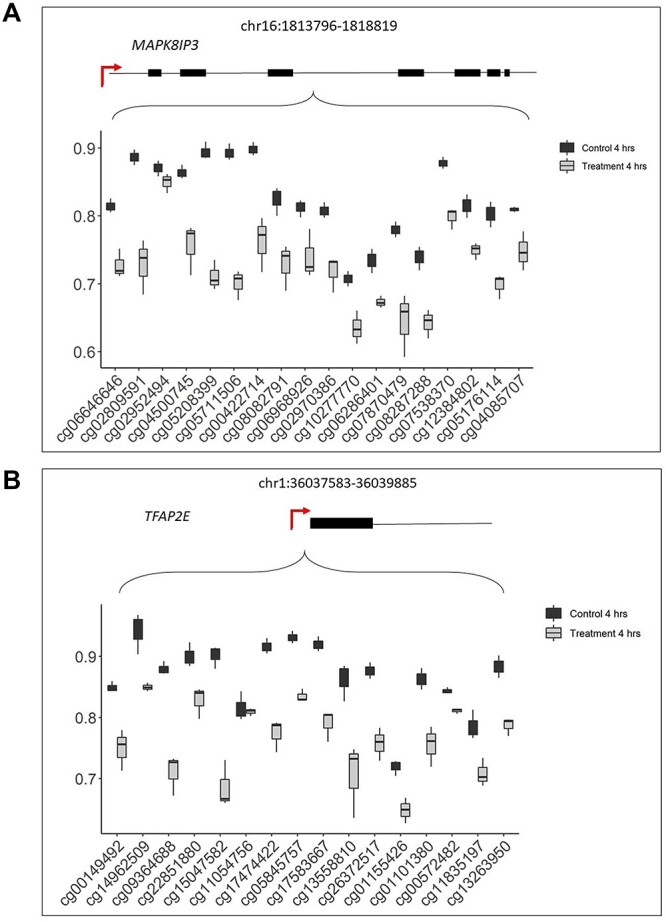
Differentially methylated gene regions. (A) DMR corresponding to the MAPK8IP3 gene (chromosome 16:1813796–1818819, width:5024 bp) that displayed a significant change in methylation (β-values (y-axis)) across 18 CpGs (x-axis) between the treatment (grey) and control (black) for the 4 h time point. (B) DMR corresponding to TFAP2E gene (chromosome 1:36037583–36039885, width:2303 bp) that displayed a significant change in methylation (β-values (y-axis)) across 16 CpGs (x-axis) between the treatment (grey) and control (black) for the 4 h time point. Gene structure is placed on top of each graph, exons are shown as black bars and the transcriptional start site is marked by a red arrow. Differentially methylated regions were interrogated within the Minfi package using the statistical package DMRcate (25). The CpGs cg15047582 (TFAP2E) and cg05208399 (MAPK) were validated using BSAS (Supplementary Material, Material, File S2)
The differentially methylated CpGs at 4 h appeared to be concentrated towards the chromosomal ends (Supplementary Material, Fig. S4). To investigate this observation, the data were categorized in regions representing 10% bins for each chromosome. There was a considerable enrichment in the number of significant probes (49%) that were located within 10% of the end of the chromosomes, even after correction for probe bias (Fig. 7A). This observation also corresponded with a substantial decrease in the log2FC of significant probes towards the chromosomal ends, indicative of a general loss of methylation (Fig. 7B). Using a Wilcoxon rank sum test, with ‘Benjamini-Hochberg’ correction for multiple testing there was a significant difference between both the normalized log2FC values and the normalized count values of the significant probes that occur at each proximal end of the chromosome, compared against the other regions (P value < .00005). Specifically, these proximal regions correspond to between 2 and 5 million base pairs (bp) from each chromosome end, and are towards the outer limit of CpG sites that are included in the array. The array does not include telomeric or the subtelomeric regions, which are typically characterized as within 50 000 bp upstream from the telomeric regions.
Figure 7.
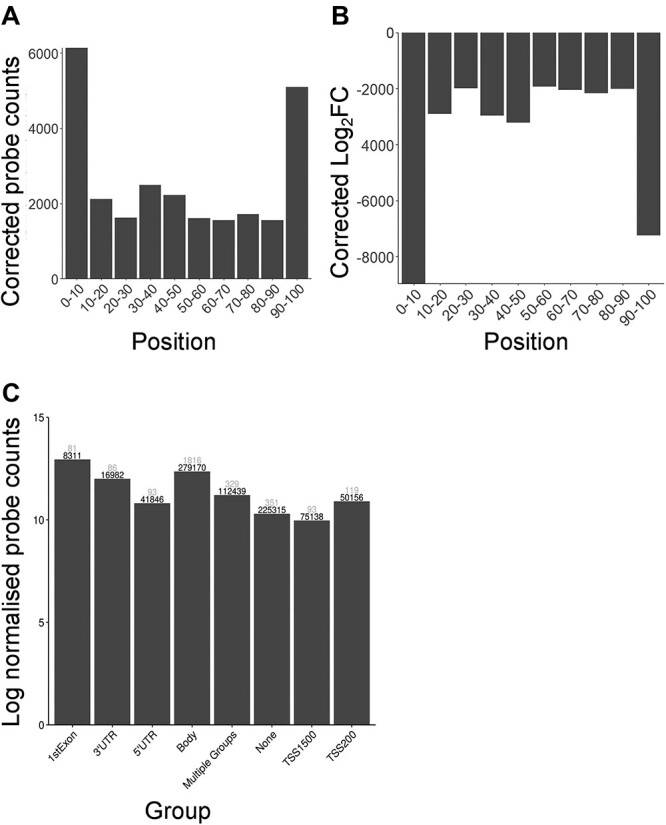
Significant differentially methylated CpGs (log2FC > 1.5) plotted by genomic features. SSN was adapted from the LUMI pipeline to adjust for the number of probes the binds per region, and the total number of probes. (A) The adjusted number of significant differentially methylated CpGs plotted by percent of total chromosome length. The x-axis shows the distance from the start of all chromosomes as a percentage. The y-axis shows the normalized number of CpGs that showed significant change. Black numbers represent the total number of probes that bind in each region, and grey numbers represent the number of significant differentially methylated probes that bind in that region. (B) Adjusted values for the total log2 fold change of the significant probes (as determined by Limma) per region, the log2 fold change was also adjusted by the number of probes that bind per region and the total number of probes. (C) Significant differentially methylated CpGs plotted by gene element which included gene body, 5’untranslated regions (UTR), 3’UTR, first exon, area from the transcriptional start site (TSS) to −200 nucleotides upstream of TSS, and the region between 200 and 1500 nucleotides upstream of TSS, multiple groups encompasses CpGs that are not unique to a single group. The y-axis shows the log2 of adjusted probe counts. Black numbers represent the total number of probes that bind in each region, and grey numbers represent the number of significant differentially methylated probes that bind in that region.
The majority of significant differentially methylated probes (64%) occurred within gene bodies or the first exon, with a substantial underrepresentation from non-transcribed gene elements (Fig. 7C). There was no substantial enrichment in significant probes that occurred in relation to CpG islands (data not shown).
Gene expression change in response to GlyCl
We next used RNA sequencing to investigate the impact of GlyCl exposure on differential gene expression in the same Jurkat samples used in the DNA methylation analysis. The statistical approach was consistent with that used to detect significant differential methylation, where changes were contrasted between the groups (treatment versus control), and the effect of biological replicate was accounted for. Gene expression changes were assessed at 4, 24 and 48 h; low RNA yield meant that there was insufficient sample available for an accurate assessment at 72 h.
Hierarchical sample clustering and principal component analysis indicated that 4 and 24 h treatment samples were the most distinct from all other groups (Supplementary Material, Fig. S7A and B).
At 4 h, there were 277 genes upregulated in the treatment group relative to the control group, and 203 genes downregulated, and these exhibited a similar significance and magnitude of change (Supplementary Material, Table S7). Genes that demonstrated decreased expression were associated with 27 Gene Ontology (GO) terms and two Kyoto Encyclopedia of Genes and Genomes (KEGG) terms, after correction for multiple testing (Supplementary Material, Table S8). However, genes demonstrating increased expression were not associated with any GO or KEGG terms.
At 24 h, there was the largest number of significant differentially expressed genes observed over the duration of the experiment, with 2155 genes upregulated in the treatment group relative to the control group, and 1902 genes downregulated. The largest fold changes all corresponded with increased expression, and the genes that showed decreased expression generally corresponded with smaller P-values and had a lower magnitude of change (Supplementary Material, Table S9). At 48 h, the magnitude of changes and number of significant changes substantially reduced, with 121 genes upregulated in the treatment group relative to the control group, and 61 genes downregulated (Supplementary Material, Table S10, Supplementary Material, Fig. S8). Supplementary Material, Figure S9 provides a summary of the overlap between differentially expressed genes at each time point.
To investigate the relationship between DNA methylation changes and gene expression after GlyCl treatment, the significant DNA methylation changes (Log2FC > 1.5) observed at 4 h were correlated against significant changes in differential gene expression (Log2FC > 1.5) at the subsequent time points. We limited our analysis to only assess significant DNA methylation sites that were located within the promoter regions of genes that displayed significant differential expression.
In total, there were 47 133 probes that displayed significant DNA methylation, and were located within gene promoter regions. Of these, there were 560 differentially methylated CpGs located within the promoter regions of 266 differentially expressed genes at 4 h. A significant, negative correlation (adj. P < 0.05) was observed between 69 CpGs and 48 unique genes (Supplementary Material, Table S11).
There were 4751 differentially methylated CpGs from 4 h located within the promoter regions of 2255 differentially expressed genes at 24 h. A significant negative correlation (adj. P < 0.05) was observed between 398 CpGs and gene expression in 400 genes (Supplementary Material, Table S12). No significant correlations were observed between methylation levels at 4 h and gene expression at 48 h. A summary of correlations between promoter DNA methylation and gene expression is presented in Table 2.
Table 2.
Summary of correlations between promoter DNA methylation at 4 h and gene expression at the indicated time point
| Time point | Total number of assessed probes a | Total number of corresponding genesb | Number of genes showing significant correlation c | Percent of genes showing positive correlation | Percent of genes showing negative correlation |
|---|---|---|---|---|---|
| 4 h | 560 | 266 | 83 | 41.5 | 58.9 |
| 24 h | 4751 | 2255 | 787 | 63.9 | 37.7 |
| 48 h | 251 | 106 | 0 | 0 | 0 |
aTotal number of probes that showed significant DNA methylation change, and were located within the promoter region of genes that showed a significant change in gene expression.
bTotal number of genes corresponding with the assessed probes.
cTotal number of genes showing a significant pairwise sample correlation between DNA methylation values and gene expression values (see Materials and Methods).
There was no apparent bias of significantly correlated genes towards specific genomic locations at 4 h (Fig. 8). However, when the 4 h DNA methylation was correlated with the 24 h gene expression levels, significant correlations were frequently clustered together along the chromosome at adjacent gene regions, for example, the cluster of HIST genes on 6p22.2. (Fig. 9).
Figure 8.

Genome-wide alignment of significant methylation logFC and significant gene expression logFC at 4 h. DNA methylation is represented to the left of the central chromosome and gene expression to the right of the chromosome. Blue peaks represent positive logFC (treatment versus control) and yellow peaks represent negative logFC (treatment versus control). Data are presented as density of logFC over one million base pair windows. Dark grey horizontal bars represent significant correlation between promoter methylation and gene expression changes. The bars within the chromosome show the position of the centromere (red) and the states of chromatin packing (black representing the most densely packed chromatin through to light grey representing more loosely packed chromatin).
Figure 9.

Genome-wide alignment of significant methylation logFC at 4 h and significant gene expression logFC at 24 h. DNA methylation is represented to the left of the central chromosome and gene expression to the right of the chromosome. Blue peaks represent positive logFC (treatment versus control) and yellow peaks represent negative logFC (treatment versus control). Data are presented as density of logFC over one million base pair windows. Dark grey horizontal bars represent significant correlation between promoter methylation and gene expression changes. The bars within the chromosome show the position of the centromere (red) and the states of chromatin packing (black representing the most densely packed chromatin through to light grey representing more loosely packed chromatin).
Pathway analysis of DNA methylation regulated gene expression changes
Pathway analysis was conducted with the top most significant CpG sites that demonstrated decreased methylation at 4 h within the KEGG and GO databases. Fifty-two significant KEGG pathways were identified that had a false discovery rate (FDR) < 0.05 and 13 significant GO pathways were identified for this dataset (Supplementary Material, Table S13).
To investigate whether genes that demonstrated a significant correlation between promoter methylation and gene expression were enriched for similar biological function, these genes were also assessed using GO and KEGG databases. There were 10 significant GO pathways associated with genes that demonstrated a significant negative correlation between DNA methylation and gene expression at 4 h and 53 genes that demonstrated a significant negative correlation between DNA methylation at 4 h and gene expression at 24 h (Supplementary Material, Table S14). Numerous pathways from both time points represented DNA break repair mechanisms. Interestingly, several of the top most significant pathways are of direct relevance in the development and progression of Alzheimer’s disease, including microtubule based processes (26), extracellular vesicles (27), 3′,5′-cyclic-nucleotide phosphodiesterase activity (28), cytokine stimulus (29), and negative regulation of cell–cell adhesion (30). Other significant pathways were involved in the development of various cancers, and in acute inflammatory response pathways.
To further investigate what biological disease outcomes might be influenced by the epigenetic regulation of gene expression following GlyCl treatment, we assessed the significantly correlated genes using WebGestalt (31) against the OMIM database. This analysis confirmed that the regulation of several key Alzheimer’s and cancer-related genes might be linked with the corresponding methylation levels. There were also numerous important genes involved in non-insulin-dependent (type II) diabetes mellitus, a disease linked with inflammation (32) (Supplementary Material, Table S15).
Discussion
Epigenetic modification of DNA is a means by which environmental stimuli can modulate human gene activity, but the exact mechanisms behind these processes remain unclear (33–35). We investigated whether cellular proliferation in an inflammatory environment can trigger epigenetic changes that lead to long-term changes in gene expression, including propagation in subsequent cell generations. By using methylation arrays, we have shown that GlyCl exposure results in large genome-wide decreases in methylation as well as increased heterogeneity of methylation patterns in the cell population after completion of DNA replication. This was associated with significant changes in gene expression 24 and 48 h after oxidant exposure, and while most of the significant methylation changes observed were corrected during subsequent rounds of cell division, some changes were conserved. The failure to restore correct methylation patterns could lead to the propagation of these aberrant patterns and subsequent alteration in cell function. Furthermore, the chromosomal position of the most significant differentially methylated CpG sites was concentrated in gene bodies within 2–5 million base pairs of the chromosomal ends, indicating that sequence-specific alterations in methylation can occur through interference in a pathway that acts on molecular methylation machinery.
At sites of infection and inflammation the heme enzyme MPO generates HOCl, and its primary targets are most likely to be extracellular methionine and amines (16,36). Resultant chloramines, such as the GlyCl used in this study, will therefore be prominent under physiological conditions. Their lower reactivity provides them the opportunity to pass into neighbouring cells and alter cell function (18,36). It is well known that oxidants can impact gene expression through direct oxidation of transcription factors and associated regulatory proteins (37,38). HOCl exposure activates several transcription factors in bacterial systems, resulting in the upregulation of genes that protect the organism from oxidative stress (39–42). Likewise in mammalian cells, HOCl-induced modified gene expression has been observed through its action on stress-sensing transcription factors such as Nrf2 (NF-E2-related factor 2) and NF-κB (nuclear factor kappa-light-chain-enhancer of activated B cells), both through the oxidation of the regulatory proteins Keap-1 and IκB (43–47). These changes are typically transient, with thiol reduction occurring quickly after removal of the oxidant. The epigenetic changes we have observed in our study provide an alternate mechanism of redox regulation of gene expression and one that will last substantially longer than that achieved through direct effects of transcription factor activity.
GlyCl exposure prior to the cells entering into the stage of DNA replication had a complex effect on 5-methylcytosine in synchronized Jurkat cells. Large genome-wide changes in differential methylation and differential variability were observed at 4 h, and abnormal methylation was still detected at 72 h, after all cells had undergone at least one round of cell division. We have previously shown that GlyCl treatment depletes methionine and SAM levels substantially 2 h after treatment, and anticipated that exposure would be required prior to cellular DNA replication (19). This was confirmed by our delayed GlyCl exposure experiment, which demonstrated no significant changes in DNA methylation. This exposure occurred at a time at which DNMT would be most active and before SAM levels could become significantly depleted by treatment. This suggests that the effect of GlyCl on SAM levels is the critical driver of the methylation changes observed rather than direct inhibition of DNMT activity.
The top most significant CpGs all demonstrated a decrease in differential DNA methylation, with a substantial number of genes involved in proliferation, tumour progression and cell death (48–55). Pathway analysis reinforced this observation where enriched pathways included vascular endothelial growth factor (VEGF) signalling (86%), mitogen-activated protein kinases (MAPKs) (71%) and apoptosis (67%). Two CpG sites corresponding to the ERC2 and the MLF1IP genes demonstrated a significant change at both 4 and 72 h, but were not consistent in the direction of change, and also had a smaller log2FC at 4 h than at 72 h. This may suggest that the most commonly occurring methylation changes (those with the largest log2FC) are either detrimental to cell division and are corrected by the cell or they trigger an apoptotic pathway and are not represented at 72 h. However, changes that were more highly represented (larger log2FC) at 72 h than at 4 h may be indicative of cells that have acquired a reproductive advantage.
Many of the changes in methylation observed at 4 h were consistent across relatively large numbers of adjacent CpGs mapped to the same gene region. There were 18 adjacent CpGs that demonstrated a significant decrease in methylation mapping to the MAPK8IP3 gene. The MAPK8IP3 gene encodes the MAPK 8 interacting protein 3 also known as JNK/stress-activated protein kinase-associated protein 1 (JSAP1). MAPK8IP3 is a scaffolding protein for the mitogen-activated protein kinase (MAPK)/c-Jun N-terminal kinases (JNK). MAPKs are involved in a broad range of signalling pathways including proliferation, differentiation, autophagy and apoptosis which are pivotal for tumour invasiveness and progression (56). Oxidative stress has been shown to modify MAPK pathways in other cell types and can either promote a protective effect against oxidation (57,58) or trigger apoptosis (59). It should be noted that because Jurkat cells are an acute T-cell leukemia cell line they may be prone to developing changes in cancer-related pathways. Jurkat cells have also undergone substantial genomic rearrangement, and may be more tolerant of changes in DNA methylation than a primary cell (60).
Taken together, our results show that a single exposure of GlyCl at the onset of replication had a significant initial impact on DNA methylation at important genes that can either confer a survival advantage or induce cell death. These enriched pathways were not observed at the 72 h, indicating that the replenishment of methionine/SAM levels allowed for restoration of methylation by active DNMTs.
To investigate if the DNA methylation changes observed in response to GlyCl treatment could regulate gene expression, we sequenced RNA transcripts from matching cell aliquots. The results demonstrated substantial changes in gene expression corresponding with GlyCl, which has not been previously reported.
There was a strong negative correlation observed between probes demonstrating a significant change in promoter DNA methylation at 4 h and gene expression at both 4 and 24 h. These genes were highly concentrated within regions of open chromatin, which is where the majority of DNA methylation changes were observed. Unfaithful methylation in gene-rich areas may have important implications for replication origin selection, as epigenetic markers have been shown to favour open chromatin structures (61,62). This analysis provides a preliminary list of genes that are potential candidates for future research investigating a role in immune-directed epigenetic gene regulation.
Pathway analysis indicated that some of the top most significant genes contribute towards aspects of cell division. Changes in these genes should be interpreted with caution since GlyCl appeared to stall cellular replication, and the treatment and control samples were no longer synchronized. At 48 h, both treatment and control cells had settled into an equivalent asynchronous state, but significant changes were still detectable, indicating that cell cycle differences would not be the sole factor in altered gene expression. GlyCl is also likely to have a detrimental effect on genetic stability, as indicated by the significant upregulation of gene pathways involved in DNA repair. Although this study was carried out using only one cell type, the mechanism of inhibition of methylation should be the same in all cells.
One of the most interesting findings of our study was the observation that significant methylation changes were highly concentrated towards the chromosomal ends. The precise mechanisms by which GlyCl targets methylation in these regions is unclear, but we did not observe this effect for hydrogen peroxide (21). We were limited by the scope of the bead chip array, which does not cover telomeric and subtelomeric regions, but this provides an interesting avenue for further research. Regions close in proximity to the telomeres have been shown to regulate telomere length, impacting cell longevity and function (63). It is worth noting that the TERT gene, responsible for maintaining telomere length during replication, demonstrated a significant decrease in gene expression 24 h after treatment. This effect demonstrated a positive correlation with promoter methylation, and is consistent with previous observations (64). Telomeres contain unmethylated repetitive sequences found at the terminal ends of each chromosome that preserve the integrity of the chromosome by protecting against chromosomal degradation, redundant DNA repair and recombination or fusion events (65). While telomere shortening is considered a by-product of somatic cell division, altered telomere length is often observed in ageing and age-related pathologies, particularly chronic inflammation and cancer (66–72). Increased telomere length is a common characteristic of advanced cancer types that often have reactivated telomerases that repair and lengthen end caps allowing for cellular immortality (73). Numerous studies have reported associations between epigenetic changes in CpG-rich subtelomeric regions and the regulation of telomere length (74–78). Methylation of the TERT promoter plays an integral role in activation of telomere maintenance machinery in the context of human cancer, and has important clinical and biological implications (79). This CpG was located in a CpG rich region upstream of the TERT promotor, called TERT Hypermethylated Oncological Region (THOR) (64). Methylation at this site has been demonstrated to direct TERT expression, and has a unique cancer specific signature (64).
Overall, this study indicates that immune cell-derived oxidants can cause sequence-specific alterations in DNA methylation with resulting changes in gene expression. These experiments were performed by exposing cells to a single oxidant bolus. In a physiological setting, cells would likely be subjected to repeated or continuous oxidant exposure, and at sublethal doses, this is even more likely to result in epigenetic changes that are inherited by daughter cells through failure to reinstate methylation and gene expression patterns after cell division. This provides a mechanistic explanation for the epigenetic reprogramming that has been reported in inflammation-associated diseases.
Materials and Methods
Study design
Treatment with GlyCl occurred immediately after release from the cell cycle block. Growth rate was determined by live cell counts, and flow cytometry was used to determine cell viability at 24, 48 and 72 h post-release. At 4 and 72 h post-release, 5 × 10⁶ cells were harvested and stored for DNA and RNA extractions. All harvested cells underwent a slow centrifugation step (1000 × g for 5 min) to avoid harvesting late apoptotic or dead cells. This procedure was also performed with GlyCl treatment occurring 2 h after release from cell cycle block. Independent biological replicates were obtained by repeating the experiments on different days with different oxidant preparations.
Cell culture procedure
Jurkat E6.1 human suspension T-cell lymphoma cells were grown in RPMI 1640 medium supplemented with 10% v/v heat-inactivated FBS, 100 U/mL penicillin and 100 μg/mL streptomycin at 37°C in a humidified incubator with 5% CO2. Cell concentrations were not permitted to exceed 1 × 10⁶/mL and were not seeded at concentrations below 2.5 × 10⁵/mL. A log phase of growth was maintained by subculturing the cells every 2 days.
Cell synchronization
Cell cycle arrest of Jurkat cells was performed by using an excess of thymidine as previously described (19,80). Briefly, Jurkat cells (1 × 10⁶/mL) were treated with 1 mM thymidine for 18 h. Cells were washed twice in phosphate buffered saline (PBS), and resuspended in fresh media supplemented with 50 μM cytidine to promote progression out of G1 into S-phase. The cells were then split into either a treatment or control flasks and the treatment flask received a single bolus of 200 μM GlyCl while the control received the volumetric equivalent of PBS.
Cell viability and proliferation
Cell viability was assessed using flow cytometry prior to thymidine block (pre-block), immediately after release from block (post-block) and at 4, 24, 48 and 72 h post-release. Growth rate was determined by live cell counts at 24, 48 and 72 h post-release (current day count—previous day count)/previous day count ×100. The percentage of viable cells was assessed by the exclusion of propidium iodide (PI). Cell cycle transitions were observed by fixation with ice-cold 70% v/v ethanol and subsequent incubation with PI. At each major time point, cell proliferation profiles were compared between treatment and control by labelling cells with CFSE (Invitrogen, Auckland, New Zealand), as previously described (80). The relative proliferation of the treatment cells compared to controls was determined by gating around the CFSE peaks of the control cells at each major time point and then calculating the number of treatment cells as a percentage of all treatment cells analyzed within the same gate.
Glycine chloramine preparation
GlyCl was prepared immediately before treatment by adding HOCl dropwise to a 10 mM excess of glycine in an equivalent volume of PBS while gently vortexing. The concentration of GlyCl was determined using 5-thio-2-nitrobenzoic acid (TNB) by measuring the change in absorbance at 412 nm, using the molar extinction coefficient for TNB (14; 100 M−1 cm−1) and adjusting for the 1:2 stoichiometry of the reaction (GlyCl:TNB).
Sample preparation for methylation array
DNA was extracted from 5 × 10⁶ Jurkat cells at 4 and 72 h time points using the GeneJet genomic DNA purification kit (Thermo Scientific, Finland) as per the manufacturer’s protocol for cultured mammalian cells. Sodium bisulfite conversion on 1000 ng of extracted DNA from the 4 and 72 h time points was performed using Zymo Research EZ DNA Methylation Kit (Zymo Research, Irvine, CA, USA) according to the manufacturer’s specifications recommended for use on the Illumina Infinium MethylationEPIC 850 K array (Illumina, Inc., San Diego, CA, USA). Genome wide DNA methylation profiles were assayed with the Illumina Infinium MethylationEPIC 850 K kit, at the AgResearch Ltd (Invermay, New Zealand). Analysis was performed on all samples in a single batch.
Data processing
Data analyses were performed using statistical software programs and packages as previously described (21,81). R statistical program (www.R-project.org) and Minfi and Limma Bioconductor software packages were used for all statistical analyses. All packages, programs and workflows were based upon published scripts (82,83). All datasets passed quality control and were normalized using preprocessQuantile function within Minfi (84). However, one control sample had an abnormal methylation profile, which was likely due to low DNA quality and quantity. Inclusion of this sample may have skewed the results and artificially inflated statistical significance. Therefore, this replicate was removed from the analysis, and the data presented correspond to three replicates. Probes that produced detection P-values > 0.05 for 1% or more samples were considered unreliable and filtered out of the dataset. Probes identified as having polymorphic hybridizing potential and homology to common single nucleotide polymorphisms were also excluded (85). Probes were annotated using the IlluminaHumanMethylationEPICmanifest (86) and genomic locations were converted to GRCh38 using the Bioconductor package liftOver v.1.16.0. Multidimensional scaling of the top 1000 methylation values was performed using pairwise distance method for gene selection and hierarchical clustering was performed on a ‘minkowski’ distance matrix calculated using the β-values for all probes, regardless of significance (83).
Validation of the MethylationEPIC 850 K array using bisulfite-based amplicon sequencing
Bisulfite-based amplicon sequencing (BSAS) was utilized as an alternative DNA methylation detection technique to validate CpG sites detected using the EPIC array, utilizing the protocols published by Nobel et al. (86). Six CpG sites were selected for validation, based on their differential methylation status in the treatment group compared to the control group. Four of these CpGs originiated from the list of top differentially methylated CpGs at the 4 h time point, and two from the list of differentially methylated regions. Three additional CpGs, which did not reach genome wide sequence level using the EPIC array were also included in the amplified target regions, bringing the total to nine CpGs, across differing levels of significance. Primers were designed to target regions of both methylated and non-methylated DNA, of an approximate size of 250 bp. The 5′ end of each primer sequence contained a 33 base pair sequence for Illumina barcoding during high-throughput sequencing. The forward and reverse primers were matched within 2 degrees (Celsius), for Tm which ranged from 52°C to 57°C for all primers (Supplementary File 2). PCR protocol for bisulfite converted DNA followed that described in our previous publication (87).
PCR products were visualized by gel electrophoresis and purified using MagBio HighPrep™ PCR Clean-up System, according to the manufacturer’s recommendations. DNA was eluted using 10 mM Tris pH 8.5 and quantified using the Qubit HS kit (Thermo Fisher). Preparation of the sequence libraries and sequencing was performed by Massey Genome Service (New Zealand), using the Illumina MiSeq™.
Illumina MiSeq™ sequence reads were quality processed by the service provider according to their internal protocols; in brief, this included removal of PhiX genomic DNA using Bowtie2, adapter removal using BBduk and trimming using SolexaQA++. Sequences were further clipped using Trim Galore (RRID:SCR_011847) (Version 0.6.5) and aligned to bisulfite converted reference sequences using Bowtie2 (version 2.4.5). The Bismark package (88) was then used to align individual reads to their references sequence and produce counts for methylated and unmethylated CpG sites for validation. The methylation counts for each CpG were imported into R/minfi and combined into a methylset data frame, and a coverage level greater than eight counts across unmethylated and methylated counts was verified. Beta and methylation values were then calculated in Minfi, according to the protocols for the EPIC array. An identical statistical approach (general linear model, and adjustment for multiple testing) was then performed on the BSAS values, as with the EPIC array to detect differential methylation between treatment and control samples at the two time points. Epic array and BSAS beta values were visualized using a scatterplot with a regression line for all samples, and for individual groups. A Bland Altman analysis (89) was then used to visualize the agreement between the two methods.
Data visualization and bioinformatic analysis of DNA methylation
DVPs were identified using the DiffVar algorithm within the missMethyl package (90,91). The methylation status of each probe was calculated using normalized probe signals represented as methylation values (M-values) and β-values. M-values were generated within Minfi as the log2 ratio of the signal intensities of methylated probe divided by the unmethylated probe. β-Values (average DNA methylation level for each probe) were used for data visualization and were generated by dividing the methylated probe signal with the sum of the methylated and unmethylated probe signals.
Differentially methylated positions that correlated with treatment were identified using a linear regression model within the Limma package, with adjustment for multiple testing. This was calculated by comparing the methylation measurements of the control samples with the treatment samples, for each of the two time points (4 h post-release, and 72 h post-release). Samples that originated from the same cell passage were treated as a biological replicate, and the correlation coefficient between these samples was incorporated into the statistical design using Limma’s duppcorr function. The top most significant, differentially methylated CpG positions were identified using log fold change (logFC) weighted thresholds incorporated within the statistical design. Adjustment for multiple correction was performed using the ‘Benjamini-Hochberg’ (BH) method within Limma (92). We prioritized significant results using filtering criteria that excluded probes with less than 10% mean difference in methylation between treatment and control samples, and probes that had a mean methylation value less than 10% or greater than 90% (in the control), as changes within the excluded ranges are unlikely to be of biological significance.
Pathway analysis was performed by comparison with the KEGG (93) database using the missmethyl R package, with correction for probe bias. Differentially methylated regions were interrogated within the Minfi package using the statistical package DMRcate (25). A methylation differential cut-off of 10 was used, and unless stated otherwise significance was determined using a FDR of 0.05 in conjunction with a P-value cut-off of 0.05.
Chromosomal probe position
To investigate where significant changes in DNA methylation were localized on the chromosomes, the probe position was classified as a percentage of chromosome length. The top most significant probes at the 4 h time point were determined as probes that demonstrated log2FC > 1.5. This resulted in 2968 significant differentially methylated probes. Each chromosome was divided into 10 bins as a percentage of the total length and the number of significant probes that were located in each bin was summed across all chromosomes. Simple scaling normalization (SSN) was adapted from the LUMI pipeline to control for probe bias (94). This was applied as the total significant probe counts per region divided by the ratio of the total probes per region divided by total probes (809460). A similar method was applied to calculate a normalized logFC. Here, the sum of the logFC for significant probes in each region was divided by the ratio of the total probes per region divided by the total probes (809460). This approach normalized for the total number of probes on the array and the number that bind in each bin.
RNA sequencing
Cell aliquots were pelleted and frozen at –80°C for RNA extraction using the NucleoSpin RNA plus kit (Macherey-Nagel, Duren, Germany) according to the manufacturer’s recommendations. RNA quality was checked using the Agilent RNA Screen Tape and sequencing was outsourced to Custom Science (Auckland, New Zealand) according to their protocol for LncRNA-seq. For shipping, RNA was treated using the RNAstable Tube Kit (Biomatrica). Quality control and filtering of sequence data was performed by the service provider according to their internal protocols. In brief, this utilized cutadapt for adapter and low-quality read filtering from the raw data (Pass Filter Data), removal of primers and adapters sequences, removal of the end sequences with base quality less than 20, removal of sequences with N content greater than 10% and removal of reads with lengths less than 75 bp after filtering. BWA (v. 0.7.12) (95) was also used to filter out host sequences based on host genome sequence. Filtered fastq files were then processed and aligned to the human reference genome (Gencode release 29) based on the GRCh38.p12, using the STAR spliced read aligner (v. 2.7.8a) (96), and a two-pass alignment mode. This resulted in a mean of ~ 22 million (+/− ~ 5 million) uniquely mapped read pairs per sample. A gene matrix was built from the resulting Sam sorted, BAM files using GenomicAlignments (v. 1.26.0) (97) package in R (v. 4.0.3) and summarizeoverlaps within edgeR (v. 3.32.1) (98) utilizing the ‘union’ mode for paired-end, stranded sequencing. This was performed by making a gene level transcription database against the same gencode v. 29 annotation gene transfer file used for alignments. Filtering was performed by filterByExpr within edgeR and resulted in 20 374 genes retained for further analysis. An average of 29 million (range: 23–31 million) read pairs were successfully assigned in each sample. Differentially expressed genes were called using DESeq2 package (v. 1.30.1) (99) with adjusted P-value cut-off of 0.05, and an internal log2FC of 0.2. The statistical model used to detect differential expression was consistent with the approach used for identifying differential methylation, where data was grouped by time and treatment. The effect of biological replicate was incorporated into the statistical model as a covariate, and differentially expressed genes were then identified by contrasting samples for each time point.
Gene set enrichment analyses for the DEGs at each time point were performed using goseq v. 1.44. This approach is significantly more stringent due to the ability to correct for gene length bias, and significance adjustment for multiple testing (100). GO categories with fewer than five genes in the final GO ranking list were excluded (101), with GO and KEGG annotation drawn from the org.Hs.eg.db v. 3.10.0 database (102). The web-based bioinformatic platform WebGestalt (31) was used to assess the potential overrepresentation of significant results with biological disease, within the Online Mendelian Inheritance in Man (OMIM) database (103).
Integrative analysis of DNA methylation and gene expression
To identify which significant promoter DNA methylation changes associated with significant gene expression changes, correlative analysis of the DNA methylation and RNAseq data was carried out. The significant effect of GlyCl treatment was already determined for the gene expression and methylation data in the respective analyses; therefore, the correlation was performed on all paired samples, regardless of condition. The correlation was performed using methylation values (M-values) of significant CpGs against gene expression data, which was transformed and normalized using the DESeq2 ‘regularized log’ transformation. The significant methylation probes were selected if they had an adjusted P-value less than 0.05 and absolute log2FC greater than 1.5 from the 4 h comparison of DNA methylation. They were further filtered for those that occurred within regions 2000 bp upstream and 400 bp downstream of the transcription start site. The Pearson correlation (r) was calculated between the paired samples for methylation and RNA sequencing data for pairwise observations. Significance adjustment for multiple testing was determined using the ‘BH’ method. The significant methylation probes were selected if they had an adjusted P-value less than 0.05 and absolute log2FC greater than 1.5 from the 4 h comparison of DNA methylation. They were further filtered to those that occurred within regions 2000 bp upstream and 400 bp downstream of the transcription start site using the GenomicFeatures package v. 1.44.2 (97). Genomic locations were then converted using LiftOver, and methylation sites were annotated by location using the same gene transcription file previously used for RNA sequencing. Significant promoter methylation was merged with significant RNA transcripts using their ensemble gene identification number. This ensured that the promoter filtered methylation probes and RNA gene transcripts were accurately assigned to the same corresponding gene. In the instance where multiple CpGs bound in the same gene promoter region, the correlation was performed on each CpG value separately. Gene-enrichment analysis of significant correlated genes was performed using web-based functional annotation bioinformatics tool, DAVID Resources 6.8 (104,105). Goseq was not used for this analysis, as there was no need to prioritize gene length corrections. To investigate what biological disease outcomes might be influenced by the epigenetic regulation of gene expression following GlyCl treatment, we assessed the significantly correlated genes using WebGestalt (31) against the OMIM database.
Accession codes
All DNA methylation and RNA-seq data in this study can be accessed from the Gene Expression Omnibus (GEO) under accession GSE199236.
Conflict of Interest statement. The authors declare no conflicts of interest.
Funding
This work was supported by the Health Research Council of New Zealand, Research For Life: The Wellington Medical Research Foundation, and the Postgraduate Tassell Scholarship for Cancer Research.
Supplementary Material
Contributor Information
Annika R Seddon, University of Otago, Christchurch, Department of Pathology and Biomedical Science, Christchurch, 8011, New Zealand.
Andrew B Das, University of Otago, Christchurch, Department of Pathology and Biomedical Science, Christchurch, 8011, New Zealand; Peter MacCallum Cancer Centre, Melbourne, Victoria 3000, Australia; Sir Peter MacCallum Department of Oncology, The University of Melbourne, Victoria 3010, Australia.
Mark B Hampton, University of Otago, Christchurch, Department of Pathology and Biomedical Science, Christchurch, 8011, New Zealand.
Aaron J Stevens, University of Otago, Christchurch, Department of Pathology and Biomedical Science, Christchurch, 8011, New Zealand; University of Otago, Wellington, Department of Pathology and Molecular Medicine, Wellington 6021, New Zealand.
References
- 1. Chen, R., Alvero, A.B., Silasi, D.A. and Mor, G. (2007) Inflammation, cancer and chemoresistance: taking advantage of the toll-like receptor signaling pathway. Am. J. Reprod. Immunol., 57, 93–107. [DOI] [PubMed] [Google Scholar]
- 2. Dunn, G.P., Bruce, A.T., Ikeda, H., Old, L.J. and Schreiber, R.D. (2002) Cancer immunoediting: from immunosurveillance to tumor escape. Nat. Immunol., 3, 991–998. [DOI] [PubMed] [Google Scholar]
- 3. Wan, E.S., Qiu, W., Baccarelli, A., Carey, V.J., Bacherman, H., Rennard, S.I., Agusti, A., Anderson, W., Lomas, D.A. and Demeo, D.L. (2012) Cigarette smoking behaviors and time since quitting are associated with differential DNA methylation across the human genome. Hum. Mol. Genet., 21, 3073–3082. [DOI] [PMC free article] [PubMed] [Google Scholar]
- 4. Jaenisch, R. and Bird, A. (2003) Epigenetic regulation of gene expression: how the genome integrates intrinsic and environmental signals. Nat. Genet., 33, 245–254. [DOI] [PubMed] [Google Scholar]
- 5. Waterland, R.A. and Jirtle, R.L. (2003) Transposable elements: targets for early nutritional effects on epigenetic gene regulation. Mol. Cell. Biol., 23, 5293–5300. [DOI] [PMC free article] [PubMed] [Google Scholar]
- 6. Rönn, T., Volkov, P., Davegårdh, C., Dayeh, T., Hall, E., Olsson, A.H., Nilsson, E., Tornberg, Å., Dekker Nitert, M., Eriksson, K.-F.et al. (2013) A six months exercise intervention influences the genome-wide DNA methylation pattern in human adipose tissue. PLoS Genet., 9, 1–16. [DOI] [PMC free article] [PubMed] [Google Scholar]
- 7. Hanahan, D. and Weinberg, R. (2011) Hallmarks of cancer: the next generation. Cell, 144, 646–674. [DOI] [PubMed] [Google Scholar]
- 8. Federico, A., Morgillo, F., Tuccillo, C., Ciardiello, F. and Loguercio, C. (2007) Chronic inflammation and oxidative stress in human carcinogenesis. Int. J. Cancer, 121, 2381–2386. [DOI] [PubMed] [Google Scholar]
- 9. Wu, L., Saxena, S., Awaji, M. and Singh, R.K. (2019) Tumor-associated neutrophils in cancer : going pro. Cancers (Basel)., 11(4):564. [DOI] [PMC free article] [PubMed] [Google Scholar]
- 10. Sabbione, F., Gabelloni, M.L., Ernst, G., Gori, M.S., Salamone, G., Oleastro, M., Trevani, A., Geffner, J. and Jancic, C.C. (2014) Neutrophils suppress γδ T-cell function. Eur. J. Immunol., 44, 819–830. [DOI] [PubMed] [Google Scholar]
- 11. Knaapen, A.M., Güngör, N., Schins, R.P.F., Borm, P.J.A. and Van Schooten, F.J. (2006) Neutrophils and respiratory tract DNA damage and mutagenesis: a review. Mutagenesis, 21, 225–236. [DOI] [PubMed] [Google Scholar]
- 12. Mantovani, A., Cassatella, M.A., Costantini, C. and Jaillon, S. (2011) Neutrophils in the activation and regulation of innate and adaptive immunity. Nat. Rev. Immunol., 11, 519–531. [DOI] [PubMed] [Google Scholar]
- 13. Kaltenmeier, C., Yazdani, H.O., Morder, K., Geller, D.A., Simmons, R.L. and Tohme, S. (2021) Neutrophil extracellular traps promote t cell exhaustion in the tumor microenvironment. Front. Immunol., 12, 1–14. [DOI] [PMC free article] [PubMed] [Google Scholar]
- 14. Das, A.B., Seddon, A.R., O’Connor, K.M. and Hampton, M.B. (2021) Regulation of the epigenetic landscape by immune cell oxidants. Free Radic. Biol. Med., 170, 131–149. [DOI] [PubMed] [Google Scholar]
- 15. Bian, Y., Li, W., Kremer, D.M., Sajjakulnukit, P., Li, S., Crespo, J., Nwosu, Z.C., Zhang, L., Czerwonka, A., Pawłowska, A.et al. (2020) Cancer SLC43A2 alters T cell methionine metabolism and histone methylation. Nature, 585, 277–282. [DOI] [PMC free article] [PubMed] [Google Scholar]
- 16. Grisham, M.B., Jefferson, M.M., Melton, D.F. and Thomas, E.L. (1984) Chlorination of endogenous amines by isolated neutrophils. Ammonia-dependent bactericidal, cytotoxic, and cytolytic activities of the chloramines. J. Biol. Chem., 259, 10404–10413. [PubMed] [Google Scholar]
- 17. Winterbourn, C.C., Kettle, A.J. and Hampton, M.B. (2016) Reactive oxygen species and neutrophil function. Annu. Rev. Biochem., 85, 765–792. [DOI] [PubMed] [Google Scholar]
- 18. Peskin, A.V., Midwinter, R.G., Harwood, D.T. and Winterbourn, C.C. (2005) Chlorine transfer between glycine, taurine, and histamine: reaction rates and impact on cellular reactivity. Free Radic. Biol. Med., 38, 397–405. [DOI] [PubMed] [Google Scholar]
- 19. O’Connor, K.M., Das, A.B., Winterbourn, C.C., Hampton, M.B., Das, A.B., Winterbourn, C.C. and Hampton, M.B. (2020) Inhibition of DNA methylation in proliferating human lymphoma cells by immune cell oxidants. J. Biol. Chem., 295, 7839–7848. [DOI] [PMC free article] [PubMed] [Google Scholar]
- 20. Pullar, J.M., Vissers, M.C.M. and Winterbourn, C.C. (2000) Living with a killer: the effects of hypochlorous acid on mammalian cells. IUBMB Life, 50, 259–266. [DOI] [PubMed] [Google Scholar]
- 21. Seddon, A.R., Liau, Y., Pace, P.E., Miller, A.L., Das, A.B., Kennedy, M.A., Hampton, M.B. and Stevens, A.J. (2021) Genome-wide impact of hydrogen peroxide on maintenance DNA methylation in replicating cells. Epigenetics Chromatin, 14, 17. [DOI] [PMC free article] [PubMed] [Google Scholar]
- 22. Kurose, A., Tanaka, T., Huang, X., Traganos, F. and Darzynkiewicz, Z. (2006) Synchronization in the cell cycle by inhibitors of DNA replication induces histone H2AX phosphorylation: an indication of DNA damage. Cell Prolif., 39, 231–240. [DOI] [PMC free article] [PubMed] [Google Scholar]
- 23. Pujadas, E. and Feinberg, A.P. (2012) Regulated noise in the epigenetic landscape of development and disease. Cell, 148, 1123–1131. [DOI] [PMC free article] [PubMed] [Google Scholar]
- 24. Li, S., Garrett-Bakelman, F.E., Chung, S.S., Sanders, M.A., Hricik, T., Rapaport, F., Patel, J., Dillon, R., Vijay, P., Brown, A.L.et al. (2016) Distinct evolution and dynamics of epigenetic and genetic heterogeneity in acute myeloid leukemia. Nat. Med., 22, 792–799. [DOI] [PMC free article] [PubMed] [Google Scholar]
- 25. Peters, T.J., Buckley, M.J., Eagleson, G.K., Peters, T.J., Buckley, M.J., Statham, A.L., Pidsley, R., Samaras, K., Lord, R.V., Clark, S.J.et al. (2015) De novo identification of differentially methylated regions in the human genome. Epigenetics Chromatin, 8, 6. [DOI] [PMC free article] [PubMed] [Google Scholar]
- 26. Fernandez-Valenzuela, J.J., Sanchez-Varo, R., Muñoz-Castro, C., De Castro, V., Sanchez-Mejias, E., Navarro, V., Jimenez, S., Nuñez-Diaz, C., Gomez-Arboledas, A., Moreno-Gonzalez, I.et al. (2020) Enhancing microtubule stabilization rescues cognitive deficits and ameliorates pathological phenotype in an amyloidogenic Alzheimer’s disease model. Sci. Rep., 10, 14776. [DOI] [PMC free article] [PubMed] [Google Scholar]
- 27. Lee, S., Mankhong, S. and Kang, J.-H. (2019) Extracellular vesicle as a source of Alzheimer’s biomarkers: opportunities and challenges. Int. J. Mol. Sci., 20, 1728. [DOI] [PMC free article] [PubMed] [Google Scholar]
- 28. Sanders, O. and Rajagopal, L. (2020) Phosphodiesterase inhibitors for Alzheimer’s disease: a systematic review of clinical trials and epidemiology with a mechanistic rationale. J. Alzheimer’s Dis. Reports, 4, 185–215. [DOI] [PMC free article] [PubMed] [Google Scholar]
- 29. Domingues, C., daCruz, E., Silva, O.A.B. and Henriques, A.G. (2017) Impact of cytokines and chemokines on Alzheimer’s disease neuropathological hallmarks. Curr. Alzheimer Res., 14, 870–882. [DOI] [PMC free article] [PubMed] [Google Scholar]
- 30. Wennström, M. and Nielsen, H.M. (2012) Cell adhesion molecules in Alzheimer’s disease. Degener. Neurol. Neuromuscul. Dis., 2, 65–77. [DOI] [PMC free article] [PubMed] [Google Scholar]
- 31. Zhang, B., Kirov, S. and Snoddy, J. (2005) WebGestalt: an integrated system for exploring gene sets in various biological contexts. Nucleic Acids Res., 33, W741–W748. [DOI] [PMC free article] [PubMed] [Google Scholar]
- 32. Lontchi-Yimagou, E., Sobngwi, E., Matsha, T.E. and Kengne, A.P. (2013) Diabetes mellitus and inflammation. Curr. Diab. Rep., 13, 435–444. [DOI] [PubMed] [Google Scholar]
- 33. Feil, R. and Fraga, M.F. (2012) Epigenetics and the environment: emerging patterns and implications. Nat. Rev. Genet., 13, 97–109. [DOI] [PubMed] [Google Scholar]
- 34. Garcia-Gomez, A., Rodríguez-Ubreva, J. and Ballestar, E. (2018) Epigenetic interplay between immune, stromal and cancer cells in the tumor microenvironment. Clin. Immunol., 196, 64–71. [DOI] [PubMed] [Google Scholar]
- 35. Kubota, T., Miyake, K. and Hirasawa, T. (2012) Epigenetic understanding of gene-environment interactions in psychiatric disorders: a new concept of clinical genetics. Clin. Epigenetics, 4, 1. [DOI] [PMC free article] [PubMed] [Google Scholar]
- 36. Ashby, L.V., Springer, R., Hampton, M.B., Kettle, A.J. and Winterbourn, C.C. (2020) Evaluating the bactericidal action of hypochlorous acid in culture media. Free Radic. Biol. Med., 159, 119–124. [DOI] [PubMed] [Google Scholar]
- 37. Sun, Y. and Oberley, L.W. (1996) Redox regulation of transcriptional activators. Free Radic. Biol. Med., 21, 335–348. [DOI] [PubMed] [Google Scholar]
- 38. Sen, C.K. and Packer, L. (1996) Antioxidant and redox regulation of gene transcription. FASEB J., 10, 709–720. [DOI] [PubMed] [Google Scholar]
- 39. Drazic, A., Tsoutsoulopoulos, A., Peschek, J., Gundlach, J., Krause, M., Bach, N.C., Gebendorfer, K.M. and Winter, J. (2013) Role of cysteines in the stability and DNA-binding activity of the hypochlorite-specific transcription factor HypT. PLoS One, 8, e75683. [DOI] [PMC free article] [PubMed] [Google Scholar]
- 40. Drazic, A., Gebendorfer, K.M., Mak, S., Steiner, A., Krause, M., Bepperling, A. and Winter, J. (2014) Tetramers are the activation-competent species of the hocl-specific transcription factor HypT. J. Biol. Chem., 289, 977–986. [DOI] [PMC free article] [PubMed] [Google Scholar]
- 41. Parker, B.W., Schwessinger, E.A., Jakob, U. and Gray, M.J. (2013) The RclR protein is a reactive chlorine-specific transcription factor in Escherichia coli. J. Biol. Chem., 288, 32574–32584. [DOI] [PMC free article] [PubMed] [Google Scholar]
- 42. Königstorfer, A., Ashby, L.V., Bollar, G.E., Billiot, C.E., Gray, M.J., Jakob, U., Hampton, M.B. and Winterbourn, C.C. (2021) Induction of the reactive chlorine-responsive transcription factor RclR in Escherichia coli following ingestion by neutrophils. Pathog. Dis., 79, 1–8. [DOI] [PMC free article] [PubMed] [Google Scholar]
- 43. Liu, T.W., Gammon, S.T., Yang, P., Fuentes, D. and Worms, D.P. (2021) Myeloid cell derived HOCl is a paracrine effector that trans-inhibits IKK/NF-kB in melanoma cells and limits early tumor progression. Sci. Signal., 14, 1–18. [DOI] [PMC free article] [PubMed] [Google Scholar]
- 44. Pullar, J.M., Winterbourn, C.C. and Vissers, M.C.M. (2002) The effect of hypochlorous acid on the expression of adhesion molecules and activation of NF-κB in cultured human endothelial cells. Antioxid. Redox Signal., 4, 5–15. [DOI] [PubMed] [Google Scholar]
- 45. Midwinter, R.G., Cheah, F.C., Moskovitz, J., Vissers, M.C. and Winterbourn, C.C. (2006) IκB is a sensitive target for oxidation by cell-permeable chloramines: inhibition of NF-κB activity by glycine chloramine through methionine oxidation. Biochem. J., 396, 71–78. [DOI] [PMC free article] [PubMed] [Google Scholar]
- 46. Pi, J., Zhang, Q., Woods, C.G., Wong, V., Collins, S. and Andersen, M.E. (2008) Activation of Nrf2-mediated oxidative stress response in macrophages by hypochlorous acid. Toxicol. Appl. Pharmacol., 226, 236–243. [DOI] [PubMed] [Google Scholar]
- 47. Woods, C.G., Fu, J., Xue, P., Hou, Y., Pluta, L.J., Yang, L., Zhang, Q., Thomas, R.S., Andersen, M.E. and Pi, J. (2009) Dose-dependent transitions in Nrf2-mediated adaptive response and related stress responses to hypochlorous acid in mouse macrophages. Toxicol. Appl. Pharmacol., 238, 27–36. [DOI] [PMC free article] [PubMed] [Google Scholar]
- 48. Zhao, P. and Zhang, Z. (2018) TNF-α promotes colon cancer cell migration and invasion by upregulating TROP-2. Oncol. Lett., 15, 3820–3827. [DOI] [PMC free article] [PubMed] [Google Scholar]
- 49. Guerra, E., Trerotola, M., Aloisi, A.L., Tripaldi, R., Vacca, G., La Sorda, R., Lattanzio, R., Piantelli, M. and Alberti, S. (2013) The Trop-2 signalling network in cancer growth. Oncogene, 32, 1594–1600. [DOI] [PubMed] [Google Scholar]
- 50. Varughese, J., Cocco, E., Bellone, S., Ratner, E., Silasi, D.A., Azodi, M., Schwartz, P.E., Rutherford, T.J., Buza, N., Pecorelli, S.et al. (2011) Cervical carcinomas overexpress human trophoblast cell-surface marker (Trop-2) and are highly sensitive to immunotherapy with hRS7, a humanized monoclonal anti-Trop-2 antibody. Am. J. Obstet. Gynecol., 205, 567.e1–567.e7. [DOI] [PMC free article] [PubMed] [Google Scholar]
- 51. Kanda, M., Tanaka, H., Shimizu, D., Miwa, T., Umeda, S., Tanaka, C., Kobayashi, D., Hattori, N., Suenaga, M., Hayashi, M.et al. (2018) SYT7 acts as a driver of hepatic metastasis formation of gastric cancer cells. Oncogene, 37, 5355–5366. [DOI] [PubMed] [Google Scholar]
- 52. Xiao, B., Li, J., Fan, Y., Ye, M., Lv, S., Xu, B., Chai, Y., Zhou, Z., Wu, M. and Zhu, X. (2017) Downregulation of SYT7 inhibits glioblastoma growth by promoting cellular apoptosis. Mol. Med. Rep., 16, 9017–9022. [DOI] [PubMed] [Google Scholar]
- 53. Xu, G., Wei, X., Tu, Q. and Zhou, C. (2020) Up-regulated microRNA-33b inhibits epithelial-mesenchymal transition in gallbladder cancer through down-regulating CROCC. Biosci. Rep., 40, BSR20190108. [DOI] [PMC free article] [PubMed] [Google Scholar]
- 54. Zhang, Z.M., Wang, Y., Huang, R., Liu, Y.P., Li, X., Hu, F.L., Zhu, L., Wang, F., Cui, B.B., Dong, X.S.et al. (2014) TFAP2E hypermethylation was associated with survival advantage in patients with colorectal cancer. J. Cancer Res. Clin. Oncol., 140, 2119–2127. [DOI] [PMC free article] [PubMed] [Google Scholar]
- 55. Li, X., Glubrecht, D.D. and Godbout, R. (2010) AP2 transcription factor induces apoptosis in retinoblastoma cells. Genes Chromosomes Cancer, 49, 819–830. [DOI] [PMC free article] [PubMed] [Google Scholar]
- 56. Uchida, C., Gee, E., Ispanovic, E. and Haas, T.L. (2008) JNK as a positive regulator of angiogenic potential in endothelial cells. Cell Biol. Int., 32, 769–776. [DOI] [PubMed] [Google Scholar]
- 57. Minamino, T., Yujiri, T., Papst, P.J., Chan, E.D., Johnson, G.L. and Terada, N. (1999) MEKK1 suppresses oxidative stress-induced apoptosis of embryonic stem cell-derived cardiac myocytes. Proc. Natl. Acad. Sci. U. S. A., 96, 15127–15132. [DOI] [PMC free article] [PubMed] [Google Scholar]
- 58. Wang, M.C., Bohmann, D. and Jasper, H. (2003) JNK signaling confers tolerance to oxidative stress and extends lifespan in Drosophila. Dev. Cell, 5, 811–816. [DOI] [PubMed] [Google Scholar]
- 59. Tournier, C., Hess, P., Yang, D.D., Xu, J., Turner, T.K., Nimnual, A., Bar-Sagi, D., Jones, S.N., Flavell, R.A. and Davis, R.J. (2000) Requirement of JNK for stress-induced activation of the cytochrome c- mediated death pathway. Science, 288, 870–874. [DOI] [PubMed] [Google Scholar]
- 60. Gioia, L., Siddique, A., Head, S.R., Salomon, D.R. and Su, A.I. (2018) A genome-wide survey of mutations in the Jurkat cell line. BMC Genomics, 19, 1–13. [DOI] [PMC free article] [PubMed] [Google Scholar]
- 61. Audit, B., Zaghloul, L., Vaillant, C., Chevereau, G., d’Aubenton-Carafa, Y., Thermes, C. and Arneodo, A. (2009) Open chromatin encoded in DNA sequence is the signature of “master” replication origins in human cells. Nucleic Acids Res., 37, 6064–6075. [DOI] [PMC free article] [PubMed] [Google Scholar]
- 62. Cayrou, C., Ballester, B., Peiffer, I., Fenouil, R., Coulombe, P., Andrau, J.C., Van Helden, J. and Méchali, M. (2015) The chromatin environment shapes DNA replication origin organization and defines origin classes. Genome Res., 25, 1873–1885. [DOI] [PMC free article] [PubMed] [Google Scholar]
- 63. Toubiana, S. and Selig, S. (2020) Human subtelomeric DNA methylation: regulation and roles in telomere function. Curr. Opin. Genet. Dev., 60, 9–16. [DOI] [PubMed] [Google Scholar]
- 64. Lee, D.D., Leão, R., Komosa, M., Gallo, M., Zhang, C.H., Lipman, T., Remke, M., Heidari, A., Nunes, N.M., Apolónio, J.D.et al. (2019) DNA hypermethylation within TERT promoter upregulates TERT expression in cancer. J. Clin. Invest., 129, 223–229. [DOI] [PMC free article] [PubMed] [Google Scholar]
- 65. Artandi, S.E. and DePinho, R.A. (2009) Telomeres and telomerase in cancer. Carcinogenesis, 31, 9–18. [DOI] [PMC free article] [PubMed] [Google Scholar]
- 66. Cawthon, R.M., Smith, K.R., O’Brien, E., Sivatchenko, A. and Kerber, R.A. (2003) Association between telomere length in blood and mortality in people aged 60 years or older. Lancet, 361, 393–395. [DOI] [PubMed] [Google Scholar]
- 67. Valdes, A.M., Andrew, T., Gardner, J.P., Kimura, M., Oelsner, E., Cherkas, L.F., Aviv, A. and Spector, T.D. (2005) Obesity, cigarette smoking, and telomere length in women. Lancet, 366, 662–664. [DOI] [PubMed] [Google Scholar]
- 68. Epel, E.S., Blackburn, E.H., Lin, J., Dhabhar, F.S., Adler, N.E., Morrow, J.D. and Cawthon, R.M. (2004) Accelerated telomere shortening in response to life stress. Proc. Natl. Acad. Sci. USA, 101, 17312–17315. [DOI] [PMC free article] [PubMed] [Google Scholar]
- 69. Von Zglinicki, T. (2002) Oxidative stress shortens telomeres. Trends Biochem. Sci., 27, 339–344. [DOI] [PubMed] [Google Scholar]
- 70. Von Zglinicki, T. (2000) Role of oxidative stress in telomere length regulation and replicative senescence. Ann. N. Y. Acad. Sci., 908, 99–110. [DOI] [PubMed] [Google Scholar]
- 71. Zhang, D.H., Chen, J.Y., Hong, C.Q., Yi, D.Q., Wang, F. and Cui, W. (2014) High-risk human papillomavirus infection associated with telomere elongation in patients with esophageal squamous cell carcinoma with poor prognosis. Cancer, 120, 2673–2683. [DOI] [PubMed] [Google Scholar]
- 72. Kurz, D.J., Decary, S., Hong, Y., Trivier, E., Akhmedov, A. and Erusalimsky, J.D. (2004) Chronic oxidative stress compromises telomere integrity and accelerates the onset of senescence in human endothelial cells. J. Cell Sci., 117, 2417–2426. [DOI] [PubMed] [Google Scholar]
- 73. Kim, N.W., Piatyszek, M.A., Prowse, K.R., Harley, C.B., West, M.D., Ho, P.L., Coviello, G.M., Wright, W.E., Weinrich, S.L. and Shay, J.W. (1994) Specific association of human telomerase activity with immortal cells and cancer. Science, 266, 2011–2015. [DOI] [PubMed] [Google Scholar]
- 74. Buxton, J.L., Suderman, M., Pappas, J.J., Borghol, N., McArdle, W., Blakemore, A.I.F., Hertzman, C., Power, C., Szyf, M. and Pembrey, M. (2014) Human leukocyte telomere length is associated with DNA methylation levels in multiple subtelomeric and imprinted loci. Sci. Rep., 4, 1–8. [DOI] [PMC free article] [PubMed] [Google Scholar]
- 75. Vera, E., Canela, A., Fraga, M.F., Esteller, M. and Blasco, M.A. (2008) Epigenetic regulation of telomeres in human cancer. Oncogene, 27, 6817–6833. [DOI] [PubMed] [Google Scholar]
- 76. Gonzalo, S., Jaco, I., Fraga, M.F., Chen, T., Li, E., Esteller, M. and Blasco, M.A. (2006) DNA methyltransferases control telomere length and telomere recombination in mammalian cells. Nat. Cell Biol., 8, 416–424. [DOI] [PubMed] [Google Scholar]
- 77. Blasco, M.A. (2007) The epigenetic regulation of mammalian telomeres. Nat. Rev. Genet., 8, 299–309. [DOI] [PubMed] [Google Scholar]
- 78. Benetti, R., García-Cao, M. and Blasco, M.A. (2007) Telomere length regulates the epigenetic status of mammalian telomeres and subtelomeres. Nat. Genet., 39, 243–250. [DOI] [PubMed] [Google Scholar]
- 79. Lee, D.D., Komosa, M., Nunes, N.M. and Tabori, U. (2020) DNA methylation of the TERT promoter and its impact on human cancer. Curr. Opin. Genet. Dev., 60, 17–24. [DOI] [PubMed] [Google Scholar]
- 80. Hock, B.D., Taylor, K.G., Cross, N.B., Kettle, A.J., Hampton, M.B. and McKenzie, J.L. (2012) Effect of activated human polymorphonuclear leucocytes on T lymphocyte proliferation and viability. Immunology, 137, 249–258. [DOI] [PMC free article] [PubMed] [Google Scholar]
- 81. Stevens, A.J., Rucklidge, J.J., Darling, K.A., Eggleston, M.J.F., Pearson, J.F. and Kennedy, M.A. (2018) Methylomic changes in response to micronutrient supplementation and MTHFR genotype. Epigenomics, 10, 1201–1214. [DOI] [PubMed] [Google Scholar]
- 82. Maksimovic, J., Phipson, B. and Oshlack, A. (2017) A cross-package Bioconductor workflow for analysing methylation array data. F1000Research, 5, 1–51. [DOI] [PMC free article] [PubMed] [Google Scholar]
- 83. Ritchie, M.E., Phipson, B., Wu, D., Hu, Y., Law, C.W., Shi, W. and Smyth, G.K. (2015) limma powers differential expression analyses for RNA-sequencing and microarray studies. Nucleic Acids Res., 43, e47–e47. [DOI] [PMC free article] [PubMed] [Google Scholar]
- 84. Touleimat, N. and Tost, J. (2012) Complete pipeline for Infinium® Human Methylation 450K BeadChip data processing using subset quantile normalization for accurate DNA methylation estimation. Epigenomics, 4, 325–341. [DOI] [PubMed] [Google Scholar]
- 85. Pidsley, R., Zotenko, E., Peters, T.J., Lawrence, M.G., Risbridger, G.P., Molloy, P., Van Djik, S., Muhlhausler, B., Stirzaker, C. and Clark, S.J. (2016) Critical evaluation of the Illumina MethylationEPIC BeadChip microarray for whole-genome DNA methylation profiling. Genome Biol., 17, 1–17. [DOI] [PMC free article] [PubMed] [Google Scholar]
- 86. Noble, A.J., Pearson, J.F., Boden, J.M., Horwood, L.J., Gemmell, N.J., Kennedy, M.A. and Osborne, A.J. (2021) A validation of Illumina EPIC array system with bisulfite-based amplicon sequencing. PeerJ, 9, e10762. [DOI] [PMC free article] [PubMed] [Google Scholar]
- 87. Stevens, A.J., Stuffrein-Roberts, S., Cree, S.L., Gibb, A., Miller, A.L., Doudney, K., Aitchison, A., Eccles, M.R., Joyce, P.R., Filichev, V.V.et al. (2014) G-quadruplex structures and CPG methylation cause drop-out of the maternal allele in polymerase chain reaction amplification of the imprinted MEST gene promoter. PLoS One, 9, 1–24. [DOI] [PMC free article] [PubMed] [Google Scholar]
- 88. Krueger, F. and Andrews, S.R. (2011) Bismark: a flexible aligner and methylation caller for Bisulfite-Seq applications. Bioinformatics, 27, 1571–1572. [DOI] [PMC free article] [PubMed] [Google Scholar]
- 89. Bland, J.M. and Altman, D.G. (1986) Statistical methods for assessing agreement between two methods of clinical measurement. Lancet, 1, 307–310. [PubMed] [Google Scholar]
- 90. Phipson, B. and Oshlack, A. (2014) DiffVar: a new method for detecting differential variability with application to methylation in cancer and aging. Genome Biol., 15, 465. [DOI] [PMC free article] [PubMed] [Google Scholar]
- 91. Phipson, B., Maksimovic, J. and Oshlack, A. (2016) (2016) missMethyl: an R package for analyzing data from Illumina’s HumanMethylation450 platform. missMethyl: an R package for analyzing data from Illumina’s HumanMethylation450 platform. Bioinformatics, 32, 286–288. [DOI] [PubMed] [Google Scholar]
- 92. Du, P., Zhang, X., Huang, C.C., Jafari, N., Kibbe, W.A., Hou, L. and Lin, S.M. (2010) Comparison of Beta-value and M-value methods for quantifying methylation levels by microarray analysis. BMC Bioinformatics, 11, 587. [DOI] [PMC free article] [PubMed] [Google Scholar]
- 93. Kanehisa, M. and Goto, S. (2000) KEGG: Kyoto Encyclopedia of Genes and Genomes. Nucleic Acids Res., 28, 27–30. [DOI] [PMC free article] [PubMed] [Google Scholar]
- 94. Lin, S.M., Du, P., Huber, W. and Kibbe, W.A. (2008) Model-based variance-stabilizing transformation for Illumina microarray data. Nucleic Acids Res., 36, 1–9. [DOI] [PMC free article] [PubMed] [Google Scholar]
- 95. Li, H. and Durbin, R. (2009) Fast and accurate short read alignment with Burrows–Wheeler transform. Bioinformatics, 25, 1754–1760. [DOI] [PMC free article] [PubMed] [Google Scholar]
- 96. Dobin, A., Davis, C.A., Schlesinger, F., Drenkow, J., Zaleski, C., Jha, S., Batut, P., Chaisson, M. and Gingeras, T.R. (2013) STAR: ultrafast universal RNA-seq aligner. Bioinformatics, 29, 15–21. [DOI] [PMC free article] [PubMed] [Google Scholar]
- 97. Lawrence, M., Huber, W., Pagès, H., Aboyoun, P., Carlson, M., Gentleman, R., Morgan, M.T. and Carey, V.J. (2013) Software for computing and annotating genomic ranges. PLoS Comput. Biol., 9, 1–10. [DOI] [PMC free article] [PubMed] [Google Scholar]
- 98. Robinson, M.D., McCarthy, D.J. and Smyth, G.K. (2010) edgeR: a Bioconductor package for differential expression analysis of digital gene expression data. Bioinformatics, 26, 139–140. [DOI] [PMC free article] [PubMed] [Google Scholar]
- 99. Love, M.I., Huber, W. and Anders, S. (2014) Moderated estimation of fold change and dispersion for RNA-seq data with DESeq2. Genome Biol., 15, 550. [DOI] [PMC free article] [PubMed] [Google Scholar]
- 100. Young, M.D., Wakefield, M.J., Smyth, G.K. and Oshlack, A. (2010) Gene ontology analysis for RNA-seq: accounting for selection bias. Genome Biol., 11, R14–R14. [DOI] [PMC free article] [PubMed] [Google Scholar]
- 101. Mi, G., Di, Y., Emerson, S., Cumbie, J.S. and Chang, J.H. (2012) Length bias correction in gene ontology enrichment analysis using logistic regression. PLoS One, 7, e46128. [DOI] [PMC free article] [PubMed] [Google Scholar]
- 102. Carlson, M., Falcon, S., Pages, H., and Li, N. (2019) Hs. eg. db: genome wide annotation for Human. R package version 3. (2019).
- 103. Hamosh, A., Scott, A.F., Amberger, J., Bocchini, C., Valle, D. and McKusick, V.A. (2002) Online Mendelian Inheritance in Man (OMIM), a knowledgebase of human genes and genetic disorders. Nucleic Acids Res., 30, 52–55. [DOI] [PMC free article] [PubMed] [Google Scholar]
- 104. Huang, D.W., Sherman, B.T. and Lempicki, R.A. (2009) Systematic and integrative analysis of large gene lists using DAVID bioinformatics resources. Nat. Protoc., 4, 44–57. [DOI] [PubMed] [Google Scholar]
- 105. Huang, D.W., Sherman, B.T. and Lempicki, R.A. (2009) Bioinformatics enrichment tools: paths toward the comprehensive functional analysis of large gene lists. Nucleic Acids Res., 37, 1–13. [DOI] [PMC free article] [PubMed] [Google Scholar]
Associated Data
This section collects any data citations, data availability statements, or supplementary materials included in this article.