

Abstract
An electron solvated in a polar liquid is an elementary quantum system with properties governed by electric interactions with a fluctuating molecular environment. In the prevailing single particle picture, the quantum ground and excited states are determined by a self-consistent potential, as defined by the particular local configuration of the solvation shell. This description neglects collective many-body excitations, which arise from the coupling of electronic degrees of freedom and nuclear motions of the environment. While recent experiments have demonstrated collective nonequilbrium electronic–nuclear motion, i.e. polaron excitations in liquid water, their relevance in the broader context of polar liquids has remained unexplored. Here, we study the nonequilibrium dielectric response of the, compared to water, less polar alcohols isopropanol, and ethylene glycol, that also display a different hydrogen bond pattern. We demonstrate that ultrafast relaxation of photogenerated electrons impulsively induces coherent charge oscillations, which persist for some 10 ps. They emit electric waves in a frequency range from 0.1 to 2 THz, depending on electron concentration. Oscillation frequencies and line shapes are reproduced by a unified polaron picture for alcohols and water, which is based on a Clausius–Mossotti local field approach for the THz dielectric function. The analysis suggests a longitudinal character of many-body polaron excitations and a weak coupling to transverse excitations, supported by the underdamped character of charge oscillations. Polaron dynamics are governed by the long-range Coulomb interaction between an excess electron and several thousands of polar solvent molecules, while local electron solvation geometries play a minor role.
Keywords: solvated electron, polaron, ultrafast dynamics, water and alcohols
Significance Statement.
The solvated electron, a free electron hosted by a polar liquid, is subject to electric interactions with its environment. The conventional single particle picture of a quantum ground state confined in a potential minimum, defined by its local solvation shell, neglects collective degrees of freedom arising from the coupling of the electron to nuclear motions of solvent molecules. Here, we demonstrate that the nonequilibrium low-frequency response of water and alcohols of different polarity exhibits collective polaron oscillations, which are excited impulsively by electron relaxation and persist for tens of picoseconds. The oscillation frequency is determined by dipole–dipole interactions and electron concentration in the liquid, in line with a theoretical analysis of the dielectric response suggesting a longitudinal character of polarons.
Introduction
The solvation of electrons and ions in polar liquids plays a key role for their electrodynamic response in a wide time and frequency range, for charge transport, and for elementary processes in radiolysis (1, 2). The generic quantum mechanical description of the solvated electron in water and less-polar alcohols is based on a single-particle picture according to which the electron resides in a potential energy well, determined by its interaction with the liquid environment (Fig. 1a). The so-called cavity models invoke the formation of an excluded volume upon electron localization and a local hydrogen bond pattern of first and second shell solvent molecules which is different from the bulk liquid due to the orientation of OH groups toward the electron. Theoretical descriptions include calculations of stationary eigenstates of the electron in a solvent cluster by quantum–chemical methods, quantum–classical models in which the electron interacts via a pseudopotential with a dynamic classical solvent bath, and ab initio quantum molecular dynamics (MD) of the electron in a comparably small solvent box. An overview of the different methods has been given in recent review articles (1–3).
Fig. 1.

(a) Schematic of the localization process of a free electron in water. The electron generated by photoionization of a solvent molecule represents a wavepacket (blue line, instant in time T1), which propagates in the liquid and generates a local potential minimum (black line, left) via interaction with polar solvent molecules. Upon propagation, the kinetic energy of the electron is reduced by frictional forces in the liquid, the extension of the electron wavepacket shrinks, and the local potential becomes narrower and deeper (T2). Eventually, the electron localizes in the ground state of a self-consistent potential (T3). Inset: molecular orbital (blue contour) in the ground state of an electron solvated in H2O. (b) Generation of electrons in water (H2O), isopropyl alcohol (IPA), and ethylene glycol (EG) by multiphoton ionization with femtosecond 800-nm pulses. The electron concentration generated in the three solvents is plotted as a function of the 800-nm pulse energy (symbols, double logarithmic graph). A pulse energy of 100 μJ corresponds to a peak intensity of 4.8 TW/cm2. Solid lines: numerical fits with a slope of 5.5 for IPA, 5.7 for EG, and 6.5 for H2O.
In particular, the electron in water or aqueous electron has been a subject of extensive theoretical and experimental work, which has addressed equilibrium properties of this prototypical quantum system and particular aspects of nonequilibrium dynamics such as the relaxation processes following electron photoinjection. The equilibrium ground state of the electron in water has consistently been described by an s-like wavefunction with an electron radius of gyration of approximately 2.4 Å in a potential well of depth of some 5 eV. A similar picture for electrons in primary alcohols gives a somewhat different electron radius and binding energy (4–13). Dipole-allowed optical transitions between the s-like electron ground state and p-like excited states give rise to a broad electronic absorption band in the visible to near-infrared spectral range. The spectral position and line shape of this band are sensitive probes of the local electron potential.
Upon photoionization of water and/or alcohols, the generated free electrons undergo a subpicosecond localization process, accompanied by a reshaping of their potential until an equilibrium geometry is reached (Fig. 1a). Correspondingly, excitation of the equilibrated electron from its ground to excited states initiates a sequence of ultrafast relaxation processes, including the subpicosecond repopulation of the electronic ground state and dissipation of excess energy in a time range up to some 10 ps. For electrons in methanol, a picosecond transfer between potential minima of different depth has been claimed (14,15).
Insight in many-body interactions between the electron and the liquid environment has remained very limited. In particular, any collective degrees of freedom with a hybrid electronic and vibrational character are barely understood. Very recently, first evidence for polaronic many-body excitations in water has been presented (16). The ultrafast relaxation of photogenerated free electrons excites coherent polarons which are connected with an oscillatory dielectric response of the liquid at terahertz (THz) frequencies.
Electrons solvated in other polar liquids allow for addressing the dielectric and structural many-body response in a broader context. Alcohols are most interesting systems to compare with, due to their wide range of polarity, hydrogen bond structure, and dynamic dielectric response (17). Here, we demonstrate the polaronic response of photogenerated electrons in ethylene glycol (EG) and isopropanol (IPA, 2-propanol). Extensive time-resolved experiments map the nonlinear THz response in a wide range of electron concentrations and provide direct evidence for polaron excitations displaying underdamped oscillations. The results are benchmarked by data for electrons solvated in water. The observed polaron frequencies between 0.1 and 2 THz are reproduced quantitatively by a local-field description based on the Clausius–Mossotti picture.
Materials and Methods
Samples
The measurements were performed with spectroscopy grade EG (> 99%; Sigma Aldrich), IPA (isopropyl alcohol, > 99.9%, Carl Roth), and ultrapure water (ROTIPURAN Ultra, Carl Roth). To water, 1% of soap (sulfo-amber-acid–bi(2’ethylexylester)) was added to ensure stable experimental conditions in a liquid water jet.
A gravity-driven liquid jet guided by two 300 μm thin stainless steel wires is used as the sample to avoid transmission artifacts and white light generation in windows. The jet thickness was adjusted by controlling the speed of the pump, height of upper liquid reservoir as well as the position of the excitation spot on the sample. The exact thicknesses of the samples were determined by measuring the temporal shift of THz transients transmitted through the jet relative to propagation without the sample. All measurements were performed at room temperature under a dry nitrogen atmosphere to avoid absorption from water vapor.
Two-dimensional (2D) optical pump–THz probe experiments
The 2D 800 nm-THz experiments were performed with a near-infrared pump–THz-probe setup. A commercial Ti: sapphire laser system (Coherent Libra HE and Vitesse) provides 66-fs, 800-nm pulses with a pulse energy of 3 mJ at a 1 kHz repetition rate. The laser output was split in two intense parts and a third weak component. The first intense pulse of an energy up to 500 μJ serves as a pump pulse, which generates electrons in the liquid by multiphoton ionization of solvent molecules. The electron concentration was in a range from ce ≈ 1 μM to ce ≈ 100 μM. The second intense pulse of 1 mJ drives a commercial THz generator (Avesta TERA-AX) based on a noncollinear optical rectification scheme in MgO doped LiNbO3. The spectrum of the subpicosecond THz pulses is centered at 0.7 THz. The third weak component serves as a probe pulse in the electrooptic sampling setup used for phase-resolved THz detection.
To ensure a large diameter of 800 nm pump beam, the 800-nm pulses were focused onto the liquid jet with a lens of a focal lens f = 1 m. They travel through a small hole in the focusing parabolic mirror for the THz probe pulses and both beams enter the sample collinearly. The respective spot size of the THz pulses and the 800-nm pulses on the sample was approximately 0.7 and 0.2 mm. The delay time τ between pump and probe is steered by a motorized optical delay line.
After transmission through the liquid jet, the pump pulse is blocked using a 1-cm thick PTFE filter, while the transmitted THz transients are measured in amplitude and phase by free-space electrooptic sampling. The change of refractive index induced by the THz field in a ZnTe electrooptic crystal is read out via the polarization change of a weak femtosecond 800-nm probe pulse. A second delay stage controls the temporal position of the probe relative to the THz pulse, thus defining the real time coordinate t. A 10-μm thick (110) ZnTe crystal mounted on a 500-μm thick (100) ZnTe serves for electrooptic sampling to avoid any signal distortions by back reflections. The transmitted probe pulse is split in two orthogonal components and detected by a balanced pair of photodiodes. The momentary THz electric field is directly proportional to the difference voltage between the balanced photodiodes.
Experimental results
We study electrons in EG (C2H6O2) with a static dielectric constant of ϵs = 37, in IPA (C3H8O) with ϵs = 17.9, and in water (H2O) with ϵs = 81. Free electrons are generated by multiphoton ionization of EG, IPA, or H2O molecules with 800-nm pump pulses of 66 fs duration and pulse energies between 60 and 150 μJ. Experimental details are given in the Materials and Methods section. After their generation, the electrons undergo the subpicosecond localization process (8,9, 14). For water, this process is illustrated schematically in Fig. 1(a).
The broad absorption band of the localized electrons in the visible to near-infrared spectral range serves for determining the electron concentration ce. The electron absorption is mapped by a weak 800-nm probe pulse at a delay time τ = 200 ps and ce is derived from the measured absorption strength and the molar extinction coefficients in the different liquids (18,19). In Fig. 1(b), ce is plotted as a function of the energy of the pump pulses for the three liquids. In the double-logarithmic plot, ce follows a linear dependence, i.e. a power law as a function of pulse energy. Numerical fits (solid lines) give a slope between 5.5 and 6.5 for the different curves, reflecting the multiphoton character of ionization with five to six photons of an energy of 1.55 eV. The different ionization potentials of the three liquids result in a shift of the generated ce with pulse energy and the highest slope for water, which has the highest ionization potential. While the two alcohol samples contain water at a concentration of up to 20 mM, their distinctly different behavior evident from Fig. 1(b) suggests a predominant ionization of alcohol molecules in the electron generation process.
The polaronic response is mapped via changes of the dielectric response of the liquids in the THz frequency range. The complex dielectric function ϵ(ν) = Re[ϵ(ν)] + iIm[ϵ(ν)] is related to the refractive index n(ν) = Re[n(ν)] + iIm[n(ν)] by Re[ϵ(ν)] = Re[n(ν)]2 − Im[n(ν)]2 and Im[ϵ(ν)] = 2Re[n(ν)]Im[n(ν)], while the absorption coefficient is given by  (
( : velocity of light). The THz refractive index and absorption of the liquids display broad overlapping spectral features determined by intermolecular degrees of freedom. In the nonlinear time-resolved experiments, changes of the dielectric function upon electron generation by the pump pulses are probed by weak THz pulses, which are transmitted through the excited sample and detected in an amplitude and phase-resolved way. The pump–probe signal
  represents the THz electric field
  transmitted through the excited sample minus the field Epr(t) transmitted without excitation. Here, t represents the real time as a function of which the THz fields are measured, and τ the pump–probe delay. Changes of the refractive index of the excited compared to unexcited samples result in a shift of the transmitted THz field along t, while changes of the absorption coefficient modify its amplitude.
Figure 2 summarizes results for an electron concentration ce = 70 μM in IPA. Panel (a) shows the pump–probe signal ENL(t, τ) as a function of real time t (abscissa) and delay time τ (ordinate). The maximum amplitude of the transmitted THz pulse (black line) as a function of t is chosen for defining t = 0. The red line represents ENL(t, τ = 8 ps) at 8 ps delay. The oscillatory character of the ENL(t, τ) leads to the stripe-like pattern parallel to the vertical axis. Due to causality, the signal exists only after excitation of the sample, leading to the upper edge of the stripe pattern oriented under an angle of 45°.
Fig. 2.

Nonlinear THz response of electrons solvated in isopropanol (IPA, electron concentration ce = 70 μM). (a) Nonlinear THz signal measured in an 800-nm pump/THz probe experiment. The nonlinear THz signal field ENL(t, τ) is plotted as a function of real time t (abscissa) and pump–probe delay τ (ordinate). Red line: cut of ENL(t, τ) at τ = 8 ps. Black line: THz probe pulse transmitted through the unexcited sample. (b) Frequency-domain signal ENL(νt, ντ) derived by a 2D Fourier transform of ENL(t, τ) plotted on a logarithmic scale as a function of excitation frequency ντ and detection frequency νt. The strong contours represent pump–probe signals. The weak signal at ντ = 1.2 THz marked by the elliptic dashed line is due to third-harmonic generation (cf. Fig. 3a). (c) Fourier back-transform of the pump–probe signals in panel (b), applying a Gaussian frequency filter of a 4-THz spectral width (FWHM).
A 2D Fourier transform of ENL(t, τ) along t and τ gives the frequency-domain signal ENL(νt, ντ) as a function of detection frequency νt and excitation frequency ντ (Fig. 2b), which consists of two peaks at (νt, ντ) = ( ± 0.9, 0) THz. Applying a Gaussian frequency filter of a 4-THz spectral width (FWHM) for noise reduction and transforming the signal back to the time domain results in the filtered pump–probe signal ENL(t, τ) plotted in panel (c).
To illustrate the effect of electron generation on the transmitted probe pulse most clearly, we perform a Fourier transform along real time t and consider transient pulse spectra. The contour in Fig. 3(a) shows the difference of the amplitude spectra  of the probe pulses transmitted through the excited sample [
 ] and the unexcited solvent [|Epr(νt)|]. The latter is shown in panel (b) (orange line), together with a cut of the contour at a delay time τ = 8 ps (blue line). At THz frequencies below 1.1 THz, one observes a negative ΔEpr(νt, τ) corresponding to an absorption increase, while ΔEpr(νt, τ) is positive at higher frequencies. As a function of τ, the difference ΔEpr(νt, τ) exhibits a step-like behavior with a sharp onset around τ = 0.
Fig. 3.

(a) Difference spectrum  as a function of detection frequency νt and delay time τ. (b) Amplitude spectrum of the probe pulse |Epr(νt)| transmitted through the unexcited sample (orange line) and cut through the contour of panel (a) at τ = 8 ps (blue line, cf. dashed line in panel a). (c) Difference signal ΔEpr(νt = 2 THz, τ) (orange line) and frequency excursion Δνcog(τ) of the center of gravity νcog(τ) of the transmitted probe spectrum from its time-averaged value
  . (d) Fourier spectrum of Δνcog(τ) (blue line) together with the polaron spectrum calculated from the Clausius–Mossotti analysis (red line).
On top of the step-like behavior, we observe oscillations with a frequency of ντ = 1.2 THz. They are directly visible in the difference ΔEpr(νt, τ) at a probe frequency νt = 2 THz =3 × 0.67 THz, the third harmonic of the probe pulse (Fig. 3a). Here, the step-like signal component is essentially absent. In the 2D-THz spectrum of Fig. 2(b), the third harmonic signal is located at ντ = 1.2 THz (within the dashed elliptic contour). In the spectrum of the transmitted probe pulse, the oscillatory response of the sample leads to periodic excursions of the center-of-gravity (cog) from its time-averaged position. The frequency position νcog(τ) of the cog at pump–probe delay τ is given by  . The transient frequency excursion
  of the center of gravity from its time-averaged value
  (Fig. 3c, blue line) displays oscillations with a frequency very close to what is found for ΔEpr(νt = 2 THz, τ) (orange line). The Fourier transform of the Δνcog(τ) oscillations is shown in Fig. 3(d) (blue line) and exhibits a maximum at 1.2 THz.
We note that the Δνcog(τ) method for extracting oscillation frequencies shows a higher numerical stability than a direct analysis of the transmitted probe field Epr(νt, τ) as applied in Ref. (16). This stability is required for the present data because of the presence of a step-like absorptive signal substantially stronger than the oscillatory contribution.
THz data were recorded for IPA and EG in a wide range of electron concentrations ce and benchmarked by results for H2O. In all cases, the transient THz response is similar to the results presented in Figs 2 and 3 with a frequency of the oscillating signal component depending on the particular solvent and electron concentration. In Fig. 4(a)–(c), we compare data for ce ≈ 40 μM in the three solvents. Panels (a–c) show the amplitude (normalized to its value at negative delay times) of the probe pulse transmitted through the sample |Epr(νt, τ)|/|Epr(νt, τ < 0)| as a function of the pump–probe delay τ. The particular probe frequencies νt were chosen in the range of enhanced sample absorption (cf. Fig. 3b). Upon electron generation by the pump pulse, the transmitted THz field decreases in a step-like fashion, superimposed by the oscillatory signal component. The transient changes Δνcog(τ) of the center of gravity of the transmitted probe spectrum are presented in Fig. 4(d)–(f), together with their Fourier transforms Δνcog(ντ) (blue curves) in panels (g) to (i). The Fourier spectra exhibit the major frequency components between 0.6 and 1.0 THz.
Fig. 4.

Ultrafast nonlinear THz response of electrons solvated in EG, IPA, and H2O. (a)–(c) Time-resolved pump–probe traces measured with multiphoton excitation of electrons by a femtosecond 800-nm pulse and THz probe pulses. The transient amplitude of the probe pulse transmitted through the sample Epr(νt, τ)/Epr(νt, τ < 0) at indicated probe frequencies νt is plotted as a function of the pump–probe delay τ. Upon electron generation by the pump pulse, the transmitted THz field decreases in a step-like fashion and displays an oscillatory component radiated from the excited sample. The oscillatory component corresponds to a frequency modulation of the transmitted probe pulse. The transient change of its center of gravity Δνcog(τ) is plotted in panels (d)–(f). (g)–(i) Fourier transforms of the oscillatory signals in panels (d)–(f) (blue solid lines, the dashed part around τ = 0 ps in panel (e) is ignored) and results of the Clausius–Mossotti analysis (red lines).
Discussion
The present experiments cover a range of electron concentrations from ce ≈ 1 μM to ce ≈ 100 μM. Assuming a spatially homogeneous electron distribution in the liquid, such concentrations translate into an average spatial separation of electrons of 120 nm for ce = 1 μM and 26 nm for ce = 100 μM. Such distances are large compared to the extension of the electron wavefunction in the s-like ground state with a radius of gyration of approximately 0.25 nm. Thus, the solvated electrons represent individually solvated species.
The macroscopic dielectric properties of polar liquids are determined by the spatially averaged response of the permanent molecular dipole moments to an external electric field and by their electronic polarizability. Moreover, the electric fields arising from the molecular dipoles are relevant. The latter reach local values of tens of megavolts/cm on a molecular length scale, but are much smaller on a macroscopic scale because of the random orientations of dipolar molecules. The presence of solvated electrons changes such dielectric properties by introducing in the liquid an additional electric field of radial direction, which affects solvent molecules in the liquid volume around. The Debye picture of dielectric screening in a dielectric continuum accounts for the spatial range of this electric field if the screening length of Coulomb interactions is distinctly longer than the next-neighbor distance between solvent molecules.
From the real parts of the THz dielectric constants Re(ϵ(1THz)) ≈ 3.2 of EG, Re(ϵ(1THz)) ≈ 2.25 of IPA, and Re(ϵ(1THz)) ≈ 5.0 of H2O, one estimates respective Debye lengths of LD = 6.1 nm, 5.1 nm, and 7.6 nm (ce = 100 μM). A spherical volume of radius LD contains approximately 10,000 EG molecules, 4,300 IPA molecules, and 61,000 H2O molecules, which are subject to the electric field originating from a solvated electron. For the highest electron concentration ce = 100 μM, approximately 1 % of the total liquid volume is affected by the modified Coulomb forces. The Debye lengths estimated here are much larger than the dimensions of individual molecules and/or the extension of the wavefunction of the solvated electrons and, thus, define a correlation length in the molecular ensemble. As a result, the detailed molecular arrangement at the electron solvation site is expected to play a minor role for the collective change of the dielectric function. On the other hand, the Debye lengths are substantially shorter than the geometric distance between solvation sites, even for ce = 100 μM. As a result, Coulomb coupling between individual electron sites is negligible.
We note that dielectric properties induced by solvated electrons require a theoretical treatment beyond the standard molecular picture of individual molecular dipoles in the liquid, which reorient under the action of an electric field and display a correlation length on the order of their size (20). In this picture, the longitudinal and transverse response functions converge to a single response function in the low-frequency limit, depending only on frequency and not on wavevector, and longitudinal relaxation is much faster than transverse relaxation at the dipole reorientation frequency. In contrast, the dielectric response in presence of solvated electrons is collective with a correlation length set by LD. Here, longitudinal and transverse response functions are different at low frequencies and the damping rates of longitudinal and transverse elementary excitations may be very different. A theoretical approach based on the microscopic current density rather than polarization accounts for this scenario and gives an almost vanishing longitudinal conductivity at frequencies below 2 THz (21).
The time-resolved THz response of EG, IPA, and water upon electron generation displays two components, a step-like and an oscillatory change of the amplitude of the nonlinear signal field ENL(t, τ). After photoionization of solvent molecules by the 800-nm pump pulse, the generated free electrons undergo a subpicosecond relaxation into their localized ground state. This process determines the time evolution of the nonlinear signal around delay zero. After localization, the presence of electrons causes a long-lived change of the refractive index and absorption coefficient of the sample (Fig. 3a) (22).
The oscillatory pump–probe signals (Figs 3c and 4d–f) are due to coherent polaron oscillations, impulsively excited via the subpicosecond localization and energy-loss processes of the photogenerated electrons. The electric interaction with its polar environment couples the electron to electronic and nuclear degrees of freedom of the dipolar solvent molecules, creating polaronic elementary excitations of a mixed electronic-vibrational character. The rapid change of local electric fields during electron relaxation excites polarons impulsively, i.e. generates a coherent superposition of polaron states on a time scale shorter than or comparable to the polaron oscillation period. This nonstationary wavepacket undergoes oscillations modulating the dielectric function of the liquid. Due to its dipolar character, the wavepacket gives rise to coherent THz emission, which contributes to the oscillatory pump–probe signals. Thousands of solvent molecules in a volume roughly set by the Debye length take part in the collective polaron oscillations.
The excited polarons can be visualized as radial waves involving oscillating space charge within the spherical volume, which is fully compensated by a ’surface charge’ located at the Debye screening length (23). As a result, both the solvated electron itself and the polaron oscillations do not create any longitudinal (radially directed) electric field outside the sphere. However, the longitudinal oscillations of all charged particles within the sphere modulate the polarizability of the entire spherical object, which can be detected by its emitted transverse fields.
The oscillatory signals at the third harmonic frequency of the THz probe field, which are observed for IPA (Fig. 3c) demonstrate that the coherent polarons also modify the third-order THz response of the liquid. This behavior suggests an extremely large third-order THz polarizability of solvated electrons which, in turn, depends sensitively on the coherent superposition of polaron states, i.e. the details of the polaronic wave packet. The third-harmonic signal feature in the 2D-THz spectrum of Fig. 2(b) at ντ = 1.2 THz overlaps with the sinc-function-like periodic structures of the 2D spectrum along ντ, originating from the step-like temporal onset of the (much larger) absorptive pump–probe signal. As a result, there are interferences between the third-harmonic contribution and the pump–probe signal. An in-depth study of this nonlinear THz response is beyond the scope of the present article and needs both further experimental and theoretical work.
A theoretical analysis of the polaronic response requires a many-body approach including long-range Coulomb interactions between the electron and a large number of dipolar and polarizable solvent molecules. Such a treatment is well beyond the established single-particle pictures of solvated electrons and existing MD simulations based on nonpolarizable alcohol models (24, 25). We, thus, analyze the polaronic response within a dielectric continuum model with linear screening of Coulomb interactions in the liquid. A gaussian electron wavepacket  , which has a time-dependent width (determined by η(t)) centered around the time-dependent position
  , generates a dielectric displacement field (26, 27)
 |
(1) |
with the elementary charge e. The semiclassical force field acting back on the electron during its localization process is given by the electric field distribution  with
with
 |
(2) |
where  and
and  are the Fourier transforms of
  and
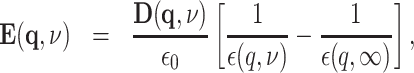
and  , ϵ0 the vacuum permittivity, and ϵ(q, ν) the (longitudinal) dielectric function of the liquid, depending on the wavevector q and frequency ν. The relevant wavevector range is given by q ≈ (2π)/LD with the nanometer Debye screening lengths derived above. For such comparably small q, the dielectric function ϵ(q, ν) at THz frequencies only displays a weak dependence on q which is neglected in the following.
The longitudinal dielectric functions of the solvents in the THz frequency range are not directly accessible by optical and/or dielectric measurements and, thus, essentially unknown. As an approximation, we instead use the well-characterized transverse dielectric functions ϵsolvent(ν) (28–30). In the THz frequency range, the real parts of the transverse and longitudinal dielectric functions are similar, while the imaginary part of the longitudinal function is substantially smaller (31). To account for the many-body interactions underlying the polaron excitations, a Clausius–Mossotti approach is applied (32). Both solvent molecules and electrons are treated as point-like particles, coupled through the electric dipole–dipole interaction and related local electric fields. The complex dielectric function ϵ(ν, ce) = Re[ϵ(ν, ce)] + iIm[ϵ(ν, ce)] depending on the electron concentration ce is given by
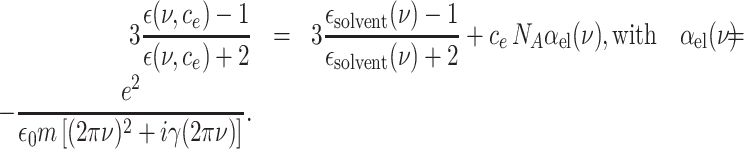 |
(3) |
Here, NA is the Avogadro constant, αel(ν) the frequency dependent polarizability of the electron (33), e the elementary charge, m the electron mass, and γ the local friction rate. The polarizability αel(ν) is represented by a Lorentzian with a width determined by γ.
The zero crossings Re[ϵ(ν, ce)] = 0 define the frequency positions of longitudinal resonances in the dielectric function, while their line shape is determined by −Im[1/ϵ(ν, ce)]. The resonances calculated with γ → 0 are shown in Figs 3(d) and 4(g)–(i) as red solid lines, together with the Fourier spectra of the oscillatory THz signals (blue lines). The good agreement of experiment and calculations for solvents of vastly different polarity and in a wide range of electron concentrations demonstrates the collective longitudinal character of the polaron excitations in polar liquids. The agreement of the frequency positions shows that a change of the local electric field with electron concentration determines the polaron frequency in all solvents studied here.
The experimentally observed polaron frequencies (symbols) are compared with the Clausius–Mossotti model (solid lines) in Fig. 5(a). In Ref. (16), we presented experimental values for polaron frequencies in H2O in a wider range of electron concentrations ce. Figure 5(b) shows the real parts of the dielectric function of the neat solvents as a function of frequency (dashed lines). While the spectral dependence is weak, the absolute values clearly differ. The solid lines in Fig. 5(b) display Re[ϵ(ν, ce)], the real part of the dielectric function with electrons present at a concentration ce = 40 μM. The zero crossings defining the polaron frequencies are close to each other, in agreement with experiment.
Fig. 5.
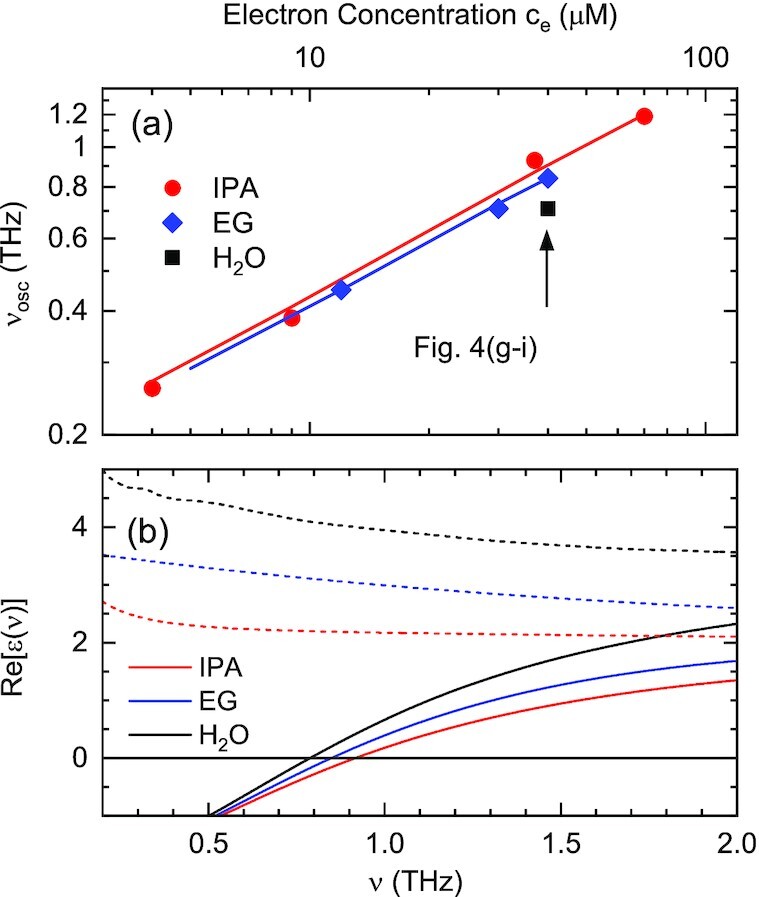
(a) Polaron frequency (symbols) as a function of the electron concentration ce for the three solvents H2O, IPA, and EG in a double logarithmic plot. The individual frequencies were derived from the numerical analysis of the respective data set. Solid lines: theoretically expected frequencies according to the Clausius–Mossotti model. (b) Real parts of the dielectric function of the neat solvents as a function of frequency (dashed lines) and of the solvents containing solvated electrons (solid lines, concentration ce= 40 μM). The zero crossings define the respective polaron frequency.
The oscillatory polaron response displays a surprisingly weak damping as is evident from the persistence of oscillations on a 10-ps time scale. We attribute this behavior to the longitudinal character of the polaron excitations. Contributions to the linewidth from the local friction rate γ are minor. Instead, the dephasing process is mainly determined by the imaginary part of the dielectric function of the solvent ϵsolvent(ν) at THz frequencies. As has been discussed in more detail in Ref. (16,21), the dephasing of longitudinal polaron excitations is governed by the correlation function of charge density, which is expected to decay much slower than the correlation function of electric current relevant for the dephasing of transverse polaron excitations.
In conclusion, our results provide evidence for a collective polaronic response of electrons solvated in alcohols of different polarity, much similar to their behavior in an even more polar aqueous environment. The polarons display a hybrid character, including electronic degrees of freedom and collective nuclear motions of solvent molecules. The local potential energy surface of the electron, which has been the subject of detailed single-electron treatments such as the cavity model, plays a minor role for the collective behavior, the latter being mediated by Coulomb interactions on a length scale much larger than the extension of the electron wavefunction. While the local electron potential with the different quantum states of the electron governs electronic excitations such as the absorption in the visible to near-infrared spectral range, polarons have a strong impact on the dielectric response in the THz frequency range of intermolecular collective excitations.
Notes
Competing Interest: The authors declare no competing interest.
Contributor Information
Poonam Singh, Max Born Institut für Nichtlineare Optik und Kurzzeitspektroskopie, Berlin 12489, Germany.
Jia Zhang, Max Born Institut für Nichtlineare Optik und Kurzzeitspektroskopie, Berlin 12489, Germany.
Ahmed Ghalgaoui, Max Born Institut für Nichtlineare Optik und Kurzzeitspektroskopie, Berlin 12489, Germany.
Klaus Reimann, Max Born Institut für Nichtlineare Optik und Kurzzeitspektroskopie, Berlin 12489, Germany.
Benjamin P Fingerhut, Max Born Institut für Nichtlineare Optik und Kurzzeitspektroskopie, Berlin 12489, Germany.
Michael Woerner, Max Born Institut für Nichtlineare Optik und Kurzzeitspektroskopie, Berlin 12489, Germany.
Thomas Elsaesser, Max Born Institut für Nichtlineare Optik und Kurzzeitspektroskopie, Berlin 12489, Germany.
Funding
This research has received funding from the European Research Council (ERC) under the European Unions Horizon 2020 Research and Innovation program (grant agreements no. 833365 and no. 802817).
Authors' Contributions
T.E., M.W., and B.P.F. initiated, conceived, and supervised the study. P.S., J.Z., and A.G. performed the experiments. All authors contributed to the analysis of the results. P.S., K.R., M.W., B.P.F., and T.E. wrote the manuscript with input from all authors.
Data Availability
All data is included in the manuscript and/or supporting information.
References
- 1. Turi L, Rossky PJ. 2012. Theoretical studies of spectroscopy and dynamics of hydrated electrons. Chem Rev. 112:5641–5674. [DOI] [PubMed] [Google Scholar]
- 2. Herbert JM. 2019. Structure of the aqueous electron. Phys Chem Chem Phys. 21:20538–20565. [DOI] [PubMed] [Google Scholar]
- 3. Herbert JM, Jacobson LD. 2011. Nature’s most squishy ion: the important role of solvent polarization in the description of the hydrated electron. Int Rev Phys Chem. 30:1–48. [Google Scholar]
- 4. Zhu JJ, Cukier RI. 1993. Molecular dynamics simulation of an excess electron in methanol. J Chem Phys. 98:5679–5693. [Google Scholar]
- 5. Turi L, Mosyak A, Rossky PJ. 1997. Equilibrium structure, fluctuations, and spectroscopy of a solvated electron in methanol. J Chem Phys. 107:1970–1980. [Google Scholar]
- 6. Walker JA, Bartels DM. 2016. A simple ab initio model for the solvated electron in methanol. J Phys Chem A. 120:7240–7247. [DOI] [PubMed] [Google Scholar]
- 7. Pepin C, Goulet T, Houde D, Jay-Gerin JP. 1994. Femtosecond kinetic measurements of excess electrons in methanol: substantiation for a hybrid solvation mechanism. J Phys Chem. 98:7009–7113. [Google Scholar]
- 8. Shi X, Long FH, Lu H, Eisenthal KB, 1995. Electron solvation in neat alcohols. J Phys Chem. 99:6917–6922. [Google Scholar]
- 9. Walhout PK, et al. , 1995. Direct pump/probe spectroscopy of the near-IR band of the solvated electron in alcohols. Chem Phys Lett. 232:135–140. [Google Scholar]
- 10. Zhang X, Lin Y, Jonah CD, 1999. Anion and electron solvation in alcohols. Rad Phys Chem. 54:433–440. [Google Scholar]
- 11. Thaller A, Laenen R, Laubereau A. 2006. The precursors of the solvated electron in methanol studied by femtosecond pump-repump-probe spectroscopy. J Chem Phys. 124:024515. [DOI] [PubMed] [Google Scholar]
- 12. Tauber MJ, Stuart CM, Mathies RA. 2003. Resonance Raman spectra of electrons solvated in liquid alcohols. J Am Chem Soc. 126:3414–3415. [DOI] [PubMed] [Google Scholar]
- 13. Stuart CM, Tauber MJ, Mathies RA. 2007. Structure and dynamics of the solvated electron in alcohols from resonance Raman spectroscopy. J Phys Chem A. 111:8390–8400. [DOI] [PubMed] [Google Scholar]
- 14. Nishitani J, Yamamoto Y, West CW, Karashima S, Suzuki T. 2019. Binding energy of solvated electrons and retrieval of true UV photoelectron spectra of liquids. Sci Adv. 5:eaaw6896. [DOI] [PMC free article] [PubMed] [Google Scholar]
- 15. Hara A, Yamamoto Y, Suzuki T. 2019. Solvated electron formation from the conduction band of liquid methanol: transformation from a shallow to deep trap state. J Chem Phys. 98:114503. [DOI] [PubMed] [Google Scholar]
- 16. Ghalgaoui A, Fingerhut BP, Reimann K, Elsaesser T, Woerner M. 2021. Terahertz polaron oscillations of electrons solvated in liquid water. Phys Rev Lett. 126:097401. [DOI] [PubMed] [Google Scholar]
- 17. Fukusawa T, et al. 2005. Relation between dielectric and low-frequency Raman spectra of hydrogen-bonded liquids. Phys Rev Lett. 95:197802. [DOI] [PubMed] [Google Scholar]
- 18. Sauer MC, Arai S, Dorfman LM. 1965. Pulse radiolysis studies. vii. The absorption spectra and radiation chemical yields of the solvated electron in the aliphatic alcohols. J Chem Phys. 42:708–712. [Google Scholar]
- 19. Hare PM, Price EA, Bartels DM. 2008. Hydrated electron extinction coefficient revisited. J Phys Chem A. 112:6800–6802. [DOI] [PubMed] [Google Scholar]
- 20. Madden P, Kivelson D. 1984. A consistent molecular treatment of dielectric phenomena. In: Prigogine I, Rice SA, editors. Advances in chemical physics. 56. Hoboken (NJ): John Wiley & Sons, Ltd, p. 467–566. [Google Scholar]
- 21. Woerner M, Fingerhut BP, Elsaesser T. 2022. Field-induced electron generation in water: solvation dynamics and many-body interactions. J Phys Chem B. 126:2621–2634. [DOI] [PubMed] [Google Scholar]
- 22. Ghalgaoui A, et al. , 2020. Field-induced tunneling ionization and terahertz-driven electron dynamics in liquid water. J Phys Chem Lett. 11:7717–7722. [DOI] [PMC free article] [PubMed] [Google Scholar]
- 23. Fröhlich H, 1954. Electrons in lattice fields. Adv Phys. 3:325–361. [Google Scholar]
- 24. Kaiser A, et al. , 2014. Ethylene glycol revisited: molecular dynamics simulations and visualization of the liquid and its hydrogen-bond network. J Mol Liq. 189:20–29. [DOI] [PMC free article] [PubMed] [Google Scholar]
- 25. Pothoczki S, Puztai L, Bako I. 2019. Molecular dynamics simulation studies of the temperature-dependent structure and dynamics of isopropanol-water liquid mixtures at low alcohol content. J Phys Chem B. 123:7599–7610. [DOI] [PubMed] [Google Scholar]
- 26. Peeters FM, Devreese JT. 1985. Radius, self-induced potential, and number of virtual optical phonons of a polaron. Phys Rev B. 31:4890–4899. [DOI] [PubMed] [Google Scholar]
- 27. Bowlan P, et al. , 2012, Nonlinear electron transport in an electron-hole plasma. Phys Rev B. 85:165206. [Google Scholar]
- 28. Gavdush AA, et al. , 2019; A method for reconstruction of terahertz dielectric response of thin liquid samples. In: Ferraro P, Grilli S, Ritsch-Marte M, Hitzenberger CK, editors. Optical methods for inspection, characterization, and imaging of biomaterials IV. 11060. Bellingham (WA): International Society for Optics and Photonics, SPIE, p. 198–205. [Google Scholar]
- 29. Sarkar S, Saha D, Banerjee S, Mukherjee A, Mandal P. 2017. Broadband terahertz dielectric spectroscopy of alcohols. Chem Phys Lett. 678:65–71. [Google Scholar]
- 30. Zelsmann HR. 1995. Temperature dependence of the optical constants for liquid H2O and D2O in the far IR region. J Mol Struct. 350:95–114. [Google Scholar]
- 31. Bopp PA, Kornyshev AA, Sutmann G. 1998. Frequency and wave-vector dependent dielectric function of water: collective modes and relaxation spectra. J Chem Phys. 109:1939–1958. [Google Scholar]
- 32. Hannay JH. 1983. The Clausius-Mosotti equation: an alternative derivation. Eur J Phys. 4:141–143. [Google Scholar]
- 33. Kubo R. 1957. Statistical-mechanical theory of irreversible processes. I. J Phys Soc Jpn. 12:570–586. [Google Scholar]
Associated Data
This section collects any data citations, data availability statements, or supplementary materials included in this article.
Data Availability Statement
All data is included in the manuscript and/or supporting information.