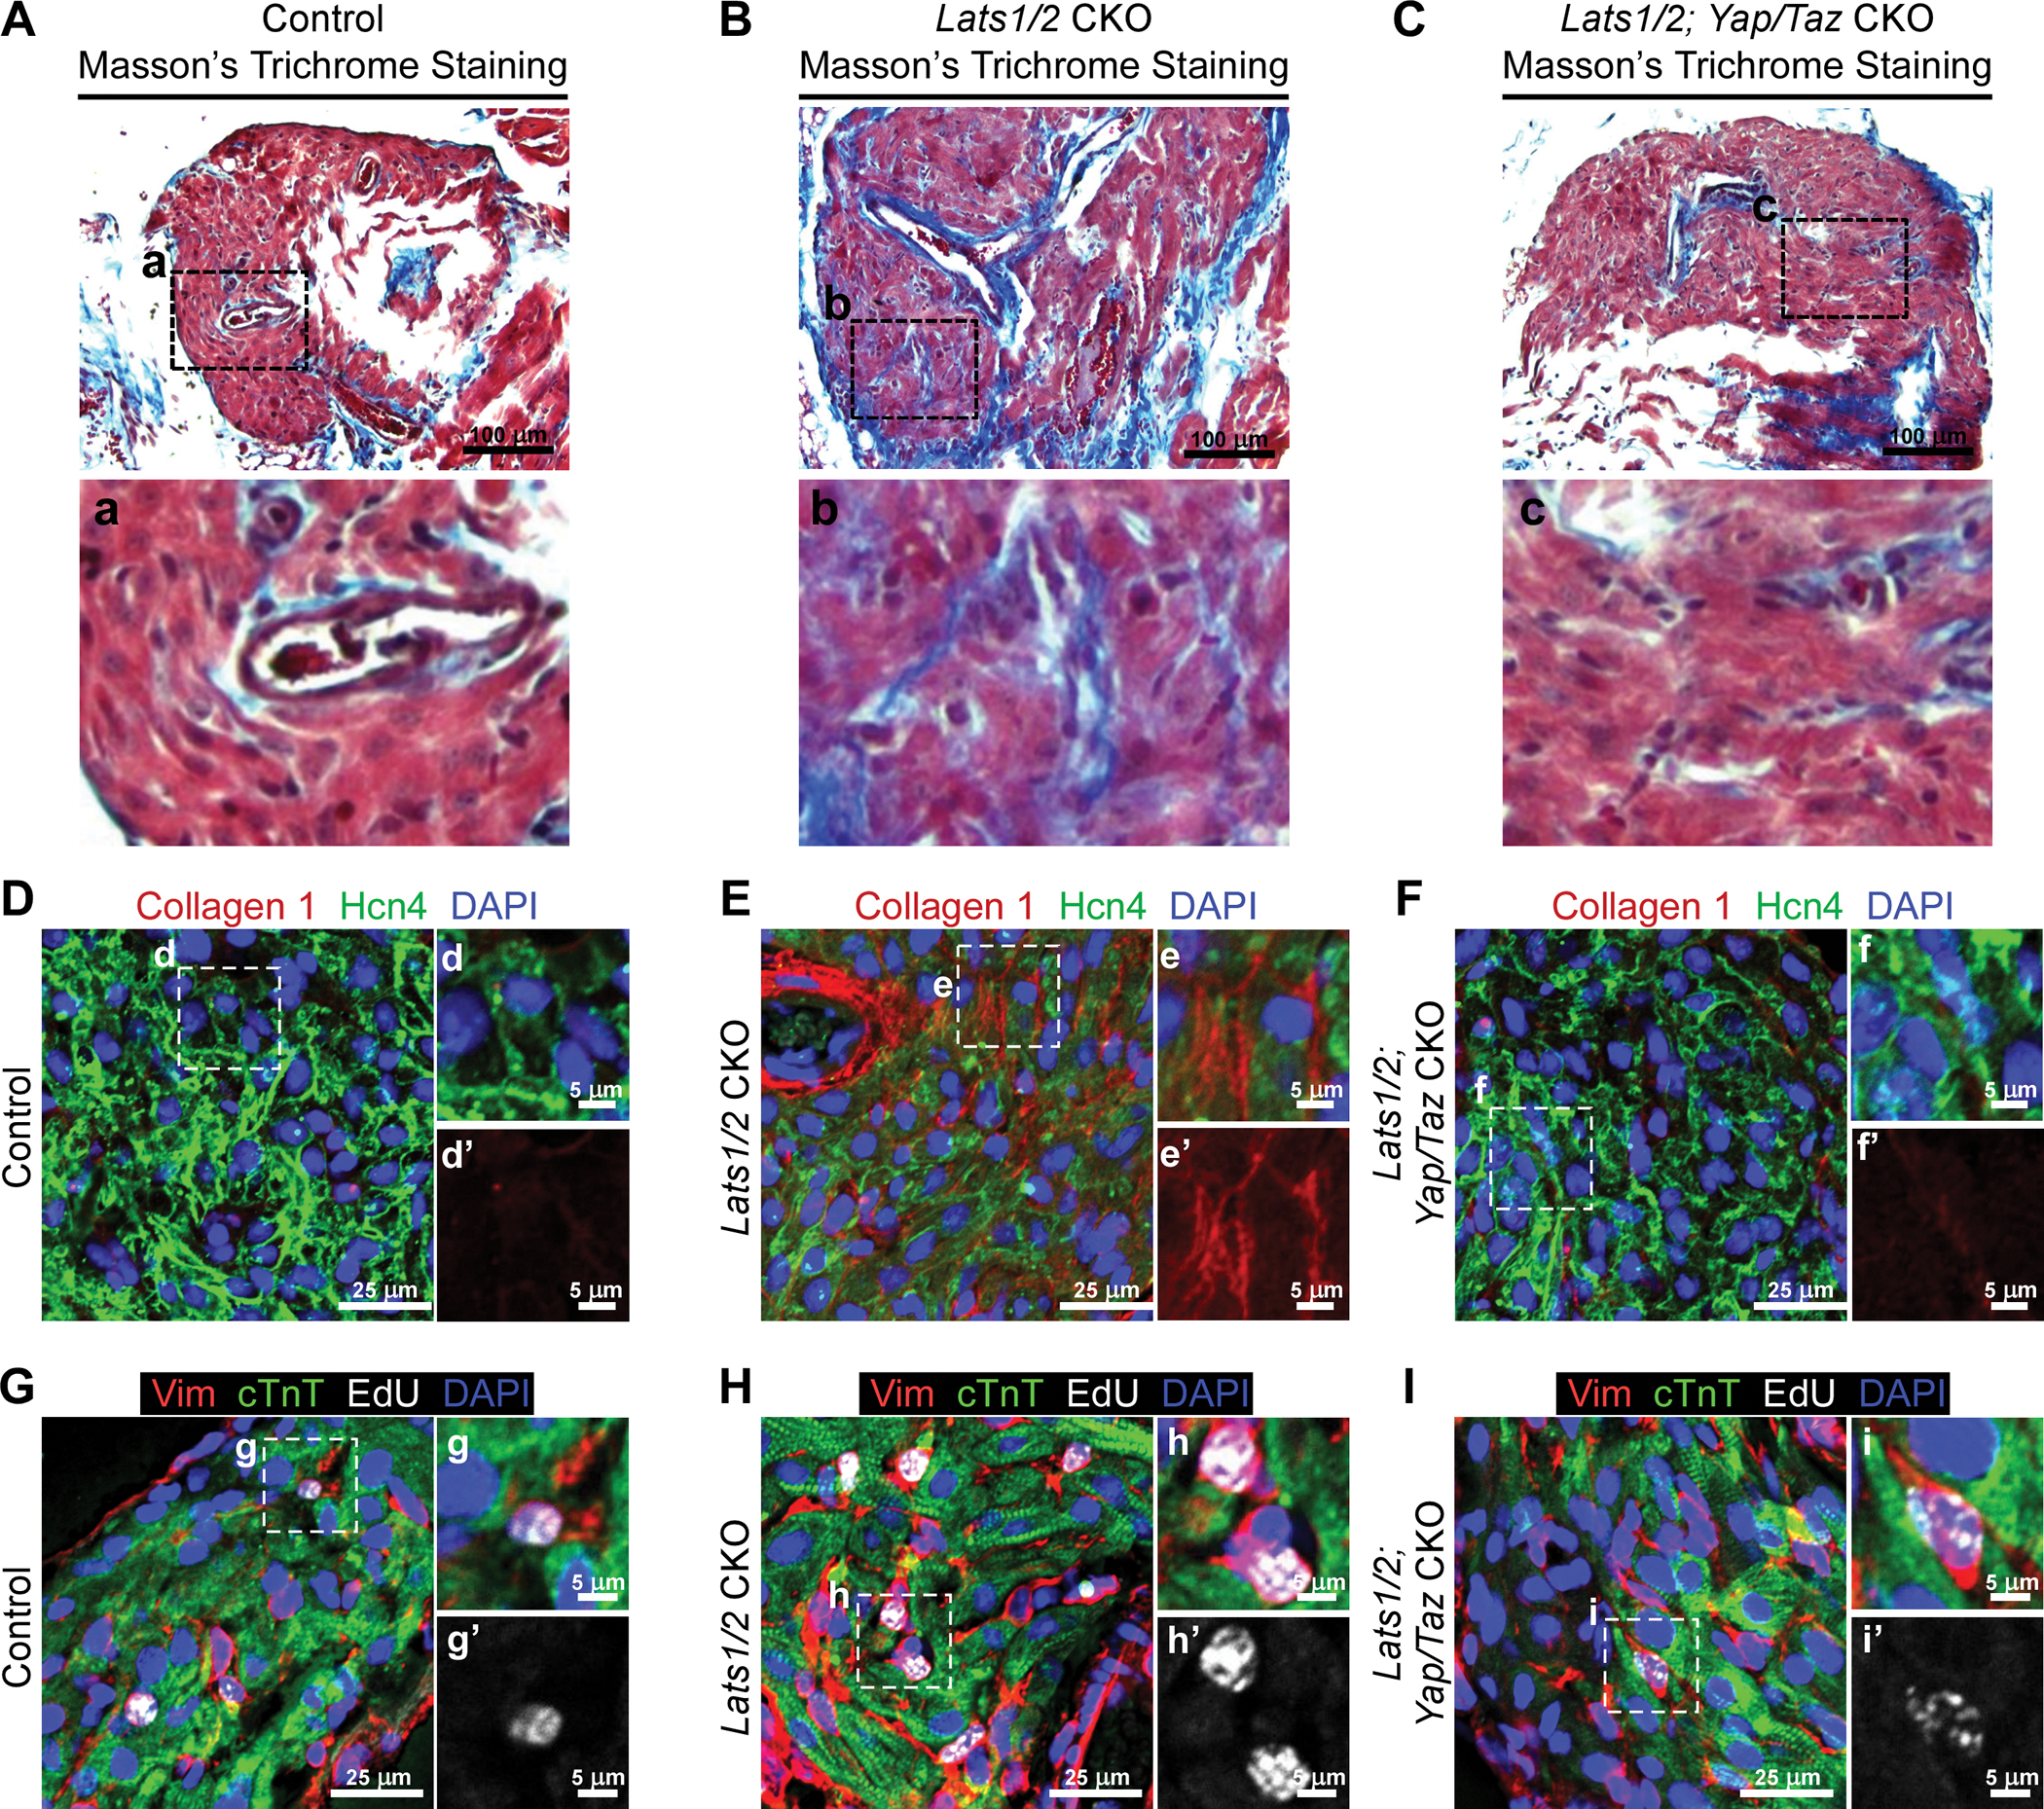
Figure 5. Yap/Taz deletion in Lats1/2 CKO rescues SAN fibrosis and fibroblast proliferation.

A-C. Masson’s Trichrome staining in control (A), Lats1/2 CKO (B), and Lats1/2; Yap/Taz CKO (C) SANs. Lower panels show higher magnification of the boxed areas from the upper panels. Scale bar, 100 μm. D-F. Representative immunofluorescence confocal images of Collagen 1 (red) from control (D), Lats1/2 CKO (E), and Lats1/2; Yap/Taz CKO (F) SANs. Hcn4 are stained with green, and nuclei are stained with blue. The right-hand panels show higher magnification of the boxed areas in the left-hand panels. Scale bar, 25 μm and 5 μm. G-I. Representative images of EdU-labeled control (G), Lats1/2 CKO (H), and Lats1/2; Yap/Taz CKO (I) SANs. Samples were pulse-chased with EdU (white); fibroblasts and PCs were labeled with vimentin (red) and cTnT (green), respectively. Nuclei were stained with DAPI (blue). Right-hand panels show higher magnification of boxed areas in left-hand panels. Scale bar, 25 μm and 5 μm.
