

Abstract
We report an integrated platform that enabled a seamlessly coupling miniaturized filter-aided sample preparation (MICROFASP) method to high-pH reversed phase (RP) or strong cation exchange (SCX) microreactors for low-loss sample preparation and fractionation of 1 μg of cell lysates prior to LC-ESI-MS/MS analysis. Due to the reduced size of the microreactor, only 5 μL of buffer volume is required to generate each fraction, which speeds both elution and lyophilization. The fraction was directly eluted into an autosampler insert vial for LC−MS analysis to reduce sample transfer steps and minimize sample loss as well as contamination. The flow-through sample generated during the loading step was also collected and analyzed. The integrated platform generated 48,890 unique peptides and 4723 protein groups from 1 μg of a K562 cell lysate using MICROFASP and C18 microreactor-based high-pH RP fractionation methods, which are comparable with the state-of-the-art result using in-StageTip sample preparation and nanoflow RPLC-based fractionation methods but with a significant reduction in cost and time. Both pH gradient elution and salt gradient elution approaches provide high reproducibility for the SCX microreactor-based fractionation method. This integrated platform has significant potential in deep proteomics analysis of mass-limited samples with reduced time and equipment requirements.
INTRODUCTION
Mass spectrometry-based proteomics is a powerful tool in biological research.1−4 A typical workflow for proteomics analysis consists of sample preparation followed by reversed phase liquid chromatography (RPLC) or capillary zone electrophoresis (CZE) separation,5−7 tandem mass spectrometry (MS/MS) analysis, and bioinformatics analysis.8−10 One-dimensional (1D) high-resolution RPLC−MS/MS has become a dominant platform for deep, high-throughput, and highly sensitive bottom-up proteomics. However, due to the wide dynamic range of the proteins in the complex proteomes, fractionation of peptides prior to RPLC or CZE-MS/MS analysis is critical to decrease sample complexity and two-dimensional (2D) separation is crucial for improving the proteome coverage and protein sequence coverage.11−13 Online fractionation methods reduce sample loss but are limited by compatibility requirements of the fractionation and separation methods.14 In contrast, offline fractionation methods are more flexible, albeit at the expense of potential sample loss. Various high-performance liquid chromatography (HPLC) modes have been used for peptide fractionation, such as RP,15 strong cation exchange (SCX),16 strong anion exchange,17 electrostatic repulsion−hydrophilic interaction chromatography,18 etc. Different HPLC modes with orthogonal separation mechanisms can be combined to further decrease the sample complexity and improve the depth of proteome analysis. However, HPLC columns have typically 2.1−4.6 mm inner diameter, which leads to serious carry-over and sample loss due to the large number of non-specific adsorption sites on the resin and the connecting tubing. Moreover, the flow rate used during separation is high, typically in the range of 0.1−5 mL/min, which results in a large volume for each fraction, which has to be collected, dried, redissolved, pooled using a concatenation scheme, and transferred into sample vials for LC−MS analysis. The large contact area between the sample and collecting tubes, lyophilization, redissolution, and multiple sample transfer steps can lead to serious sample loss. More recently, a nanoflow HPLC system with a 75−250 μm inner diameter (i.d.) column was introduced.11,19,20 Kulak et al. introduced a “spider fractionator” in which the post-column flow of a nanobore chromatography system (column of 250 μm i.d. with a length of 30 cm) enters an eight-port flow-selector rotor valve and samples are concatenated in a loss-less manner into 2−96 fractions in autosampler vials.11 Peptides were prepared from 6600 HeLa cells (~1 μg protein) by using the in-StageTip (iST) protocol. The combination of eight fractions with 100 min gradients yielded 5,869 protein groups and 37,000 peptides. The nanoflow HPLC-based method allows efficient sample concatenation without using large volumes, and an intermediate sample collection step is eliminated. However, the peptides prepared by the iST method had to be eluted, dried, and re-suspended before fractionating by the spider fractionator. The extra transfer step increased the potential sample loss and contamination. To achieve in-depth proteomics analysis of samples in the nanogram to low-microgram range, Dou et al. developed the nanoFAC (nanoflow fractionation and automated concatenation) 2D RPLC platform, in which the first dimension high-pH fractionation was performed on a 75 μm i.d. capillary column, and each fraction was then fully transferred to the second-dimension low-pH nanoLC separation.21 The nanoFAC 2D RPLC platform can achieve confident identifications of ~49,000−94,000 unique peptides, corresponding to ~6,700− 8,300 protein groups using 100−1,000 ng of HeLa tryptic digest prepared from a bulk sample by an in-solution digestion method. To improve the sensitivity, Dou et al. developed nanowell-mediated 2D RP nanoLC separations for in-depth proteome profiling of low-nanogram samples.22 The nanowell platform minimizes peptide losses on surfaces in offline 2D LC fractionation, enabling >5,800 proteins to be confidently identified from just 50 ng of HeLa digest. Furthermore, in combination with a high-sensitivity sample preparation method named nanodroplet processing in one pot for trace samples (nanoPOTS), deep proteome profiling of 5805 protein groups from ~650 HeLa cells were achieved. A nanoRPLC fractionation method was also coupled to CZE-MS/MS. A 250 μg MCF- 7 cell digest was prepared by in-solution digestion, and a 5 μg sample was loaded onto the nanoRPLC system and fractionated into 20 fractions using 180 min gradient. Each fraction was lyophilized and redissolved for CZE-MS/MS analysis. A total of 7,512 proteins and 59,403 peptides were identified using 34 h MS time.23 To improve the sensitivity of the system, the researchers coupled a single-pot solid-phase enhanced sample preparation (SP3) method to an improved nanoRPLC-CZE- MS/MS for bottom-up proteomics analysis of 5000 HEK293T cells, resulting in 3,689 proteins with the consumption of a peptide amount that corresponds to only roughly 1,000 cells,24 which was comparable to the identification number (~3,069 proteins) achieved by single-shot nanoRPLC analysis of protein digest prepared directly from 1000 MCF-7 cells by MICRO- FASP without fractionation.25 However, the nanoHPLC fractionation method requires an ultrahigh-pressure LC system, which is expensive and not accessible to every laboratory. Moreover, it is difficult to seamlessly integrate the sample preparation method with the nanoHPLC fractionation method.
Alternative solid-phase extraction (SPE) methods,26 such as ZipTip, or SpinTip, have advantages of low cost, rapid fractionation, and easy adjustment of the column capacity. Kulak and colleagues developed an iST method for sample processing from cell lysis through elution of purified peptides in one or more fractions.27 An iST method that generated six SCX fraction workflows was applied to 20 μg of HeLa cell lysates. Hughes et al. developed an SP3 method and coupled it with a high-pH RP StageTip-based peptide fractionation technique.28 HeLa cell lysates from 5000 cells (~1 μg) were prepared using the single-tube SP3 protocol. The peptides were fractionated with a high-pH RP StageTip. Injected peptides were trapped on Symmetry C18 columns (180 μm i.d. × 20 mm) and separated using a 145 min gradient on a C18 column (nanoAcquity BEH130 C18, 75 μm i.d. × 200 mm, 1.7 μm); 34,946 peptides were identified with matching between runs by MaxQuant. Chen and colleagues developed a simple, integrated SpinTip-based proteomics technology (SISPROT) consisting of SCX beads and a C18 disk in one pipet tip.29 Both proteomics sample preparation steps, including protein preconcentration, reduction, alkylation, digestion, and RP-based desalting, and high-pH RP-based peptide fractionation can be achieved in a fully integrated manner for the first time. For 2000 and 5000 cell samples, the peptides were directly eluted with 80% ACN in 5 mM ammonium formate without fractionation. Peptides prepared from 104 cells were fractionated into three fractions, and 26,060 peptides and 4,471 protein groups were identified in 4.2 h MS time.
We reported a miniaturized filter aided sample preparation (MICROFASP) method for low-loss preparation of sub-microgram proteomics samples.25 Our MICROFASP method employs a filter with ~0.1 mm2 surface area, reduces the total volume of reagents to <10 μL, requires only two sample transfer steps, and produces very high sensitivity. Moreover, the system can process 192 samples in parallel using two 96-plates MICROFASP method.30 In our first report, the sample prepared by the MICROFASP method was eluted into the autosampler vial for LC−MS/MS analysis without fractionation, which may hinder the identification of low-abundance proteins. Here, we report a platform that seamlessly integrates the MICROFASP method with high-pH RP or SCX fractionation techniques to generate in-depth proteome profiling from a limited amount of starting material with reduced fractionation time and instrument requirement. By dramatically reducing the size of the microreactor and sample transfer steps, sample loss and contamination were minimized during the sample preparation and fractionation process.
EXPERIMENTAL SECTION
Chemicals and Materials.
Bovine pancreas TPCK-treated trypsin, urea, ammonium bicarbonate (NH4HCO3), ammonium acetate, ammonium formate, dithiothreitol (DTT), iodoacetamide (IAA), and Biomax polyethersulfone (PES) membranes with 300 kDa MWCO(PES300), Empore Cation Exchange SPE Disks, and C18 SPE Disks were purchased from Millipore Sigma (Burlington, MA). Ammonia, formic acid (FA), and acetonitrile (ACN) were purchased from Fisher Scientific (Pittsburgh, PA). Methanol was purchased from Honeywell Burdick & Jackson (Wicklow, Ireland). MS compatible human protein extract (Intact K562 human cell lysate) was purchased from VWR (Radnor, PA). Water was deionized by a Nano Pure system from Thermo Scientific (Marietta, OH).
Sample Preparation with the Miniaturized FASP (MICROFASP)-Based Method.
The MICROFASP method was carried out following the protocol in our previous report.25 The details are presented in the Supporting Information.
Sample Fractionation by a High-pH RP Microreactor.
The fabrication of the RP microreactor was similar to the fabrication of the MICROFASP reactor, where the ultrafiltration membrane was replaced with two layers of C18 membranes. The RP microreactor was conditioned by treatment with 5 μL of 80% ACN followed by 5 μL of 20 mM NH4HCO3. After the trypsin digestion of K562 protein was completed, the MICROFASP reactor was plugged into a C18 microreactor (Figure 1). Digests were transferred onto the C18 membrane by centrifugation. The flow through was also collected. Five milliliters of each elution buffer was loaded onto the C18 microreactor, and each fraction was eluted into an individual sample vial. Different elution volumes (5 and 20 μL) and ACN gradients (Table 1) were tested. The fractions were lyophilized and redissolved in 5 μL of 0.1% FA before LC-ESI-MS/MS analysis.
Figure 1.
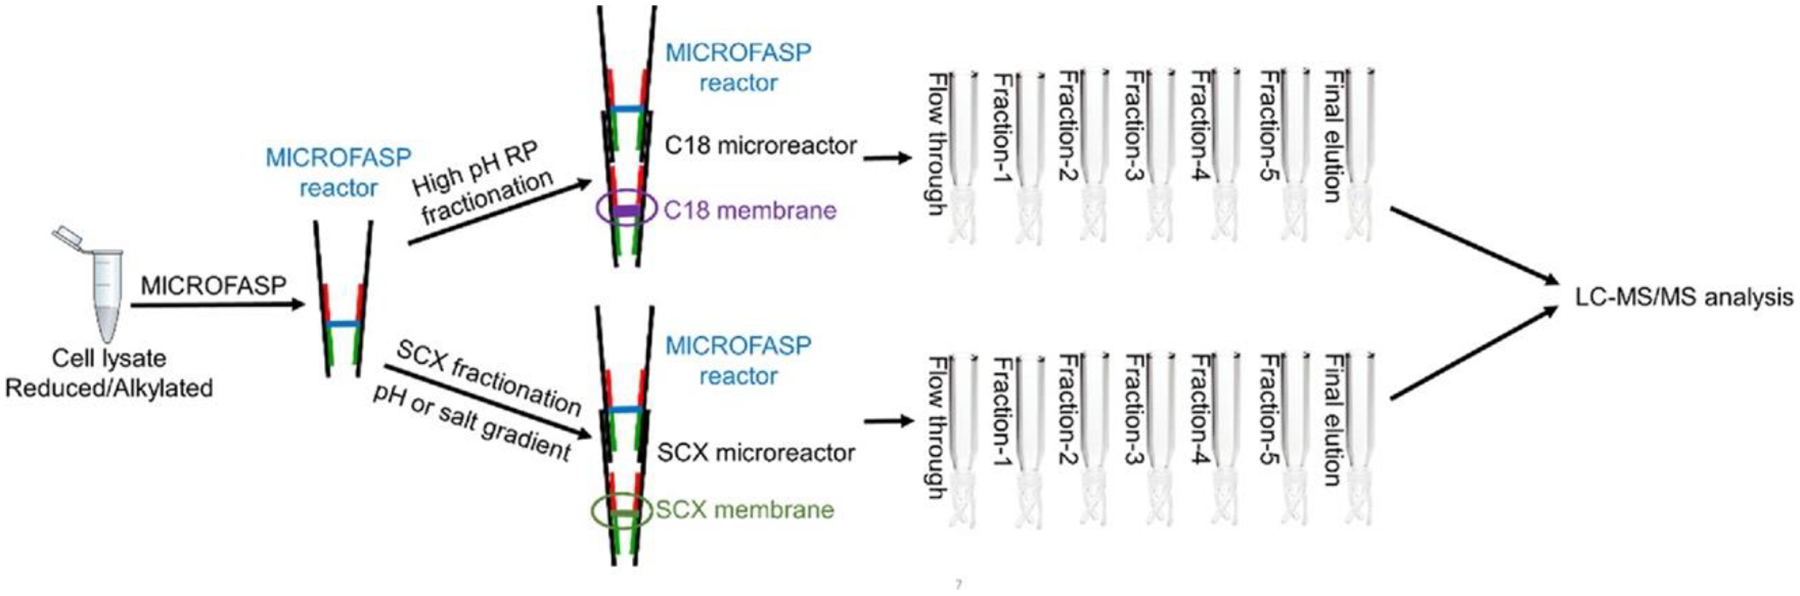
Workflow for seamlessly integrated MICROFASP method with the fractionation technique for in-depth proteomics analysis of a mass-limited sample.
Table 1.
ACN Percentages in Different Gradients for High-pH RP Fractionation
| Gradient-1a | Gradient-2a | Gradient-3a | |
|---|---|---|---|
| Fraction-1 | 3%ACN | 4%ACN | 9%ACN |
| Fraction-2 | 6%ACN | 7%ACN | 15%ACN |
| Fraction-3 | 9%ACN | 10%ACN | 20%ACN |
| Fraction-4 | 15%ACN | 15%ACN | 30%ACN |
| Fraction-5 | 80%ACN | 80%ACN | 80%ACN |
With 2 mM ammonia in water
Sample Fractionation by SCX Microreactors.
SCX microreactors were fabricated in a similar way to the MICROFASP reactor by replacing the ultrafiltration membrane with a SCX membrane. The SCX microreactor was conditioned by 5 μL of 10 mM ammonia with 20% ACN followed by 5 μL of 1 M acetic acid. After the trypsin digestion of K562 protein was completed, the MICROFASP reactor was plugged into the SCX microreactor (Figure 1), and digests were transferred onto the SCX membrane by centrifugation. The flow through was collected in a sample vial. Five milliliters of each elution buffer was loaded onto the SCX microreactor, and each fraction was directly eluted into an individual sample vial. Both salt gradient and pH gradient elution methods were used (Table 2). The salt gradient elution condition is similar to a report by Kulak et al.27 The pH gradient elution condition is similar to our previous work.31 The fractions were lyophilized and redissolved in 5 μL of 0.1% FA before LC-ESI-MS/MS analysis.
Table 2.
Elution Conditions for the SCX Microreactor-Based Fractionation Method
| salt gradienta | pH Gradientb | |
|---|---|---|
| Fraction-1 | 50 mM ammonium acetate | ammonium formate, pH 3 |
| Fraction-2 | 75 mM ammonium acetate | ammonium formate, pH 4 |
| Fraction-3 | 125 mM ammonium acetate | ammonium acetate, pH 5 |
| Fraction-4 | 200 mM ammonium acetate | ammonium acetate, pH 7 |
| Fraction-5 | 300 mM ammonium acetate | ammonium bicarbonate, pH 8 |
With 20% ACN and 0.5% FA.
200 mM buffer with 20% ACN.
UPLC-ESI-MS/MS Analysis.
An ACQUITY UPLC M-Class system (Waters, Milford, MA, USA) with an ACQUITY UPLC M-Class Peptide BEH C18 column (Waters, 75 μm × 150 mm, 1.7 μm, 300 Å) was coupled to a Q Exactive HF mass spectrometer (Thermo Fisher Scientific) for peptide separation and identification; details of the mass spectrometer’s operation are presented below. Mobile phase A (0.1%FA in water) and mobile phase B (0.1% FA in ACN) were used for gradient separation. Peptides were automatically loaded onto the C18 column and flushed with 2% mobile phase B for 12 min at a flow rate of 0.5 μL/min then followed by the 2 h gradient: 12−102 min, 2−30% B; 102−106 min, 30−88% B; 106−110 min, 88% B; 110−111 min, 88−2% B; 111−120 min, 2% B. The eluted peptides from the C18 column were pumped through a capillary tip for electrospray.
Mass Spectrometer Operating Parameters.
A Q Exactive HF mass spectrometer was used in this work. The mass spectrometer was programmed in data-dependent mode. The S-lens RF level was set at 50 and heated capillary at 300 °C. The full-scan resolution was set to 60,000 at m/z 200. The full-scan target was 3.00 × 10⁶. The mass range was set to m/z 350− 1650. The maximum injection time was 30 ms. The target value for fragment scans was set at 1.00 × 10⁵. The maximum injection time was 45 ms. A fixed first mass of 100 was used. The loop count was 15. The isolation window was 1.4 m/z. The normalized collision energy was set at 28.
Database Searching.
Database searching of the raw files was performed in MaxQuant (version 1.6.10.43).32,33 The UniProt Homo sapiens reference protein database was used for database searching. The corresponding reversed database was also used for database searching in order to evaluate the false discovery rates (FDRs). The database searching parameters included full tryptic digestion and allowed up to two missed cleavages. Carbamidomethylation (C) was set as fixed modifications; Oxidation (M) and Acetyl (Protein N-term) were set as variable modifications. The corresponding FDR on the peptide level was less than 1%. On the protein level, protein grouping was enabled. Label-free quantitation was selected for quantification analysis.
RESULTS AND DISCUSSION
Optimization of the High-pH RP Fractionation Method.
We first tested the capacity of the C18 membrane. After 1 μg of K562 cell lysate was processed by the MICROFASP method, the digest was transferred onto the C18 microreactor with a single layer C18 membrane or double layer C18 membrane. Peptides that were not retained on the C18 membrane during the loading process were collected as the flow through fraction. Peptides retained on the C18 membrane were fractionated under condition 1 (Table 1) plus a final elution using 80% ACN with 20 mM ammonia in water for seven fractions in total. The volume for each fraction was 10 μL. After lyophilization, each fraction was redissolved in 5 μL of 0.1% FA; 4 μL was injected for UPLC-ESI-MS/MS analysis. A total of 22,085 peptides were identified in the flow through fraction, and 28,376 peptides were identified in total when using the single C18 membrane microreactor. This result indicated that the column capacity of the single layer C18 membrane is not sufficient for retaining the 1 μg sample. In contrast, only 1062 peptides were identified in the flow through fraction and 44,648 peptides were identified in total for the double C18 membrane microreactor. We also analyzed the GRAVY value distributions of the peptides identified in the flow through from the double membrane C18 microreactor (Figure S1 in the Supporting Information), indicating that most were polar peptides with weak interaction with the C18 membrane. Therefore, the peptides identified in the flow through fraction from the double membrane C18 microreactor had weak retention on the C18 membrane, rather than being the result of the low capacity of the microreactor. Therefore, the double membrane C18 microreactor was used in the following work.
Two elution volumes (5 and 20 μL) under Gradient-1 (Table 1) were used for the fractionation of 1 μg of K562 cell digest prepared by the MICROFASP method. A total of 44,008 (N = 2, RSD = 0.1%) peptides and 4276 (N = 2, RSD = 0.9%) protein groups were identified with 5 μL of elution buffer; 43,139 (N = 2, RSD = 0.3%) peptides and 4441 (N = 2, RSD = 1.1%) protein groups were identified with 20 μL of elution buffer. The results indicated that 5 μL of elution buffer is sufficient for high fractionation efficacy. Therefore, 5 μL of elution buffer was used in our following work.
Next, we optimized the ACN gradients (Table 1) to maximize the number of identifications (Figure 2A). Gradient-2 identified 5066 (N = 2, RSD = 0.2%) proteins and 55,698 (N = 2, RSD = 1.8%) peptides, which are more than the other two gradients. Therefore, Gradient-2 is used in the following work. The distributions of the numbers of peptides identified from each fraction under different gradients are also shown in Figure 2B. Under Gradient-2, the number of peptides was distributed more evenly across Fraction-1 to Fraction-4. We noticed that there were a very small number of peptides identified from the flow through fraction, Fraction-5, and the final elution fraction. To save LC−MS analysis time, we combined the flow through fraction with Fraction-1 as one fraction and Fraction-5 and the final elution fraction with Fraction-4 as one fraction (Figure 2C). A total of 48,890 (N = 2, RSD = 2.6%) peptides and 4723 (N = 2, RSD = 2.3%) proteins were identified from the final four fractions within the total LC−MS analysis time of 8 h.
Figure 2.

(A) Effect of ACN gradients on the number of identifications. (B) Number of peptides identified in each fraction under different gradients. (C) Number of peptides identified in four combined fractions under Gradient-2.
Optimization of the SCX Fractionation Method.
We first tested the capacity of the SCX membrane. After 1 μg of K562 cell lysate was processed by the MICROFASP method, the digest was transferred onto the SCX microreactor with a single layer SCX membrane. Peptides that were not retained on the SCX membrane during the loading process were collected and analyzed by LC-ESI-MS/MS. An average of fewer than 3 peptides (N = 6) were identified from the flow through. Therefore, a single layer SCX membrane is sufficient for retention of 1 μg of K562 protein digest.
Both salt gradient and pH gradient elution methods were used for sample fractionation (Table 2 and Figure 3). To ensure that all the peptides elute from the SCX reactor, we repeated the fifth elution step as the final elution step. Though the identification numbers from both methods are similar, the distribution of the peptides identified in each fraction is quite different (Figure 3B). The peptides are distributed more evenly using the pH gradient than salt gradient elution method. Most of the peptides were efficiently eluted off the SCX microreactor in the first five eluting steps, and only 1073 (N = 2, RSD = 19%) peptides were identified in the final elution step when using the pH gradient elution method. However, small numbers of peptides were identified in the first two elution steps and 16,373 (N = 2, RSD = 1.0%) peptides were identified in the final elution step using the salt gradient elution method. The results suggest that the efficacy of the salt gradient elution method could be improved by optimizing the salt gradients.
Figure 3.

(A) Numbers of peptides and proteins identified by salt gradient and pH gradient. (B) Numbers of peptides identified in each fraction by salt gradient and pH gradient.
We analyzed the overlaps between the adjacent elution steps during pH gradient elution (Figure S2 in the Supporting Information). The overlaps ranged from 21 to 24%, indicating the high efficacy of the pH gradient elution method. We also analyzed the pI distribution of the identified peptides (Figure S3 in the Supporting Information). The peptides with smaller pI values were eluted from the SCX microreactor earlier due to their weak retentions on the SCX membrane.
Reproducibility and Label-Free Quantification (LFQ) Performance of the Integrated Platform. To evaluate the reproducibility of the integrated platform, we prepared two samples by the MICROFASP method with 1 μg of K562 cell lysates as the starting material and fractionated the peptides into five fractions by the C18 microreactor-based high-pH RP method under Gradient-2 (Table 1). A total of 51,384 peptides (N = 2, RSD = 1.6%) and 4,736 proteins (N = 2, RSD = 3.0%) were identified using the C18 microreactor. We also compared the LFQ results of the protein expressions identified in these duplicate experiments (Figure 4A). The Pearson’s correlation coefficient between the replicates is very high (Pearson’s r = 0.996), indicating the good LFQ reproducibility and accuracy of the developed platform. We also compared the LFQ results of the protein expressions identified by different fractionation methods (Figure 4B). The Pearson’s correlation is also very high (>0.98), indicating good stabilities and reproducibilities of both MICROFASP-C18 and MICROFASP-SCX integrated platforms.
Figure 4.

(A) Label-free quantitation result of the protein expressions identified in duplicate high-pH RP fractionation experiments under Gradient-2. (B) Label-free quantitation result of the protein expressions identified in three fractionation techniques.
Comparison between High-pH RP and SCX Fractionation Methods.
Both high-pH RP- and SCX-based methods have good orthogonal properties with the low-pH RP separation method. In this work, more peptides and protein groups were identified using the C18 microreactor-based high-pH RP fractionation method than using the SCX-based method. However, the SCX microreactor has a higher loading capacity than the C18 microreactor with the same size of resin membrane. The primary data suggested that the pH gradient elution method works better than the salt gradient elution method since the peptides are distributed more evenly using the pH gradient than salt gradient elution method, but the salt gradient elution conditions were not optimized in detail in this work; therefore, such comparison may be not reasonable. However, the data provided in this work confirmed that both high-pH RP- and SCX-based methods could meet the need for deep proteome profiling of 1 μg of cell lysate.
Comparison with Reported Results.
Compared to the data from 1 μg of K562 cell lysates processed using the MICROFASP method without fractionation,25 the numbers of identified peptides and protein groups were increased by 68.6 and 35.8%, respectively, using the C18 microreactor-based high-pH RP fractionation method. However, these achievements are made at the expense of sacrifice of the throughput because multiple fractions had to be analyzed instead of single-shot analysis without fractionation. Kulak et al. prepared peptides directly from 6,600 HeLa cells by using the iST protocol and then fractionated peptides using the “spider fractionator”.11 The combination of eight fractions with 100 min gradients (800 min in total) yielded 5,869 protein groups and 37,000 peptides. In comparison, we identified 51,384 peptides (N = 2, RSD = 1.6%) and 4,736 proteins (N = 2, RSD = 3.0%) from 1 μg of K562 cell lysate prepared by the MICROFASP method with five high-pHRP fractions from a C18 microreactor and 120 min gradients (600 min in total). We also identified 48,890 (N = 2, RSD = 2.6%) peptides and 4,723 (N = 2, RSD = 2.3%) proteins from four combined fractions within 480 min of LC−MS analysis time. One of the possible reasons is the sample loss with the iST protocol due to non-specific interaction between the proteins or peptides and the resins, desalting step, lyophilization, redissolution, and multiple sample transfer steps. Another possible reason is that the high capacity of the column (~100 μg) used for fractionation is not optimal for a 1 μg starting material due to the non-specific interactions between the peptides and the C18 resins. Therefore, the benefits from the high-resolution nanoflow HPLC were overwhelmed by the sample loss that caused the decrease in the number of identifications. However, the number of identifications was greatly improved when combining the nanoPOTS and nanoRPLC fractionation platform.22 The researchers also used a spin column system for fractionation of 1 μg of HeLa peptides prepared from a bulk sample by the in-solution digestion method into eight fractions using the high-pH RP method. However, less than 20,000 peptides and 4,000 proteins were identified.11 In contrast, over 2.5 times more peptides were identified from 1 μg of protein digest with only four fractions using MICROFASP coupled to the high-pH RP fractionation method, indicating the minimal sample loss and high efficacy of the integrated platform. HeLa cell lysates from 5000 cells (~1 μg) were prepared using the single-tube SP3 protocol followed by fractionation with a high-pH RP StageTip.28 Combining the four fractions and 145 min gradient separation, 34,946 peptides were identified with matching between runs enabled by MaxQuant. In comparision, 40% more peptides were identified in this work with 17% less time and a higher confidence and without using matching between runs.
CONCLUSIONS
The seamlessly integrated platform combining the MICROFASP method and fractionation techniques allowed deep proteomics analysis of the mass-limited sample. By dramatically reducing the size of the microreactor for sample preparation and fractionation, the potential sample loss and contamination was minimized. The buffer volume for each fractionation is only 5 μL, which makes it possible for fast fractionation (<2 min for each fraction) and quick lyophilization (<3 min). Each fraction was directly eluted into an autosampler insert vial to avoid an extra sample transfer step, further reducing sample loss during sample processing. One milligram of K562 cell lysate was prepared by MICROFASP then followed by various fractionation techniques. A total of 51,384 peptides (N = 2, RSD = 1.6%) and 4,736 proteins (N = 2, RSD = 3.0%) were identified by simply five high-pH RP fractions from the C18 microreactor and 120 min gradients (600 min MS time in total). Moreover, 48,890 (N = 2, RSD = 2.6%) peptides and 4,723 (N = 2, RSD = 2.3%) proteins were identified from only four combined fractions within 480 min MS time. The identification results are comparable with state-of-the-art results using the nanoflow RPLC-based fractionation method but with a significant reduction in cost and time. Both high-pH RP- and SCX-based methods have good reproducibility and could meet the need for deep proteome profiling of 1 μg of cell lysate. Therefore, the developed integrated platform may be useful for comprehensive proteomics analysis of sub-microgram amounts of starting material with reduced time and equipment requirements.
Supplementary Material
ACKNOWLEDGMENTS
We thank Dr. William Boggess in the Notre Dame Mass Spectrometry and Proteomics Facility for his help with this project. This work was funded by the National Institutes of Health (NJD-R35 GM136334), Scientific Research Grant of Ningbo University (215-432000282), and the K.C. Wong Magna Fund in Ningbo University.
Footnotes
Complete contact information is available at: https://pubs.acs.org/10.1021/acs.analchem.2c01396
The authors declare no competing financial interest.
* Supporting Information
The Supporting Information is available free of charge at https://pubs.acs.org/doi/10.1021/acs.analchem.2c01396.
Sample preparation with the miniaturized FASP (MICROFASP)-based method, GRAVY value distributions of the peptides identified in the flow through fraction from the microreactor with a double layer C18 membrane, overlaps between the adjacent elution steps by the SCX fractionation method using pH gradient elution, and pI value distribution of peptides identified in each fraction using the pH gradient elution method (PDF)
Excel spreadsheets with protein and peptide identifications for the high-pH RP fractionation method (XLSX) Excel spreadsheets with protein and peptide identifications for the SCX-based fractionation method (XLSX)
Contributor Information
Zhenbin Zhang, Institute of Drug Discovery Technology, Ningbo University, Zhejiang 315211, China.
Norman J. Dovichi, Department of Chemistry and Biochemistry, University of Notre Dame, Notre Dame, Indiana 46556, United States
REFERENCES
- (1).Tyers M; Mann M Nature 2003, 422, 193–197. [DOI] [PubMed] [Google Scholar]
- (2).Cravatt BF; Simon GM; Yates JR Nature 2007, 450, 991. [DOI] [PubMed] [Google Scholar]
- (3).Aebersold R; Mann M Nature 2003, 422, 198–207. [DOI] [PubMed] [Google Scholar]
- (4).Noya SB; Colameo D; Brüning F; Spinnler A; Mircsof D; Opitz L; Mann M; Tyagarajan SK; Robles MS; Brown SA Science 2019, 366, No. eaav2642. [DOI] [PubMed] [Google Scholar]
- (5).Shishkova E; Hebert AS; Coon JJ Cell Syst. 2016, 3, 321– 324. [DOI] [PMC free article] [PubMed] [Google Scholar]
- (6).Zhang Z; Qu Y; Dovichi NJ TrAC, Trends Anal. Chem 2018, 108, 23–37. [Google Scholar]
- (7).Zhang Z; Hebert AS; Westphall MS; Qu Y; Coon JJ; Dovichi NJ Anal. Chem 2018, 90, 12090–12093. [DOI] [PMC free article] [PubMed] [Google Scholar]
- (8).Shevchenko A; Wilm M; Vorm O; Mann M Anal. Chem 1996, 68, 850–858. [DOI] [PubMed] [Google Scholar]
- (9).Chen EI; Cociorva D; Norris JL; Yates JR J. Proteome Res 2007, 6, 2529–2538. [DOI] [PMC free article] [PubMed] [Google Scholar]
- (10).Wisniewski JR; Zougman A; Nagaraj N; Mann M Nat. Methods 2009, 6, 359–362. [DOI] [PubMed] [Google Scholar]
- (11).Kulak NA; Geyer PE; Mann M Mol. Cell. Proteomics 2017, 16, 694–705. [DOI] [PMC free article] [PubMed] [Google Scholar]
- (12).Ye X; Tang J; Mao Y; Lu X; Yang Y; Chen W; Zhang X; Xu R; Tian R TrAC, Trends Anal. Chem 2019, 120, No. 115667. [Google Scholar]
- (13).Manadas B; Mendes VM; English J; Dunn MJ Expert Rev. Proteomics 2010, 7, 655–663. [DOI] [PubMed] [Google Scholar]
- (14).Zhou F; Sikorski TW; Ficarro SB; Webber JT; Marto JA Anal. Chem 2011, 83, 6996–7005. [DOI] [PMC free article] [PubMed] [Google Scholar]
- (15).Song C; Ye M; Han G; Jiang X; Wang F; Yu Z; Chen R; Zou H Anal. Chem 2010, 82, 53–56. [DOI] [PubMed] [Google Scholar]
- (16).Mohammed S; Heck AJ R. Curr. Opin. Biotechnol 2011, 22, 9–16. [DOI] [PubMed] [Google Scholar]
- (17).Alpert AJ; Hudecz O; Mechtler K Anal. Chem 2015, 87, 4704–4711. [DOI] [PMC free article] [PubMed] [Google Scholar]
- (18).Zarei M; Sprenger A; Rackiewicz M; Dengjel J Nat. Protoc 2016, 11, 37–45. [DOI] [PubMed] [Google Scholar]
- (19).Reubsaet L; Sweredoski MJ; Moradian A; Lomenick B; Eggleston-Rangel R; Garbis SDJ Chromatogr. A 2020, 2020, No. 460507. [DOI] [PubMed] [Google Scholar]
- (20).Qu Y; Sun L; Zhang Z; Dovichi NJ Anal. Chem 2018, 90, 1223–1233. [DOI] [PMC free article] [PubMed] [Google Scholar]
- (21).Dou M; Tsai CF; Piehowski PD; Wang Y; Fillmore TL; Zhao R; Moore RJ; Zhang P; Qian WJ; Smith RD; Liu T; Kelly RT; Shi T; Zhu Y Anal. Chem 2019, 91, 9707–9715. [DOI] [PMC free article] [PubMed] [Google Scholar]
- (22).Dou M; Zhu Y; Liyu A; Liang Y; Chen J; Piehowski PD; Xu K; Zhao R; Moore RJ; Atkinson MA; Mathews CE; Qian W-J; Kelly RT Chem. Sci 2018, 9, 6944–6951. [DOI] [PMC free article] [PubMed] [Google Scholar]
- (23).Yang Z; Shen X; Chen D; Sun L Anal. Chem 2018, 90, 10479–10486. [DOI] [PMC free article] [PubMed] [Google Scholar]
- (24).Yang Z; Shen X; Chen D; Sun LJ Proteome Res. 2019, 18, 4046–4054. [DOI] [PMC free article] [PubMed] [Google Scholar]
- (25).Zhang Z; Dubiak KM; Huber PW; Dovichi NJ Anal. Chem 2020, 92, 5554–5560. [DOI] [PMC free article] [PubMed] [Google Scholar]
- (26).Rappsilber J; Mann M; Ishihama Y Nat. Protoc 2007, 2, 1896. [DOI] [PubMed] [Google Scholar]
- (27).Kulak NA; Pichler G; Paron I; Nagaraj N; Mann M Nat. Methods 2014, 11, 319–324. [DOI] [PubMed] [Google Scholar]
- (28).Hughes CS; Foehr S; Garfield DA; Furlong EE; Steinmetz LM; Krijgsveld J Mol. Syst. Biol 2014, 10, 757. [DOI] [PMC free article] [PubMed] [Google Scholar]
- (29).Chen W; Wang S; Adhikari S; Deng Z; Wang L; Chen L; Ke M; Yang P; Tian R Anal. Chem 2016, 88, 4864–4871. [DOI] [PubMed] [Google Scholar]
- (30).Zhang Z; Dubiak KM; Shishkova E; Huber PW; Coon JJ; Dovichi NJ Anal. Chem 2022, 94, 3254–3259. [DOI] [PMC free article] [PubMed] [Google Scholar]
- (31).Zhang Z; Yan X; Sun L; Zhu G; Dovichi NJ Anal. Chem 2015, 87, 4572–4577. [DOI] [PMC free article] [PubMed] [Google Scholar]
- (32).Cox J; Mann M Nat. Biotechnol 2008, 26, 1367–1372. [DOI] [PubMed] [Google Scholar]
- (33).Tyanova S; Temu T; Cox J Nat. Protoc 2016, 11, 2301–2319. [DOI] [PubMed] [Google Scholar]
Associated Data
This section collects any data citations, data availability statements, or supplementary materials included in this article.