Abstract
CPT1A is a rate-limiting enzyme in fatty acid oxidation and is upregulated in high-risk breast cancer. Obesity and menopausal status’ relationship with breast cancer prognosis is well established, but its connection with fatty acid metabolism is not. We utilized RNA sequencing data in the Xena Functional Genomics Explorer, to explore CPT1A’s effect on breast cancer patients’ survival probability. Using [18F]-fluorothymidine positron emission tomography-computed tomography images from The Cancer Imaging Archive, we segmented these analyses by obesity and menopausal status. In 1214 patients, higher CPT1A expression is associated with lower breast cancer survivability. We confirmed a previously observed protective relationship between obesity and breast cancer in pre-menopausal patients and supported this data using two-sided Pearson correlations. Taken together, these analyses using open-access databases bolster the potential role of CPT1A-dependent fatty acid metabolism as a pathogenic factor in breast cancer.
Introduction
Breast cancer is the leading cause of cancer mortality in women [1]. Over two million new cases of breast cancer are diagnosed each year, accounting for 24% of total new cancer cases and 15% of total cancer deaths in women. There are many pathogenic and permissive mechanisms underlying tumorogenesis, and metabolic reprogramming is among these emerging mechanisms. Metabolic reprogramming explores how metabolic shifts activate pathways generating and utilizing substrates such as fatty acids and glucose [2]. These pathways provide the energy required for cancer cells to proliferate, migrate, and invade. Although, since the pioneering work of Otto Warburg, the cancer metabolism field has primarily focused on glucose as the most important substrate for rapidly proliferating tumor cells, the role of fatty acids in breast cancer metabolism is far less well understood. It is of particular importance to define how fatty acid metabolism affects tumor metabolism and, ultimately, growth in tumors such as breast cancer that exist in an adipocyte-enriched milieu, because the surrounding lipids are expected to heavily influence the composition of the tumor microenvironment.
Fatty acids are a nutrient-dense source of energy for cancer cells, and under certain conditions may be required for tumor cell survival [3]. Relatedly, lipids are a critical component of cell membranes, so it is not surprising that fatty acid oxidation is an increasingly well-established factor promoting cancer metastasis [4]. Carnitine palmitoyl transferase 1A (CPT1A) resides in the outer mitochondrial membrane [5] and is the first rate-limiting enzyme in fatty acid oxidation, via its role in mediating fatty acid entry into the mitochondria [2]. Increased CPT1 expression and/or activity would therefore be expected to contribute to increased cancer proliferation and, in turn, mortality, but, to our knowledge, this hypothesis remains surprisingly unproven. Increasing availability of multi-Omics data highlights the opportunity for prognostic analyses such as these [6, 7].
Proliferation rate is a prognostic marker for breast cancer patients, and it can be measured by positron emission tomography-computed tomography (PET-CT) with [18F]-fluorothymidine (18F-FLT) in humans [8]. 18F-FLT is a substance uptaken by cells in the S-phase of the cell cycle. Increased proliferative activity is seen as increased 18F-FLT uptake in breast cancer since high 18F-FLT uptake is observed in tissues presenting high mitotic activity. Therefore, increased tumor 18F-FLT uptake is generally viewed as a poor prognostic marker. We demonstrated in an analysis of PET-CT images from The National Cancer Imaging Archive (TCIA) that body mass index (BMI) is paradoxically negatively correlated with 18F-FLT uptake in premenopausal breast cancer patients but positively correlated with 18F-FLT uptake in postmenopausal breast cancer patients, as confirmed in the literature [9]. BMI is a powerful metric for cancer research, and we considered data from patients across a comprehensive range of body size classes based on BMI: 1—cachexia (BMI below 18.5; although no patients in the current study qualified for this category), 2—healthy weight (BMI of 18.5 to 24.9), 3—overweight (BMI of 25.0 to 29.9), and 4—obese (BMI of or above 30.0) [10].
Given the relatively small sample size of 18F-FLT scans available in the TCIA dataset (33 total), RNA Sequencing Visualization was used to confirm the image analysis results [11]. We employed the Xena Functional Genomics Explorer to understand how CPT1A expression may predict breast cancer prognosis, through the lens of clinical and anthropometric data. This is a unique aspect of the current study, as the literature has not yet explored how fatty acid metabolism predicts outcomes in breast cancer in the context of obesity and menopausal status.
This study employed a multimodal approach to understand how fatty acid metabolism and obesity status affect tumor thymidine uptake and proliferation. We confirmed prior evidence of the paradoxical relationship between obesity and breast cancer and the detrimental nature of CPT1A expression on prognoses [1, 12]. In addition, we stratified patients with high and low expression of CPT1A and analyzed how menopausal status affected the survival rate of each, imparting a new perspective on an explored topic. These results add to our understanding of how body composition and fatty acids can alter the metabolism of breast cancer, highlighting a compelling need for future mechanistic studies.
Materials and methods
RNA sequencing visualization
RNA sequencing data from the TCGA Breast Cancer (BRCA) data set was uploaded into the UCSC Xena Functional Genomics Browser’s Visualization suite. The dataset used can be found here: https://xenabrowser.net/datapages/?dataset=TCGA.BRCA.sampleMap%2FBRCA_clinicalMatrix&host=https%3A%2F%2Ftcga.xenahubs.net&removeHub=https%3A%2F%2Fxena.treehouse.gi.ucsc.edu%3A443. All 1,247 samples were included in column A. CPT1A was added into column B as a genomic data type, and gene expression and somatic mutation datasets were selected to be analyzed. A Kaplan Meier plot was generated from column B, with overall survival chosen as the dependent variable. 1214 of the 1247 total samples contained data on the gene expression level of CPT1A, and these samples were used to generate the KM plot. Two groups of gene expression levels were set, with 602 samples considered to have a low expression level of CPT1A (<10.83 FPKM) and 612 samples considered to have a high expression level of CPT1A (> = 10.83 FPKM). 10.83 FPKM was the cutoff level for CPT1A gene expression, as the samples were divided at the median. Lastly, the custom survival time cutoff was set to 8605 days after the first treatment. A KM plot was then generated from column C, with overall survival again chosen as the dependent variable. 790 out of the 1247 total samples contained data on mutations in the CPT1A gene, and these samples were used to generate the KM plot. The custom survival time cutoff was set to 8605 days after the first treatment.
Menopausal status was added as a phenotypic data type in the same Visualization suite. Two Kaplan Meier plots were generated from the CPT1A gene expression and menopausal status data: one depicting the correlation between menopausal status and survival probability in samples with high expression levels of CPT1A (> = 10.83 FPKM) and the correlation between menopausal status and survival probability in samples with low expression levels of CPT1A (<10.83 FPKM). A new subgroup column was created: gene expression levels greater than or equal to 10.83 FPKM from column B were picked as the samples of interest and were filtered to keep those samples. A KM plot was generated for column C, with overall survival chosen as the dependent variable. 612 of the 1247 samples matched the criteria of high expression level of CPT1A (> = 10.83 FPKM), and 545 of the 612 samples contained data on menopausal status. 514 of the 545 samples had clear distinctions between pre-menopausal and post-menopausal, and were used to generate the KM plot. 123 samples had pre-menopausal status, and 391 samples had post-menopausal status. The survival time cutoff was set to 3461 days after the first treatment. The current sample filter was cleared, and a new subgroup column was created: gene expression levels less than 10.83 FPKM from column B were picked as the samples of interest and filtered to keep those samples. A KM plot was generated for column C, with progression during disease-free interval chosen as the dependent variable. 606 of the 1247 samples matched the criteria of low expression level of CPT1A (<10.83 FPKM), and 552 of the 606 samples contained data on menopausal status. 506 of the 552 samples had clear distinctions between pre-menopausal and post-menopausal, and were used to generate the KM plot. 136 samples had pre-menopausal status, and 370 samples had post-menopausal status. The survival time cutoff was set to 3663 days after the first treatment.
Using the Model organism Aggregated Resources for Rare Variant ExpLoration (MARRVEL) database, CPT1A data in humans was entered and transferred into the Genotype-Tissue Expression (GTEx) Portal [13–15]. The dataset used can be found here: https://gtexportal.org/home/gene/CPT1A. From these data, CPT1A expression level in different tissue types was examined.
PET-CT image analysis
The scans used for the image analysis were provided by TCIA. The dataset can be found here: https://wiki.cancerimagingarchive.net/pages/viewpage.action?pageId=30671268. All patients with an 18F-FLT PET-CT scan, height, weight, and menopausal status were studied, and 18 pre-menopausal patients and 15 post-menopausal patients fulfilled these criteria. If multiple scans were available, the earliest one was used to minimize the effect of neoadjuvant chemotherapy on the tumor.
PET and CT images were uploaded into Fiji ImageJ with a PET-CT Viewer. Using the brown fat ROI tool, the region of interest was drawn and projected through a range of slices. Fixed-volume spheres were drawn to measure mean thymidine uptake in tumor tissue, where only SUV parameters (2–15) and the “any” voxel criteria were selected. Lean body mass-corrected standardized uptake values (SUV) were calculated. The primary endpoint was SUV (g/mL) of tumors correlated to obesity status. Among 33 patients, BMI ranged from 19.0 to 33.3 kg/m2 (mean [SD] = 27.2 [4.00]).
Data were analyzed using GraphPad Prism, and a two-sided Pearson correlation was performed. It was found that none of the analyses were normally distributed. Under this condition, a Mann-Whitney Test was performed on each analysis to determine significance. Statistical significance was defined as P values less than .05. Marginally significant values were determined as P values greater than .05 but less than .10, as none of the analyses produced significant results.
Results
Survival probability By CPT1A expression level and presence of mutations
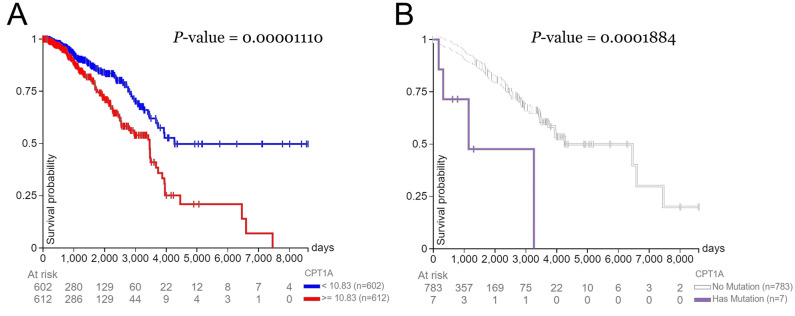
Patients with a high expression level of CPT1A had a lower survival rate (median survival time of 3,500 days) than those with low expression levels of CPT1A (median survival time of 4,200 days) (Fig 1A). Survival probability reached 0% for the high expression group at 7,500 days. In addition, patients with CPT1A mutation(s) had a lower survival rate (median survival time of 1,100 days) than those without mutation(s) in CPT1A (median survival time of 4,300 days) (Fig 1B). At 3,200 days, the survival probability reached 0% for the group with a CPT1A mutation.
Fig 1. Days after initial treatment vs. survival probability.
Correlations between days after initial treatment and survival probability in breast cancer patients (A) with high (> = 10.83 RKMP) vs. low (<10.83 RKMP) expression levels of CPT1A and (B) with or without mutations in CPT1A.
Correlations between obesity status and tumor SUV mean by menopausal status
Tumor SUVmean is insignificantly (approaching statistical significance) negatively correlated with obesity status in pre-menopausal breast cancer patients (Fig 2A). In post-menopausal breast cancer patients, tumor SUVmean is insignificantly positively correlated with obesity status (Fig 2B).
Fig 2. Obesity status vs. lean body mass-corrected thymidine uptake.
Correlations between obesity status and lean body mass-corrected thymidine uptake value (SUVmean) in breast cancer patients separated by (A) pre-menopausal status and (B) post-menopausal status. A two-sided Pearson correlation and Mann-Whitney test was performed, and the corresponding r value determined statistical significance. SUV—standardized uptake value.
SUVmean for tumor, adipose tissue, and organs by menopausal status
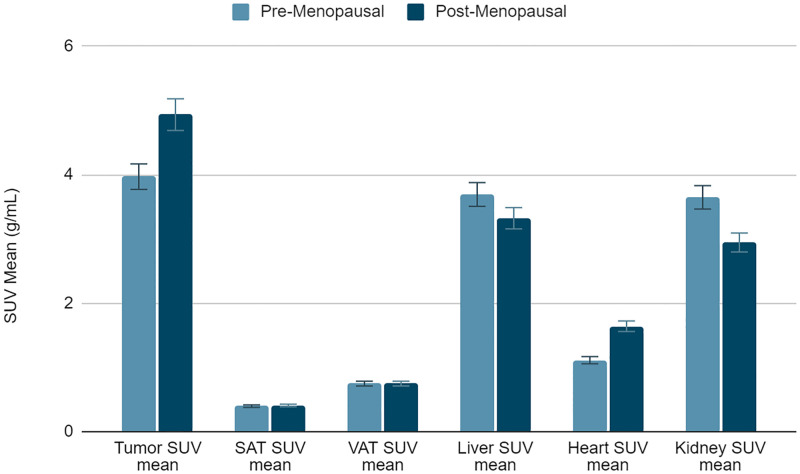
Tumor SUVmean in post-menopausal patients is significantly higher than tumor SUVmean in pre-menopausal patients (Fig 3). This same relationship is shown in heart SUVmean, and the opposite relationship is shown in kidney SUVmean.
Fig 3. Lean body mass-corrected mean standardized uptake value (SUVmean) in tumor; subcutaneous adipose tissue (SAT); visceral adipose tissue (VAT) at the level of the S2 vertebrae; liver; heart; and kidney separated by menopausal status (n = 33).
Survival probability for patients with high CPT1A expression by menopausal status
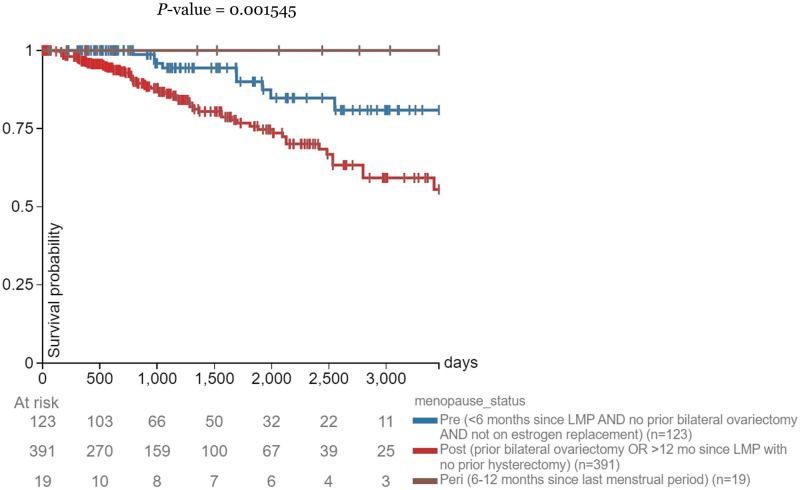
Pre-menopausal breast cancer patients with a high expression level of CPT1A had a higher survival rate than their post-menopausal counterparts (Fig 4). Peri-menopausal patients had a 100% survival probability throughout the study.
Fig 4. Days after initial treatment vs. survival probability.
Correlations between days after initial treatment and survival probability in breast cancer patients with a high expression level of CPT1A (> = 10.83 RKMP) separated by menopausal status.
Survival probability for patients with low CPT1A expression by menopausal status
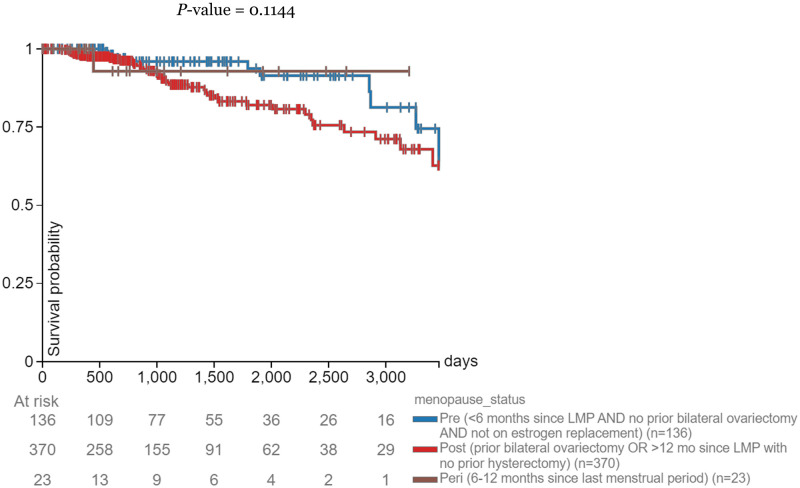
Pre-menopausal breast cancer patients with a high expression level of CPT1A had a higher survival rate than their post-menopausal counterparts until the two groups’ intersection at 3663 days (Fig 5). Peri-menopausal patients had the highest survival probability at 3663 days.
Fig 5. Days after initial treatment vs. survival probability.
Correlations between days after initial treatment and survival probability in breast cancer patients with a low expression level of CPT1A (<10.83 RKMP) separated by menopausal status.
Human expression of CPT1A by tissue type
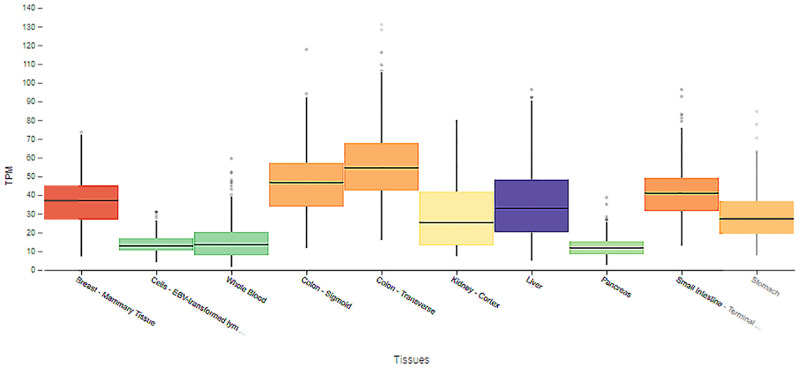
Breast tissue had the fourth-highest median expression of CPT1A, preceded by organs of the gastrointestinal tract, including the colon, small intestine, and stomach, which are all adipose tissue-enriched microenvironments (Fig 6). Breast tissue was followed by kidney and liver tissue. Brain, blood, and pancreas tissue showed insignificant differences in CPT1A expression.
Fig 6. Transcripts per million (TPM) of CPT1A separated by tissue types in which CPT1A is present.
Discussion
CPT1A is upregulated in breast cancer, worsening prognoses for high-risk patients. Although the role of obesity and menopausal status on breast cancer outcome has been studied before, we aimed to examine the lesser-known relationship between fatty acid metabolism and breast cancer outcome in the context of obesity and menopausal status. This study analyzes breast cancer patients in general, regardless of subtype, as there was limited data on subtype in both the image analysis and RNA sequencing visualization databases. CPT1A is upregulated in breast cancer, and inhibiting CPT1A activates cell apoptosis and suppresses cancer cell invasion [1]. Further, CPT1A is overexpressed in breast cancer tissues compared to normal breast tissues. This relationship is most strongly demonstrated in triple-negative breast cancer. We also observe an association between CPT1A expression and lymph node status, tumor size, tumor burden, histological grading, human epidermal growth factor receptor 2 (HER2) status, and molecular subtype. Fig 1A confirms these results and implies that 10.83 FPKM is the determining CPT1A expression level that produces significant differences in survival rate. Although previous studies have concluded that overexpression of CPT1A leads to poor breast cancer prognosis, to our knowledge no study has defined the deciding expression level: the expression level in which levels above or below it are predicted to result in significant differences in survival.
Fig 1B is consistent with the idea that CPT1A drives breast cancer metabolism [1]. A prominent clinical feature of CPT1A mutations in humans is elevated free carnitine levels [16], increasing the rate of fatty acid metabolism and energy for cancer cells to use and increasing proliferation and mortality. The connection between CPT1A mutations and breast cancer outcome is a gap in the literature, and this study explores the trend and the possible mechanisms behind it.
The image analysis portion of this study, represented in Fig 2A, strongly tended to confirm the paradoxical relationship between obesity and breast cancer in pre-menopausal women [12]. Increased serum estrogen levels are associated with poor breast cancer prognosis. In pre-menopausal women, estrogen is produced in the ovaries, and the low estradiol levels in patients are caused by negative feedback in the hypothalamic-pituitary axis suppressing ovarian function. On the other hand, our data from Fig 2B do not show a significant relationship between obesity and breast cancer in post-menopausal women. Estrogen synthesis in post-menopausal women occurs in adipose tissue, elevating estradiol levels in obese women compared to non-obese women. Although this relationship has been studied before, instead of using BMI as a continuous variable, this study uses obesity status, defined by BMI, as a categorical variable. BMI can reveal how height and weight affect breast cancer, but obesity status more explicitly represents how obesity affects outcome [17]. The analysis producing Fig 4 was not separated by obesity status, but post-menopausal patients still had a higher SUVmean than pre-menopausal patients. This served as a control for the image analysis data and showed that the bias towards post-menopausal patients should be further investigated. The comparably small sample size in the image analysis was limited by the number of eligible 18F-FLT scans on TCIA. The results approached statistical significance but, likely due to a type 2 error in the setting of limited available data, did not reach significance and would benefit from future follow-up studies with more samples. It should also be noted that our data on the interaction of menopausal status and BMI on breast cancer prognosis cannot distinguish between effects of age and of hormones per se. As aging is associated with increased ectopic lipid accumulation and increased de novo lipogenesis even independent of body weight, the effect of age could certainly confound the findings of the current study [18, 19]. However, due to the limited data available, we were not able to assess the impact of age as a continuous variable on the interaction between BMI, CPT1, and breast cancer outcomes.
To corroborate the image analysis results, we further explore the relationship between CPT1A and breast cancer, through the lens of the relationship between CPT1A and obesity. Past studies have found that CPT1A expression is positively correlated with BMI in humans [20]. Using RNA sequencing visualization, we filtered patients with high expression of CPT1A, using 10.83 FPKM as the determining level again, and explored the survival probabilities of patients in each menopausal stage within the expression level range, as portrayed by Fig 4. This study adds a new perspective to an established trend by breaking down the analysis of CPT1A and breast cancer by obesity and menopausal status. Interestingly, peri-menopausal patients with high CPT1A expression had a 100% survival probability across the study. This could be due to the small sample size in the peri-menopausal group (19 total), but it should be further explored. Fig 5 served as the control and increased confidence in the high CPT1A expression group data.
CPT1A is found in the liver, pancreas, kidney, brain, blood, and embryonic tissues [5]. The results of Fig 6 are partially expected because adipocytes are the predominant cell population in the breast, where they can secrete significant amounts of fatty acids as metabolic substrates for tumors [21]. Therefore, high CPT1A expression, which potentially leads to the high absorption of those fatty acids by the tumor, will take advantage of those fatty acid mobilizations, promoting increased cancer proliferation. Obesity, results in increased breast cancer incidence and breast tumor size, leading to an increased rate of metastasis formation and elevated mortality [2]. This effect potentially increases the number of fatty acid mobilizations for breast cancer cells to utilize. Previous studies have established that CPT1A is expressed in breast tissue, but this study compares this expression to other tissue types in which CPT1A is also highly expressed. Breast tissue is revealed as the tissue type with the highest CPT1A expression level, a feature not previously identified.
Conclusion
In summary, fatty acid metabolism with respect to CPT1A was detrimental to breast cancer outcomes. We separated analyses by obesity and menopausal status, confirming the existing literature and presenting a new angle of breast cancer metabolism. PET and CT images were acquired through TCIA and analyzed in Fiji ImageJ, while RNA sequencing data was visualized in the Xena Functional Genomics Explorer, MARRVEL, and GTEx Portal. Although limited by the number of eligible 18F-FLT scans, we highlighted the importance of fatty acid metabolism in the study of breast cancer metabolism. Prospective studies should break down these analyses using cancer subtype, operative status, and more samples to better portray the effect of dysregulated fatty acid metabolism on breast cancer outcomes.
Acknowledgments
We are grateful to Dr. Gang Peng in the Yale Cancer Center for his helpful input on the statistical analyses performed here.
Data Availability
These are third-party data and not the property of the authors. All data are available through The Cancer Imaging Archive and The Cancer Genome Atlas. The links to the specific datasets are as follows: https://xenabrowser.net/datapages/?dataset=TCGA.BRCA.sampleMap%2FBRCA_clinicalMatrix&host=https%3A%2F%2Ftcga.xenahubs.net&removeHub=https%3A%2F%2Fxena.treehouse.gi.ucsc.edu%3A443 https://gtexportal.org/home/gene/CPT1A https://wiki.cancerimagingarchive.net/pages/viewpage.action?pageId=30671268.
Funding Statement
This study was supported in part by a Pilot Grant from the Yale Cancer Center, and by a dkNET Summer of Data student fellowship. The funders had no role in study design, data collection and analysis, decision to publish, or preparation of the manuscript.
References
- 1.Tan Z., Zou Y., Zhu M., Luo Z., Wu T., Zheng C., et al. (2021). Carnitine palmitoyl transferase 1A is a novel diagnostic and predictive biomarker for breast cancer. BMC Cancer, 21(1). doi: 10.1186/s12885-021-08134-7 [DOI] [PMC free article] [PubMed] [Google Scholar]
- 2.Balaban S., Shearer R. F., Lee L. S., Van geldermalsen M., Schreuder M., Shtein H. C., et al. (2017). Adipocyte lipolysis links obesity to breast cancer growth: Adipocyte-derived fatty acids drive breast cancer cell proliferation and migration. Cancer & Metabolism, 5(1). doi: 10.1186/s40170-016-0163-7 [DOI] [PMC free article] [PubMed] [Google Scholar]
- 3.Tang M., Dong X., Xiao L., Tan Z., Luo X., Yang L., et al. (2022). CPT1A-mediated fatty acid oxidation promotes cell proliferation via nucleoside metabolism in nasopharyngeal carcinoma. Cell Death & Disease, 13(4). doi: 10.1038/s41419-022-04730-y [DOI] [PMC free article] [PubMed] [Google Scholar]
- 4.Li M., Xian H.-C., Tang Y.-J., Liang X.-H., & Tang Y.-L. (2021). Fatty acid oxidation: Driver of lymph node metastasis. Cancer Cell International, 21(1). doi: 10.1186/s12935-021-02057-w [DOI] [PMC free article] [PubMed] [Google Scholar]
- 5.Pucci S., Zonetti M. J., Fisco T., Polidoro C., Bocchinfuso G., Palleschi A., et al. (2016). Carnitine palmitoyl transferase-1A (CPT1A): A new tumor specific target in human breast cancer. Oncotarget, 7(15), 19982–19996. doi: 10.18632/oncotarget.6964 [DOI] [PMC free article] [PubMed] [Google Scholar]
- 6.Zarotti C., Papassotiropoulos B., Elfgen C., Dedes K., Vorburger D., Pestalozzi B., et al. (2022). Biomarker dynamics and prognosis in breast cancer after neoadjuvant chemotherapy. Scientific Reports, 12(1). doi: 10.1038/s41598-021-04032-x [DOI] [PMC free article] [PubMed] [Google Scholar]
- 7.Zhou L., Rueda M., & Alkhateeb A. (2022). Classification of breast cancer nottingham prognostic index using high-dimensional embedding and residual neural network. Cancers, 14(4), 934. doi: 10.3390/cancers14040934 [DOI] [PMC free article] [PubMed] [Google Scholar]
- 8.Baxa J., Ferda J., Ferdova E., Vojtisek R., Topolcan O., & Finek J. (2018). Hybrid imaging pet/ct with application of 18F-Fluorothymidine in patients with head and neck carcinoma undergoing radiotherapy. Anticancer Research, 38(7), 4153–4157. doi: 10.21873/anticanres.12708 [DOI] [PubMed] [Google Scholar]
- 9.Clark K., Vendt B., Smith K., Freymann J., Kirby J., Koppel P., et al. (2013). The cancer imaging archive (TCIA): Maintaining and operating a public information repository. Journal of Digital Imaging, 26(6), 1045–1057. doi: 10.1007/s10278-013-9622-7 [DOI] [PMC free article] [PubMed] [Google Scholar]
- 10.Flegal K. M., Kit B. K., Orpana H., & Graubard B. I. (2013). Association of all-cause mortality with overweight and obesity using standard body mass index categories. JAMA, 309(1), 71. doi: 10.1001/jama.2012.113905 [DOI] [PMC free article] [PubMed] [Google Scholar]
- 11.Goldman M. J., Craft B., Hastie M., Repečka K., Mcdade F., Kamath A., et al. (2020). Visualizing and interpreting cancer genomics data via the xena platform. Nature Biotechnology, 38(6), 675–678. doi: 10.1038/s41587-020-0546-8 [DOI] [PMC free article] [PubMed] [Google Scholar]
- 12.García-estévez L., Cortés J., Pérez S., Calvo I., Gallegos I., & Moreno-bueno G. (2021). Obesity and breast cancer: A paradoxical and controversial relationship influenced by menopausal status. Frontiers in Oncology, 11. doi: 10.3389/fonc.2021.705911 [DOI] [PMC free article] [PubMed] [Google Scholar]
- 13.Wang J., Al-ouran R., Hu Y., Kim S.-Y., Wan Y.-W., Wangler M. F., et al. (2017). MARRVEL: Integration of human and model organism genetic resources to facilitate functional annotation of the human genome. The American Journal of Human Genetics, 100(6), 843–853. doi: 10.1016/j.ajhg.2017.04.010 [DOI] [PMC free article] [PubMed] [Google Scholar]
- 14.Wang J., Liu Z., Bellen H. J., & Yamamoto S. (2019). Navigating marrvel, a web-based tool that integrates human genomics and model organism genetics information. Journal of Visualized Experiments, (150). doi: 10.3791/59542 [DOI] [PMC free article] [PubMed] [Google Scholar]
- 15.Wang J., Mao D., Fazal F., Kim S., Yamamoto S., Bellen H., et al. (2019). Using MARRVEL v1.2 for bioinformatics analysis of human genes and variant pathogenicity. Current Protocols in Bioinformatics, 67(1). doi: 10.1002/cpbi.85 [DOI] [PMC free article] [PubMed] [Google Scholar]
- 16.Gan Y., Yu F., & Fang H. (2021). Novel mutation in carnitine palmitoyltransferase 1A detected through newborn screening for a presymptomatic case in china: A case report. Italian Journal of Pediatrics, 47(1). doi: 10.1186/s13052-021-01094-5 [DOI] [PMC free article] [PubMed] [Google Scholar]
- 17.Nuttall F. Q. (2015). Body mass index. Nutrition Today, 50(3), 117–128. doi: 10.1097/NT.0000000000000092 [DOI] [PMC free article] [PubMed] [Google Scholar]
- 18.Flannery C., Dufour S., Rabøl R., Shulman G. I., & Petersen K. F. (2012). Skeletal muscle insulin resistance promotes increased hepatic de novo lipogenesis, hyperlipidemia, and hepatic steatosis in the elderly. Diabetes, 61(11), 2711–2717. doi: 10.2337/db12-0206 [DOI] [PMC free article] [PubMed] [Google Scholar]
- 19.Petersen K. F., Morino K., Alves T. C., Kibbey R. G., Dufour S., Sono S., et al. (2015). Effect of aging on muscle mitochondrial substrate utilization in humans. Proceedings of the National Academy of Sciences, 112(36), 11330–11334. doi: 10.1073/pnas.1514844112 [DOI] [PMC free article] [PubMed] [Google Scholar]
- 20.Warfel J. D., Vandanmagsar B., Dubuisson O. S., Hodgeson S. M., Elks C. M., Ravussin E., et al. (2017). Examination of carnitine palmitoyltransferase 1 abundance in white adipose tissue: Implications in obesity research. American Journal of Physiology-Regulatory, Integrative and Comparative Physiology, 312(5), R816–R820. doi: 10.1152/ajpregu.00520.2016 [DOI] [PMC free article] [PubMed] [Google Scholar]
- 21.Kothari C., Diorio C., & Durocher F. (2020). The importance of breast adipose tissue in breast cancer. International Journal of Molecular Sciences, 21(16), 5760. doi: 10.3390/ijms21165760 [DOI] [PMC free article] [PubMed] [Google Scholar]


