

Abstract
Lipids contribute to the structure, development, and function of healthy brains. Dysregulated lipid metabolism is linked to aging and diseased brains. However, our understanding of lipid metabolism in aging brains remains limited. Here, we examined the brain lipidome of mice across their lifespan using untargeted lipidomics. Co-expression network analysis highlighted a progressive decrease in 3-sulfogalactosyl diacylglycerols (SGDGs) and SGDG pathway members, including the potential degradation products lyso-SGDGs. SGDGs show an age-related decline specifically in the central nervous system and are associated with myelination. We also found that an SGDG dramatically suppresses LPS-induced gene expression and release of pro-inflammatory cytokines from macrophages and microglia by acting on the NF-κB pathway. The detection of SGDGs in human and macaque brains establishes their evolutionary conservation. This work enhances interest in SGDGs regarding their roles in aging and inflammatory diseases and highlights the brain lipidome’s complexity and potential biological functions in aging.
Graphical Abstract
INTRODUCTION
Aging leads to cognitive decline and is the primary risk factor for neurodegenerative diseases1. Genome-wide gene expression studies have revealed conserved pathways of brain aging such as mitochondrial dysfunction, stress response, and inflammatory response2. However, the molecular changes in the brain during normal aging, especially in terms of small molecules, are still not fully appreciated since many metabolites remain uncharacterized.
Lipids play crucial roles in many biological processes and are especially important in the brain. Lipids account for over half of the brain’s dry weight and are essential for healthy brain development. Impaired lipid metabolism in the brain has been implicated in neurological disorders among the elderly3, 4. The strongest genetic risk factor for Alzheimer’s disease is the ApoE4 variant of ApoE, the major apolipoprotein that transports cholesterol from astrocytes to neurons5. Mutations in glucocerebrosidase, an enzyme that cleaves the glycolipid glucosylceramide, are a risk factor for Parkinson’s disease6. Specific lipids and lipid-modifying enzymes cause neurological disorders. For instance, accumulation of the pro-inflammatory lyso-phosphatidylserines in the brain contributes to the development and progression of a neurodegenerative disease PHARC7. Therefore, characterizing lipid changes in the aging brain can improve our understanding of the molecular basis of brain aging, reveal new mechanisms underlying age-related neurological diseases, and, eventually, provide opportunities for therapeutic intervention.
Lipidomics allows the identification and quantification of lipids in cells, tissues, and organisms at the systems level3. Previous studies have demonstrated changes in the brain lipidome during aging, revealing lipid classes such as ceramides and sphingomyelins which are remodeled by changes in their acyl chains8–11. By integrating chemistry and chemical biology with lipidomics, we have shown that we can identify and characterize new bioactive lipids12, 13. We reasoned that we could uncover lipids and lipid pathways unappreciated in previous studies and chemically synthesize and test these lipids for biological activity. We also realized that with the increased data points collected by modern lipidomics workflows, a systems-level data analysis method is required to analyze large-scale lipid changes at various ages and identify significant aging-related lipids and lipid pathways.
Here, we performed liquid chromatography-mass spectrometry (LC-MS)-based untargeted lipidomics of mouse brains at five ages ranging from 4 weeks to 78 weeks. To model systems-level differences, we applied co-expression network analysis to our lipidomics data and identified modules of highly correlated lipids associated with aging. Specifically, we demonstrated that sulfogalactosyl glycerolipids including sulfogalactosyl diacylglycerols (SGDGs) and sulfogalactosyl alkylacylglycerols (SGAAGs) show a consistent and continuous decline during aging. We developed targeted quantification methods to verify that the age-related decrease of SGDGs and SGAAGs specifically occurs in the central nervous system (CNS), and SGDGs are structural components of myelin. Furthermore, we found for the first time that SGDGs are present in human and macaque brains, demonstrating their evolutionary conservation in mammals. Since inflammation is a common feature of age-related neurodegenerative diseases and plays critical roles in neurodegeneration14, 15, we synthesized and tested an SGDG in inflammation assays. These assays demonstrate that SGDGs possess anti-inflammatory activity, suggesting a potential role for this lipid class in the brain.
RESULTS
Global lipidomic analysis of aging mouse brain
To determine the effects of aging on brain lipids in mice, we performed LC-MS/MS-based untargeted lipidomics to compare a broad range of lipids from the brains of mice at 4, 12, 25, 48, and 78 weeks of age. These mice correspond to juvenile, mature adult, middle-aged, and old animals. A total of 18,395 and 10,961 features (i.e., ions with unique combination of m/z and retention time) were quantified in the negative and positive ionization modes, respectively. By searching the high-resolution MS/MS spectra against the LipidSearch database, which contains more than 1.5 million lipids, we identified 669 and 524 lipids in the negative and positive ionization mode, respectively. Unidentified features come from lipids not covered by the database, signal redundancies, informatics artifacts, and chemical contaminants16. We combined features (identified or unidentified) detected from both ionization modes for subsequent analyses. The principal component analysis (PCA) of identified lipids showed brain samples are mainly separated by age, suggesting that lipid composition undergoes continuous remodeling across the mouse lifespan (Fig. 1a).
Figure 1.
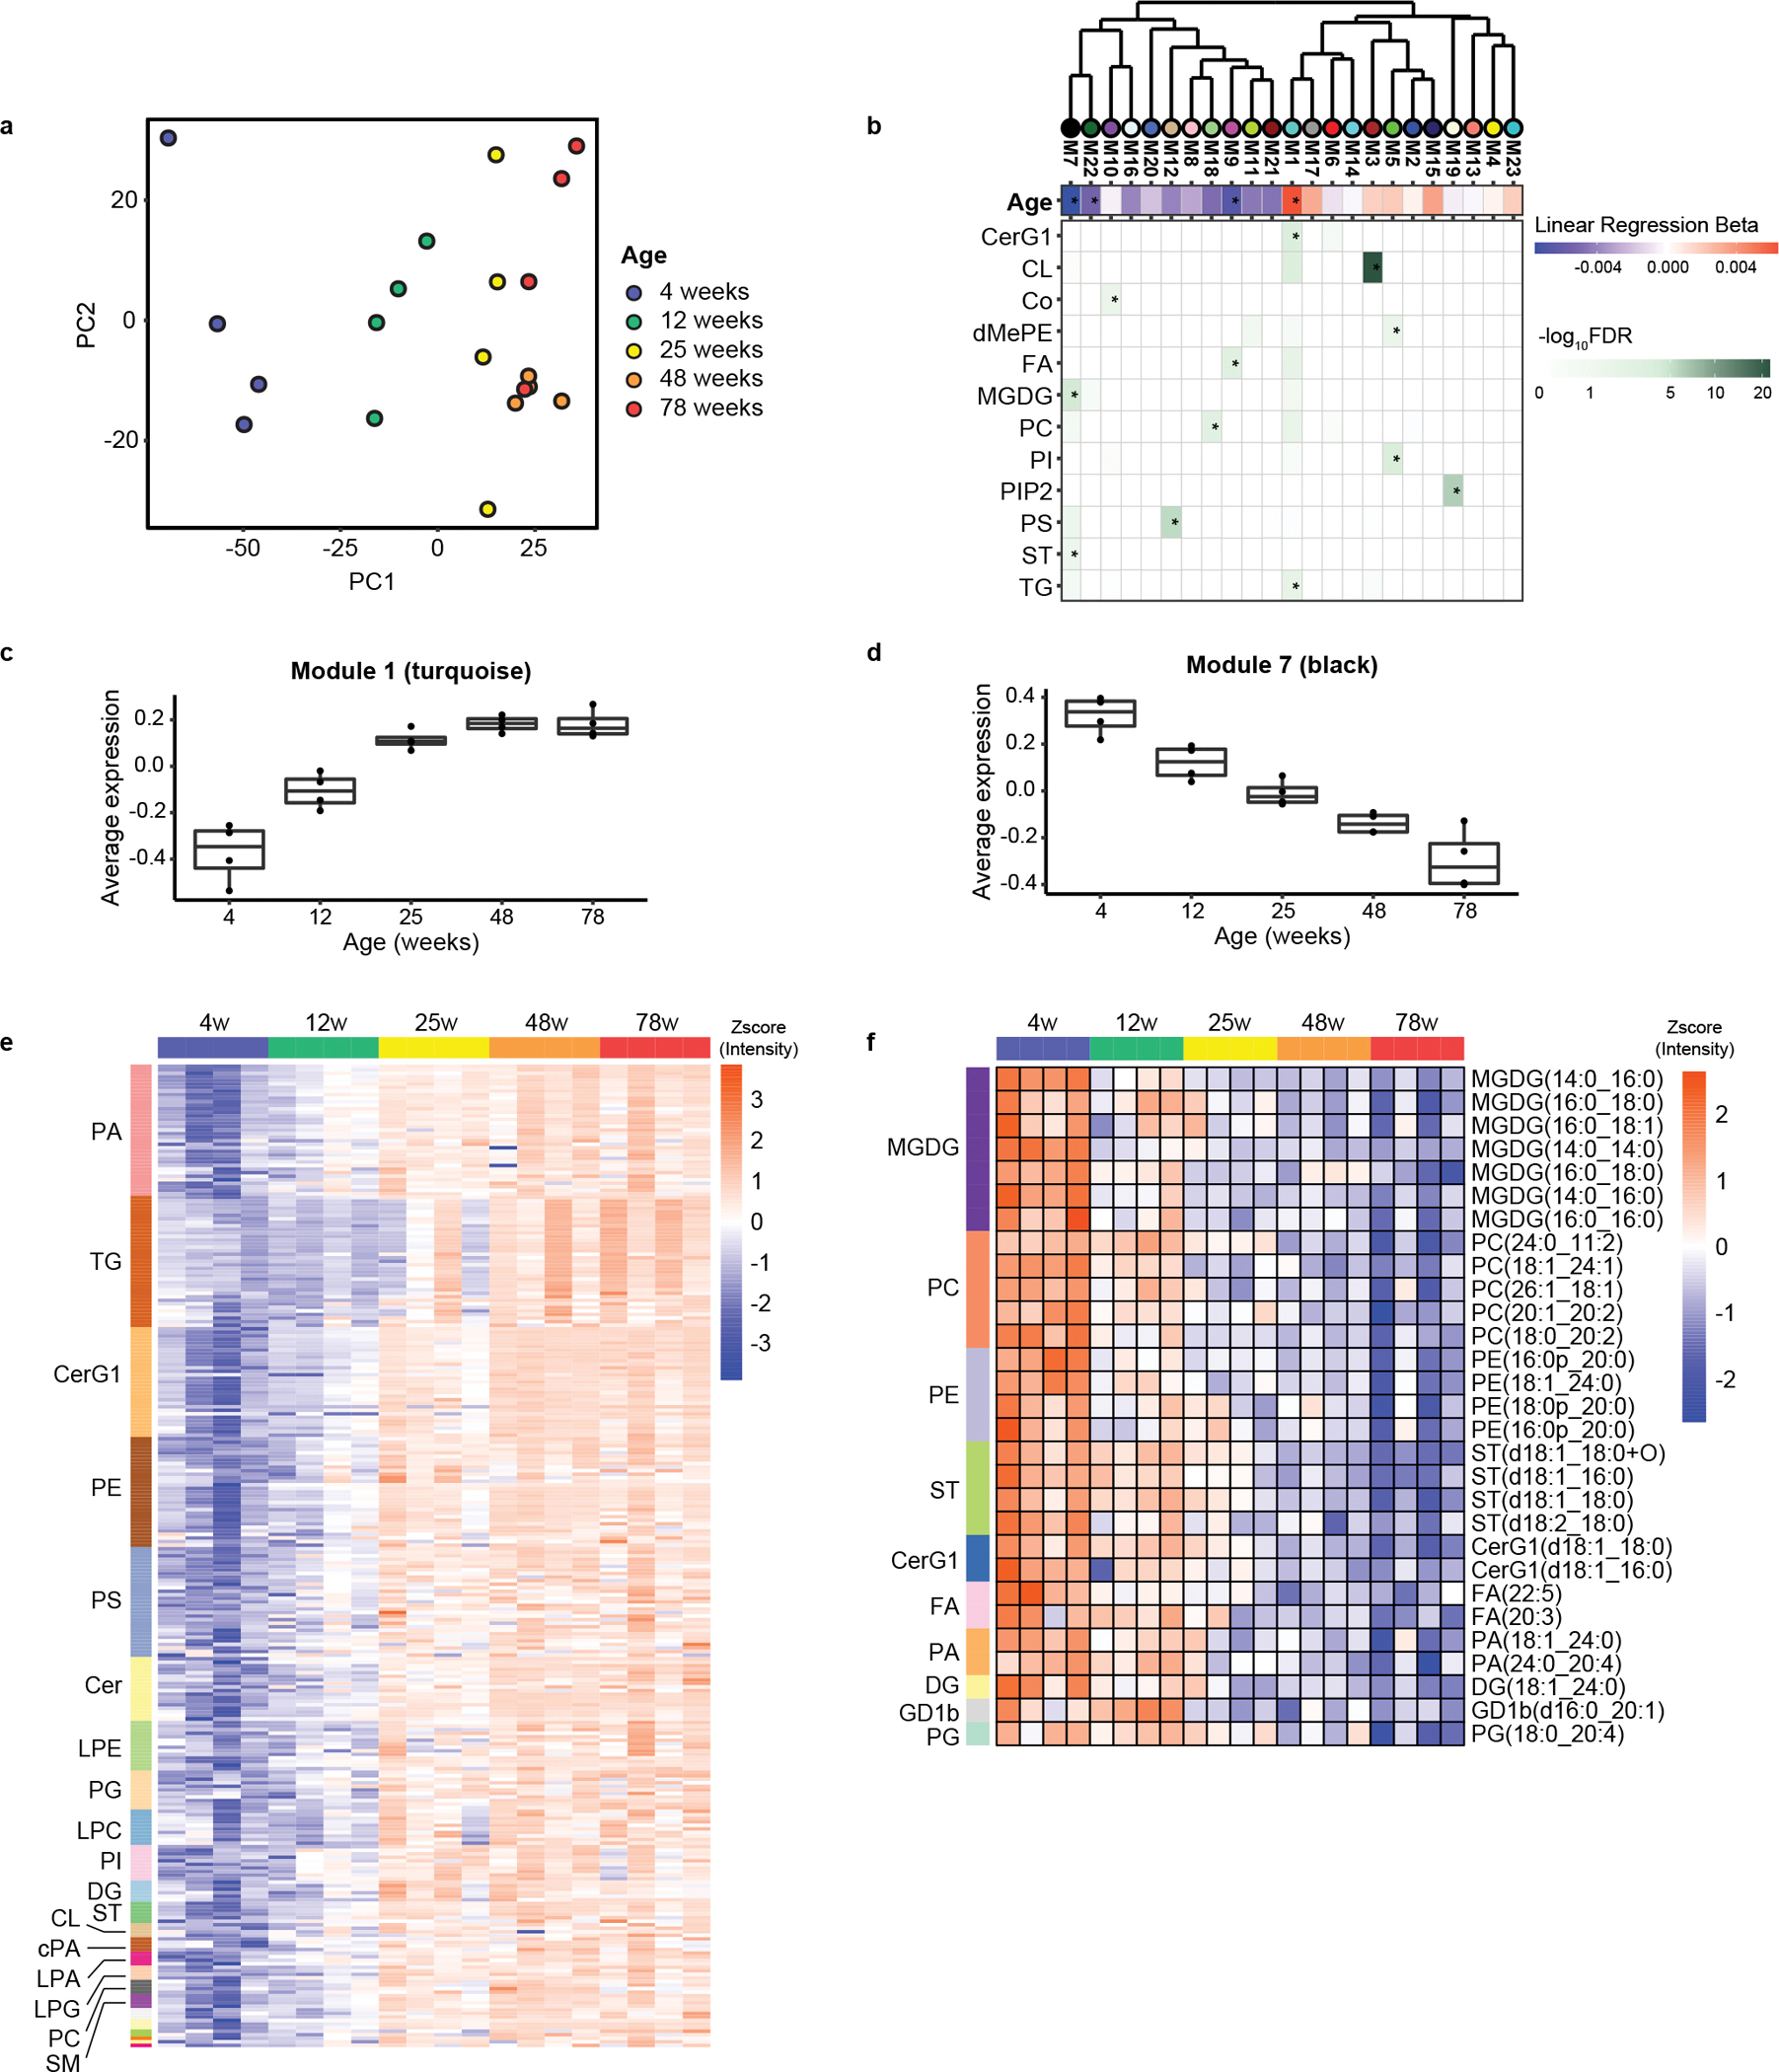
Global lipidomics of mouse brain during aging. (a) Principal component analysis (PCA) of brain samples from mice at 4, 12, 25, 48, and 78 weeks of age. The PCA analysis was performed with identified lipids. (b) Hierarchical clustering of co-expression modules by module eigenlipid. Modules statistically significantly associated with age at FDR < 0.05 are marked with asterisks (*). Blue, downregulated with age; red, upregulated with age. Darker color indicates larger change with age. Lipid enrichment analyses are shown at the bottom with asterisks (*) corresponding to FDR < 0.05. (c, d) Average levels of the co-expressed lipids in the turquoise (c) and the black (d) modules across different ages. n = 4 mice/group. Box, 25th to 75th percentile; center line, median; whisker, 1.5× interquartile range. (e, f) Expression profile of the identified lipids in the turquoise (e) and the black (f) modules across different ages.
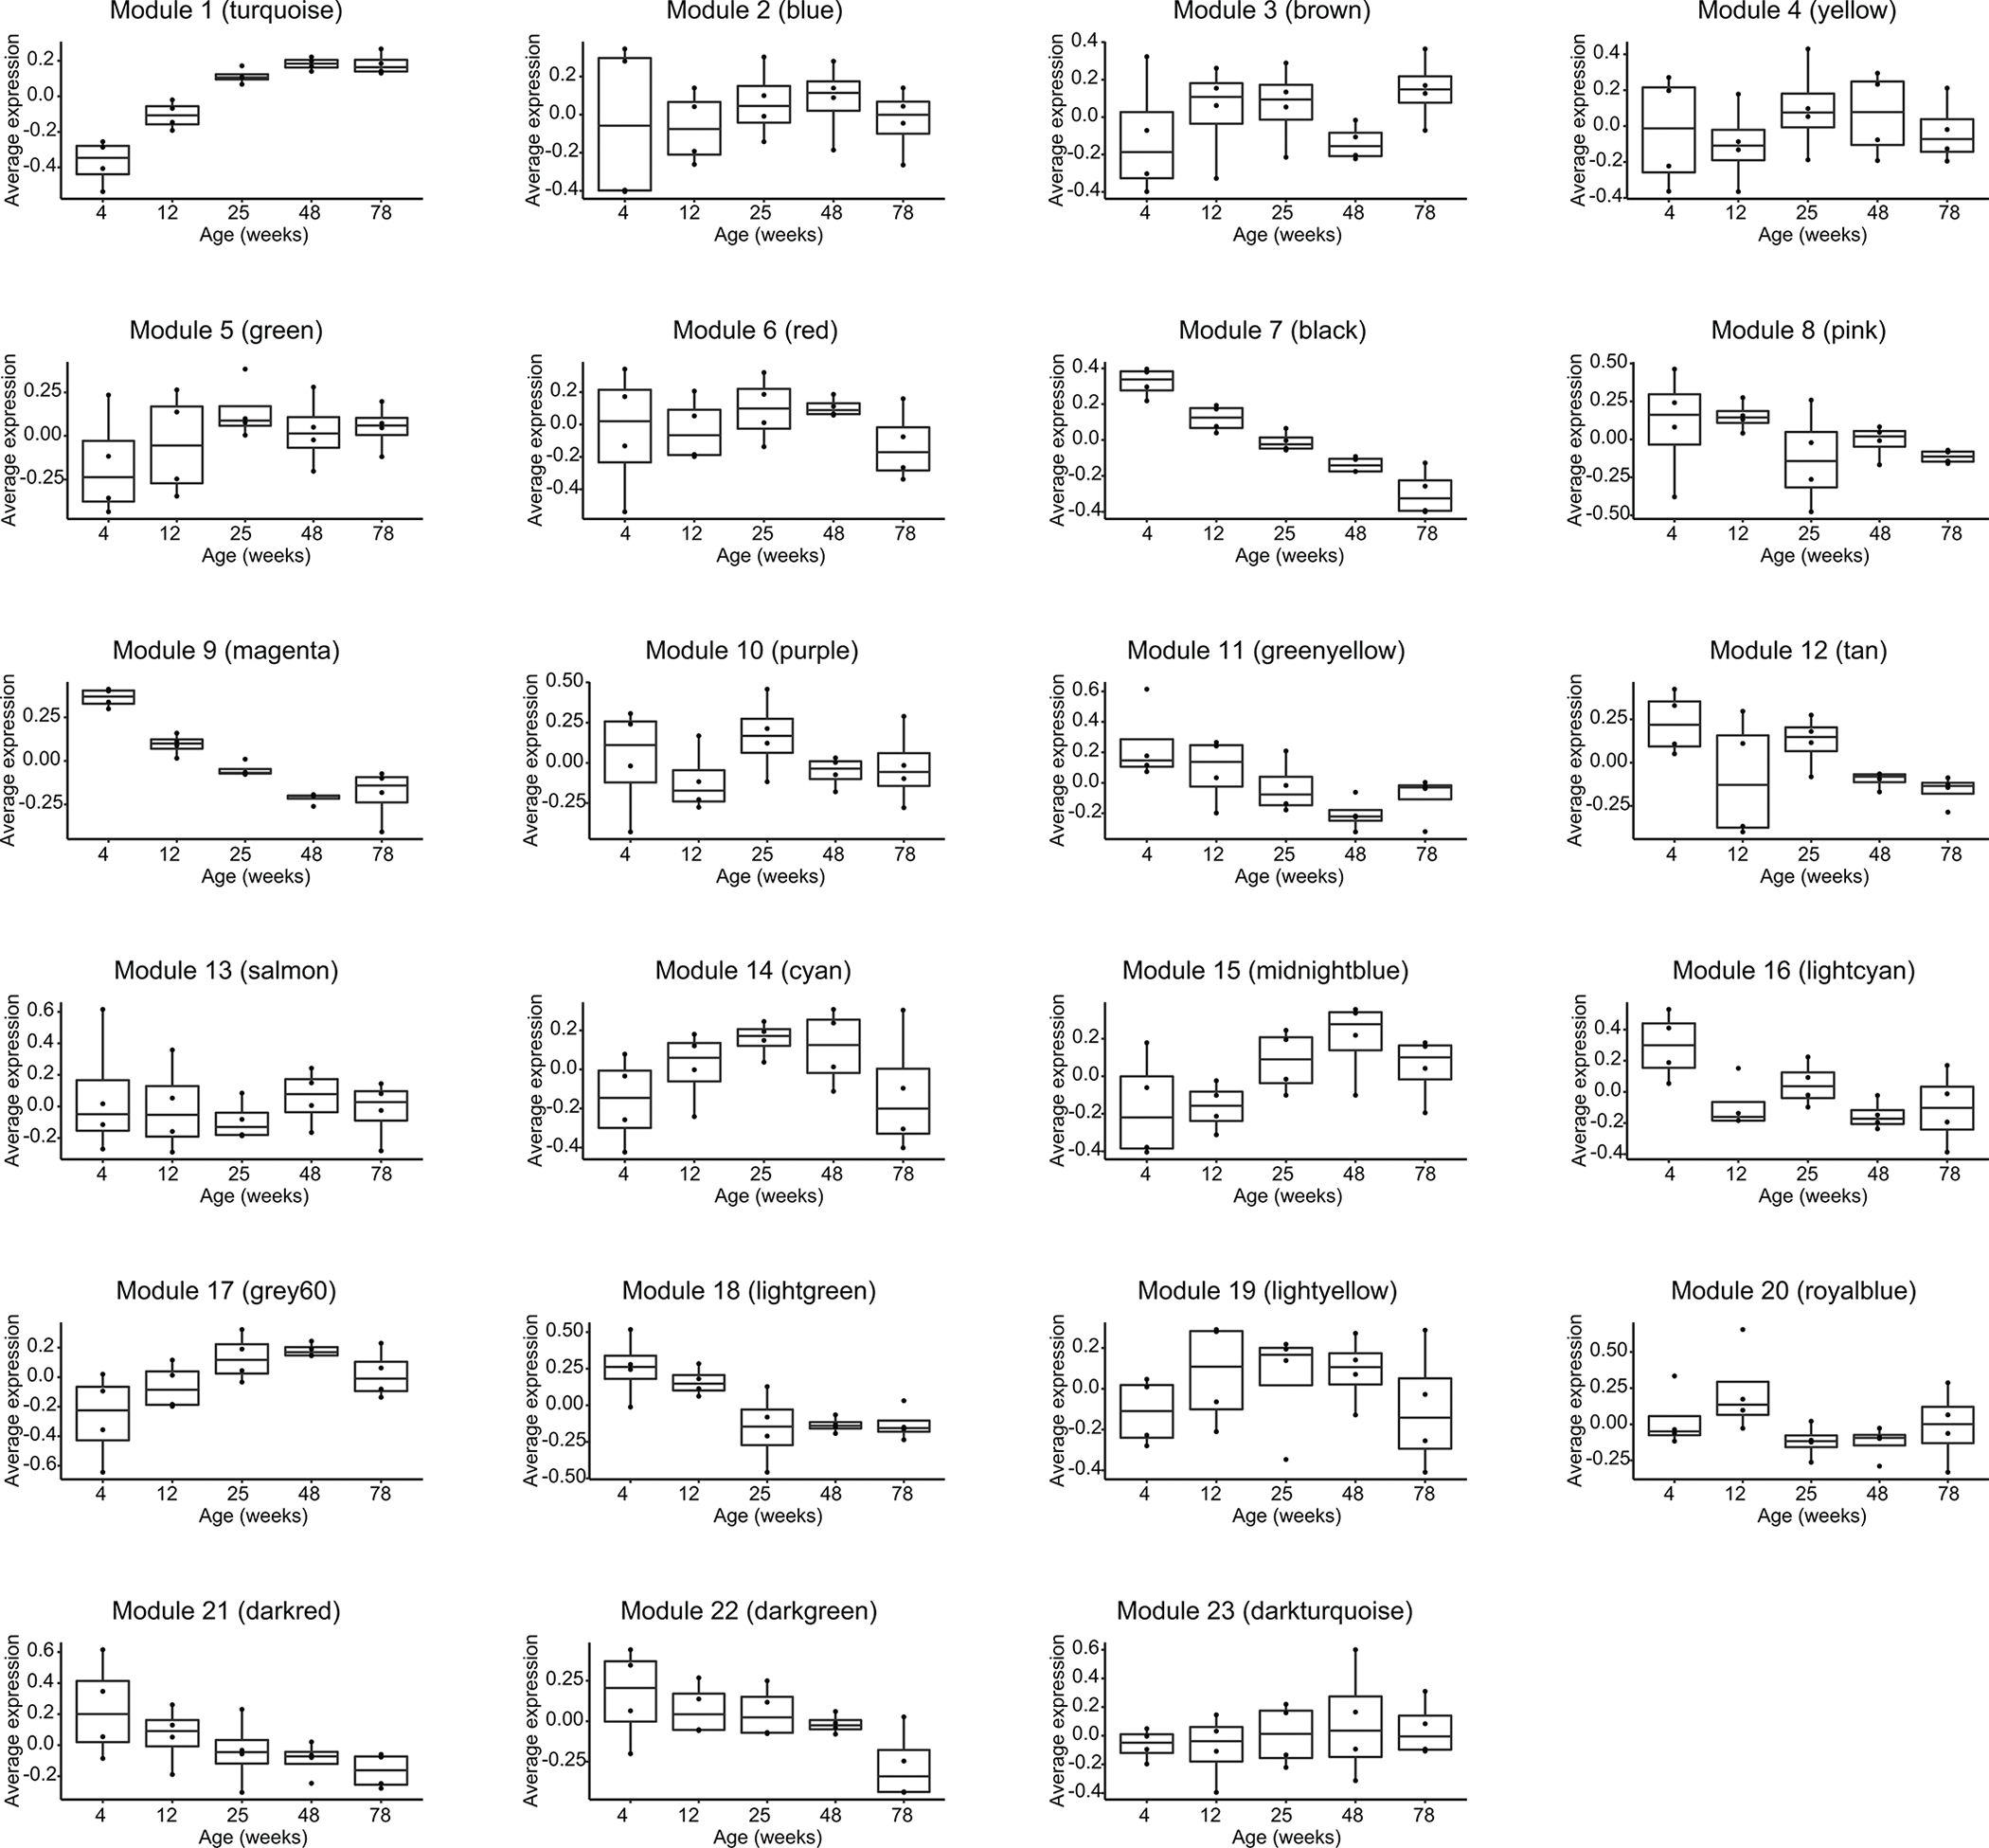
Lipids from the same pathway, cell type, or tissue often share a similar expression pattern. Lipids can also share a temporal expression pattern for datasets with multiple time points due to their intrinsic biological relevance. Therefore, we reasoned that it would be useful to identify groups of lipids with similar expression patterns to obtain a complete picture of the lipid changes in our dataset. Weighted correlation network analysis (WGCNA) is a widely used co-expression network analysis approach that groups molecules with similar expression patterns into co-expressed modules17. It provides systems-level insights into the molecular mechanisms and can detect molecules that play important biological roles but have low abundance or small fold changes. We applied WGCNA to analyze all the features detected in our lipidomics datasets, including the identified and unidentified lipids. A total of 23 modules of highly correlated lipids were identified. They were assigned distinct colors based on module size (e.g., turquoise denotes the largest module, blue next, etc.) (Extended Data Fig. 1). The various temporal expression patterns represented by these modules indicate diverse changes in lipid metabolism. We next performed enrichment analysis to identify lipid classes overrepresented in each module (Fig. 1b).
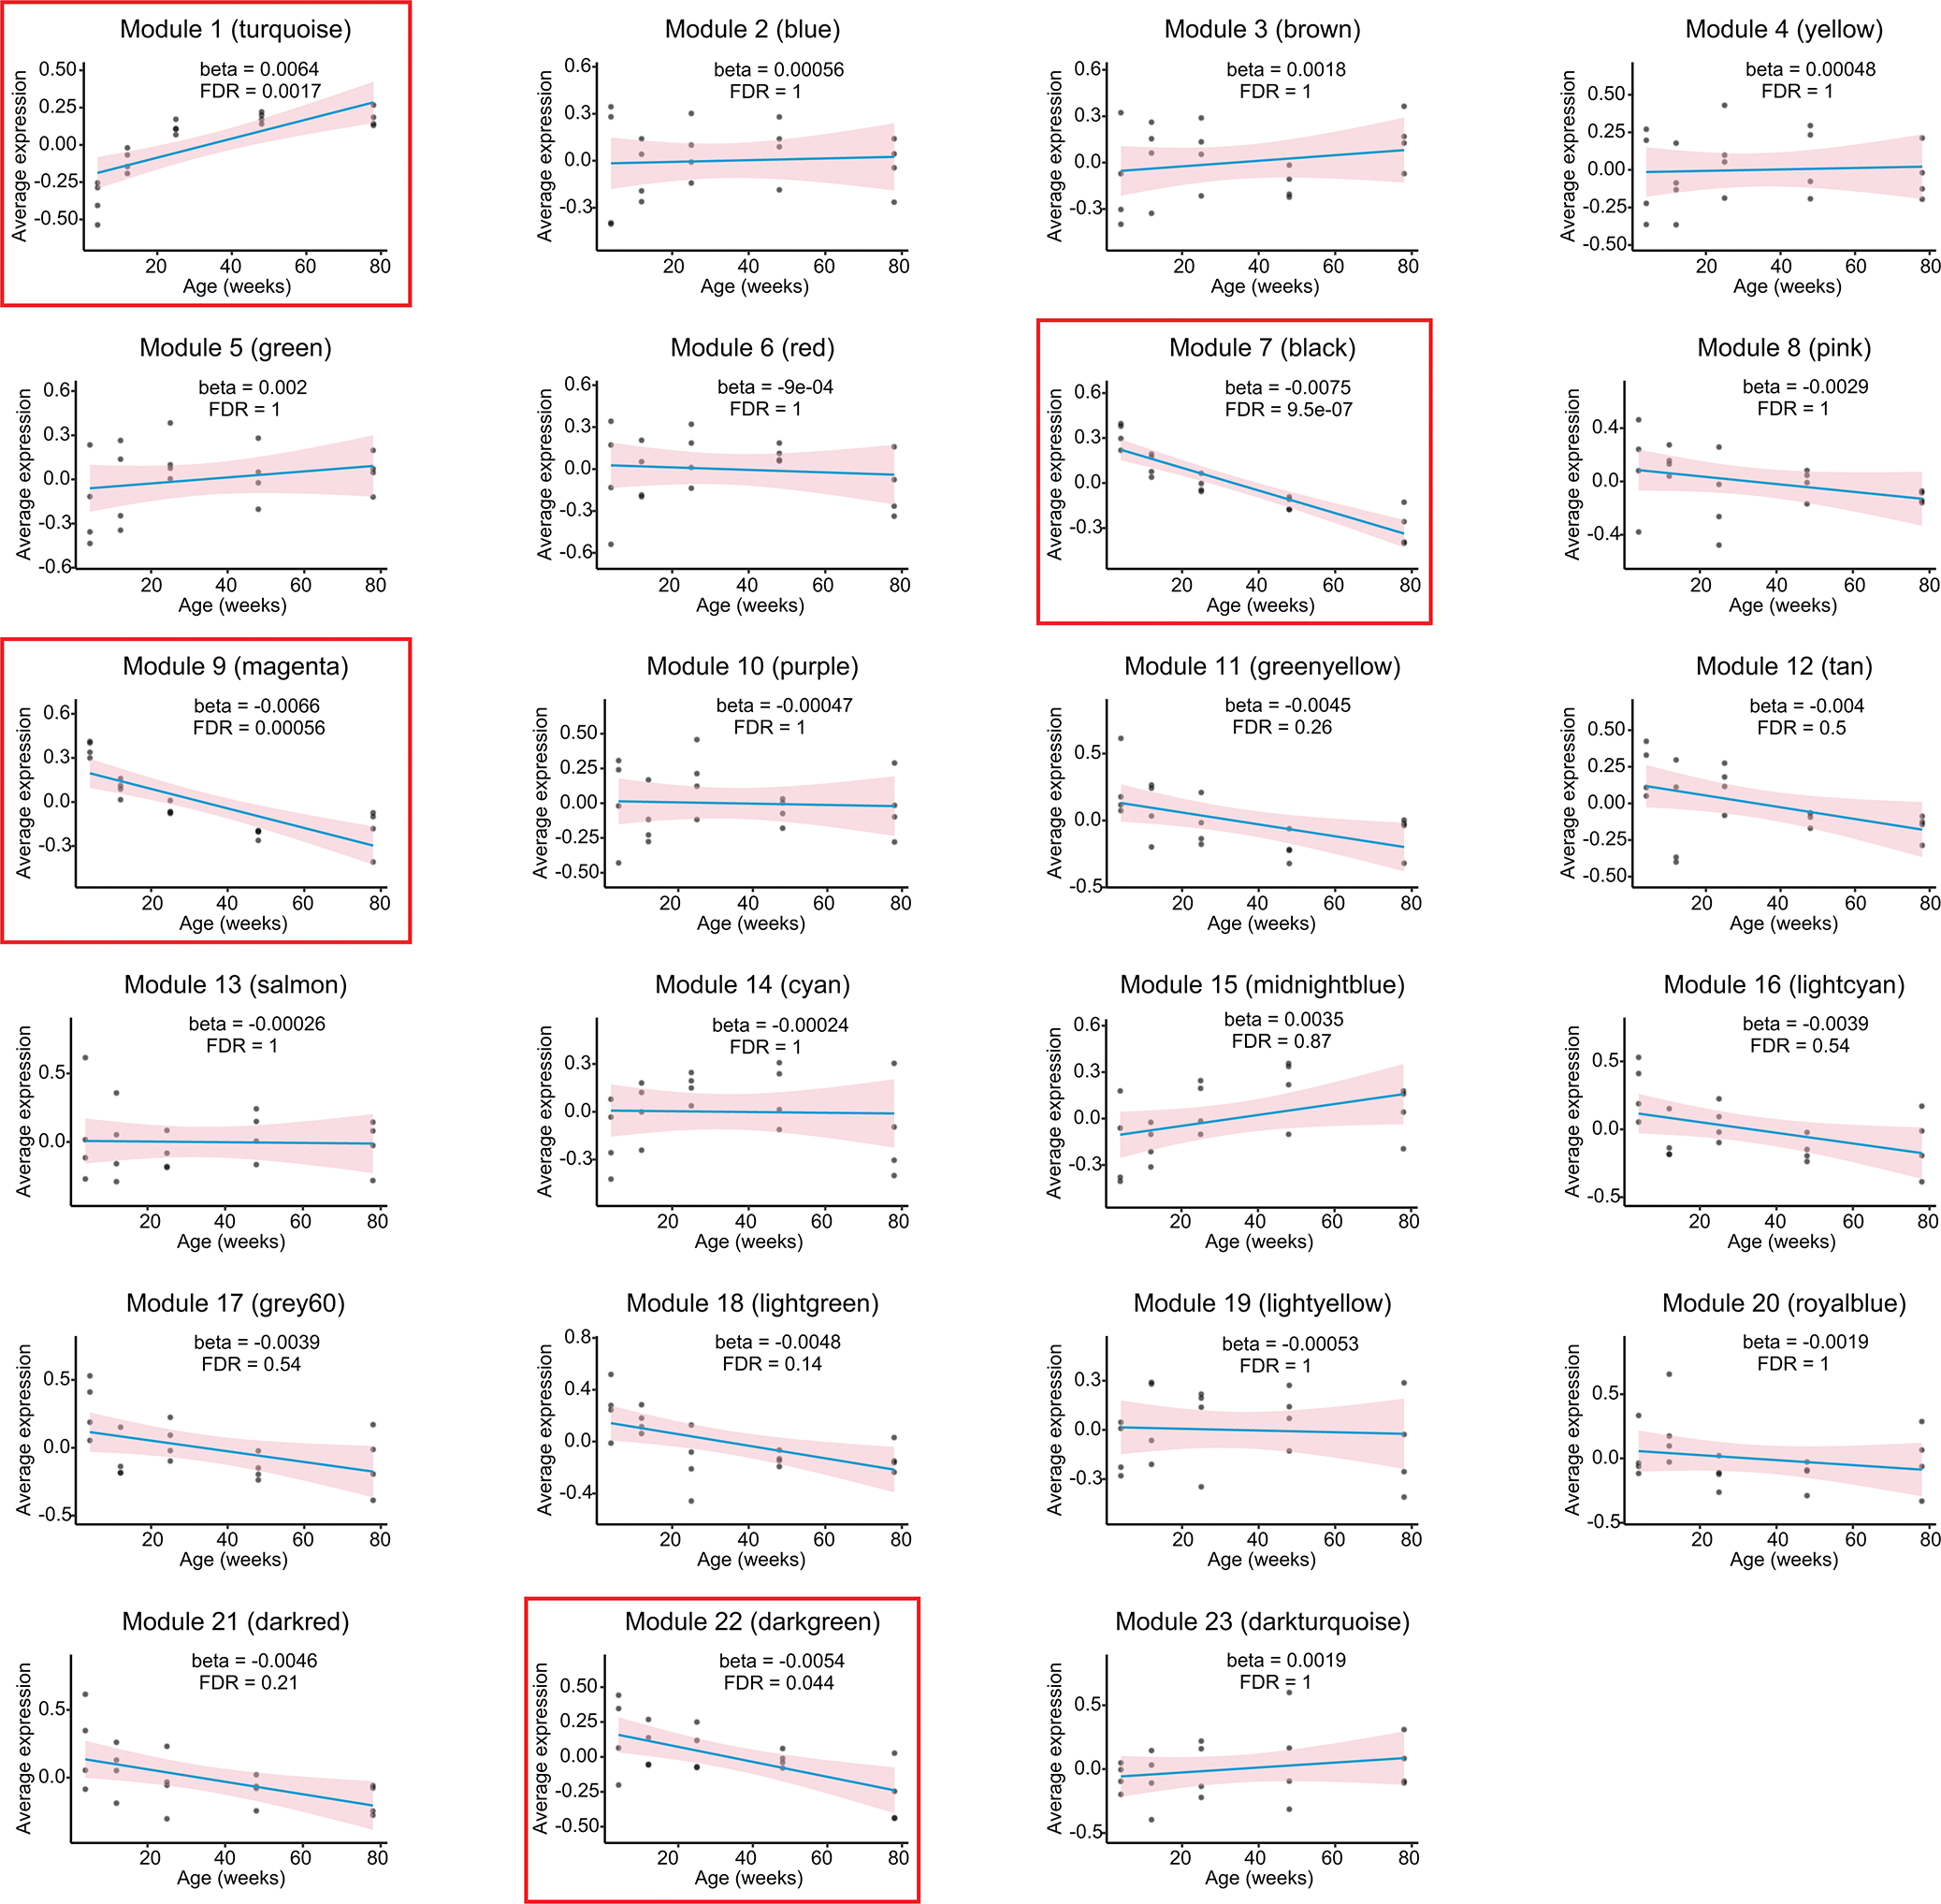
To look for important modules during aging, we performed correlation analysis between age and module eigenlipid using a linear regression model (Fig. 1b and Extended Data Fig. 2). An eigenlipid is a mathematically generated representative lipid for a module whose expression is the average of all the module members. Of the 23 modules, four are significantly associated with age, with one (M1/turquoise) showing increased levels and three (M7/black, M9/magenta, M22/dark green) showing decreased levels with aging (Fig. 1b and Extended Data Fig. 2). The turquoise and black modules are of particular interest because they are not only significantly associated with age but also show the largest change (Fig. 1b and Extended Data Fig. 2). The turquoise module progressively increased with aging (Fig. 1c). It includes various glycerophospholipids, glycerolipids, and sphingolipids and is enriched for triacylglycerols (TG) and glycosylceramides (CerG1) (Fig. 1b, e), consistent with other studies10, 18. The black module progressively decreased with aging and mainly includes monogalactosyl diacylglycerols (MGDGs) and glycerophospholipids (Fig. 1d, f). Some lipid classes are present in both the turquoise and black modules, e.g., PE and sulfatide (ST). PEs in the turquoise module have lower degree of saturation than in the black module (Supplementary Table 1). STs in the turquoise module have longer acyl chains than in the black module (Supplementary Table 1), suggesting differential regulation of the subclasses during aging.
A class of lipids that progressively decrease with aging
Module hubs are molecules with the highest degree of connectivity within a module and may control the expression of other module members17, 19, 20. Previous cancer studies show module hub genes are more likely to be cancer targets or cancer markers20. We identified the hubs in the turquoise and black modules. However, most of the hubs were not annotated by LipidSearch. Therefore, we manually inspected the MS/MS spectra of unannotated hubs. Many unannotated hubs in the black module have a similar fragmentation pattern in tandem MS. Their [M-H]- precursors generate a most abundant product ion at m/z 96.9587 and a less abundant product ion at m/z 241.0023 (Fig. 2a). We deduced that the m/z 96.9587 ion corresponds to a sulfate group (HO4S-, 96.9601) and the m/z 241.0023 ion corresponds to a sulfated sugar group (C6H9O8S-, 241.0024). The presence of the common ions in the MS/MS spectra indicates that they belong to a class of lipids with a sulfoglycosyl head group. We also observed product ions corresponding to fatty acids or the loss of a fatty acyl group. We thus determined that these unannotated lipids are sulfoglycosyl glycerolipids that are further divided into sulfoglycosyl diacylglycerols and sulfoglycosyl alkylacylglycerols. The two subclasses behave identically following collisional activation in MS except that the fragmentation of sulfoglycosyl alkylacylglycerols only occurs between the acyl chain and glycerol but not between the alkyl chain and glycerol (Fig. 2a), in agreement with the ether bond being more stable than the ester bond. To annotate these lipids in our whole dataset, we generated a list of sulfoglycosyl diacylglycerols and sulfoglycosyl alkylacylglycerols by enumerating combinations of the 19 most abundant fatty acids in the brain and looked for them based on their exact masses and fragmentation patterns. We identified 8 sulfoglycosyl diacylglycerols and 12 sulfoglycosyl alkylacylglycerols in total, with 6 of each subclass in the black module (Fig. 2b). Enrichment analysis shows that sulfoglycosyl diacylglycerols, sulfoglycosyl alkylacylglycerols, and MGDGs are highly enriched in this module, suggesting that they are co-regulated or functionally related (Fig. 2c).
Figure 2.
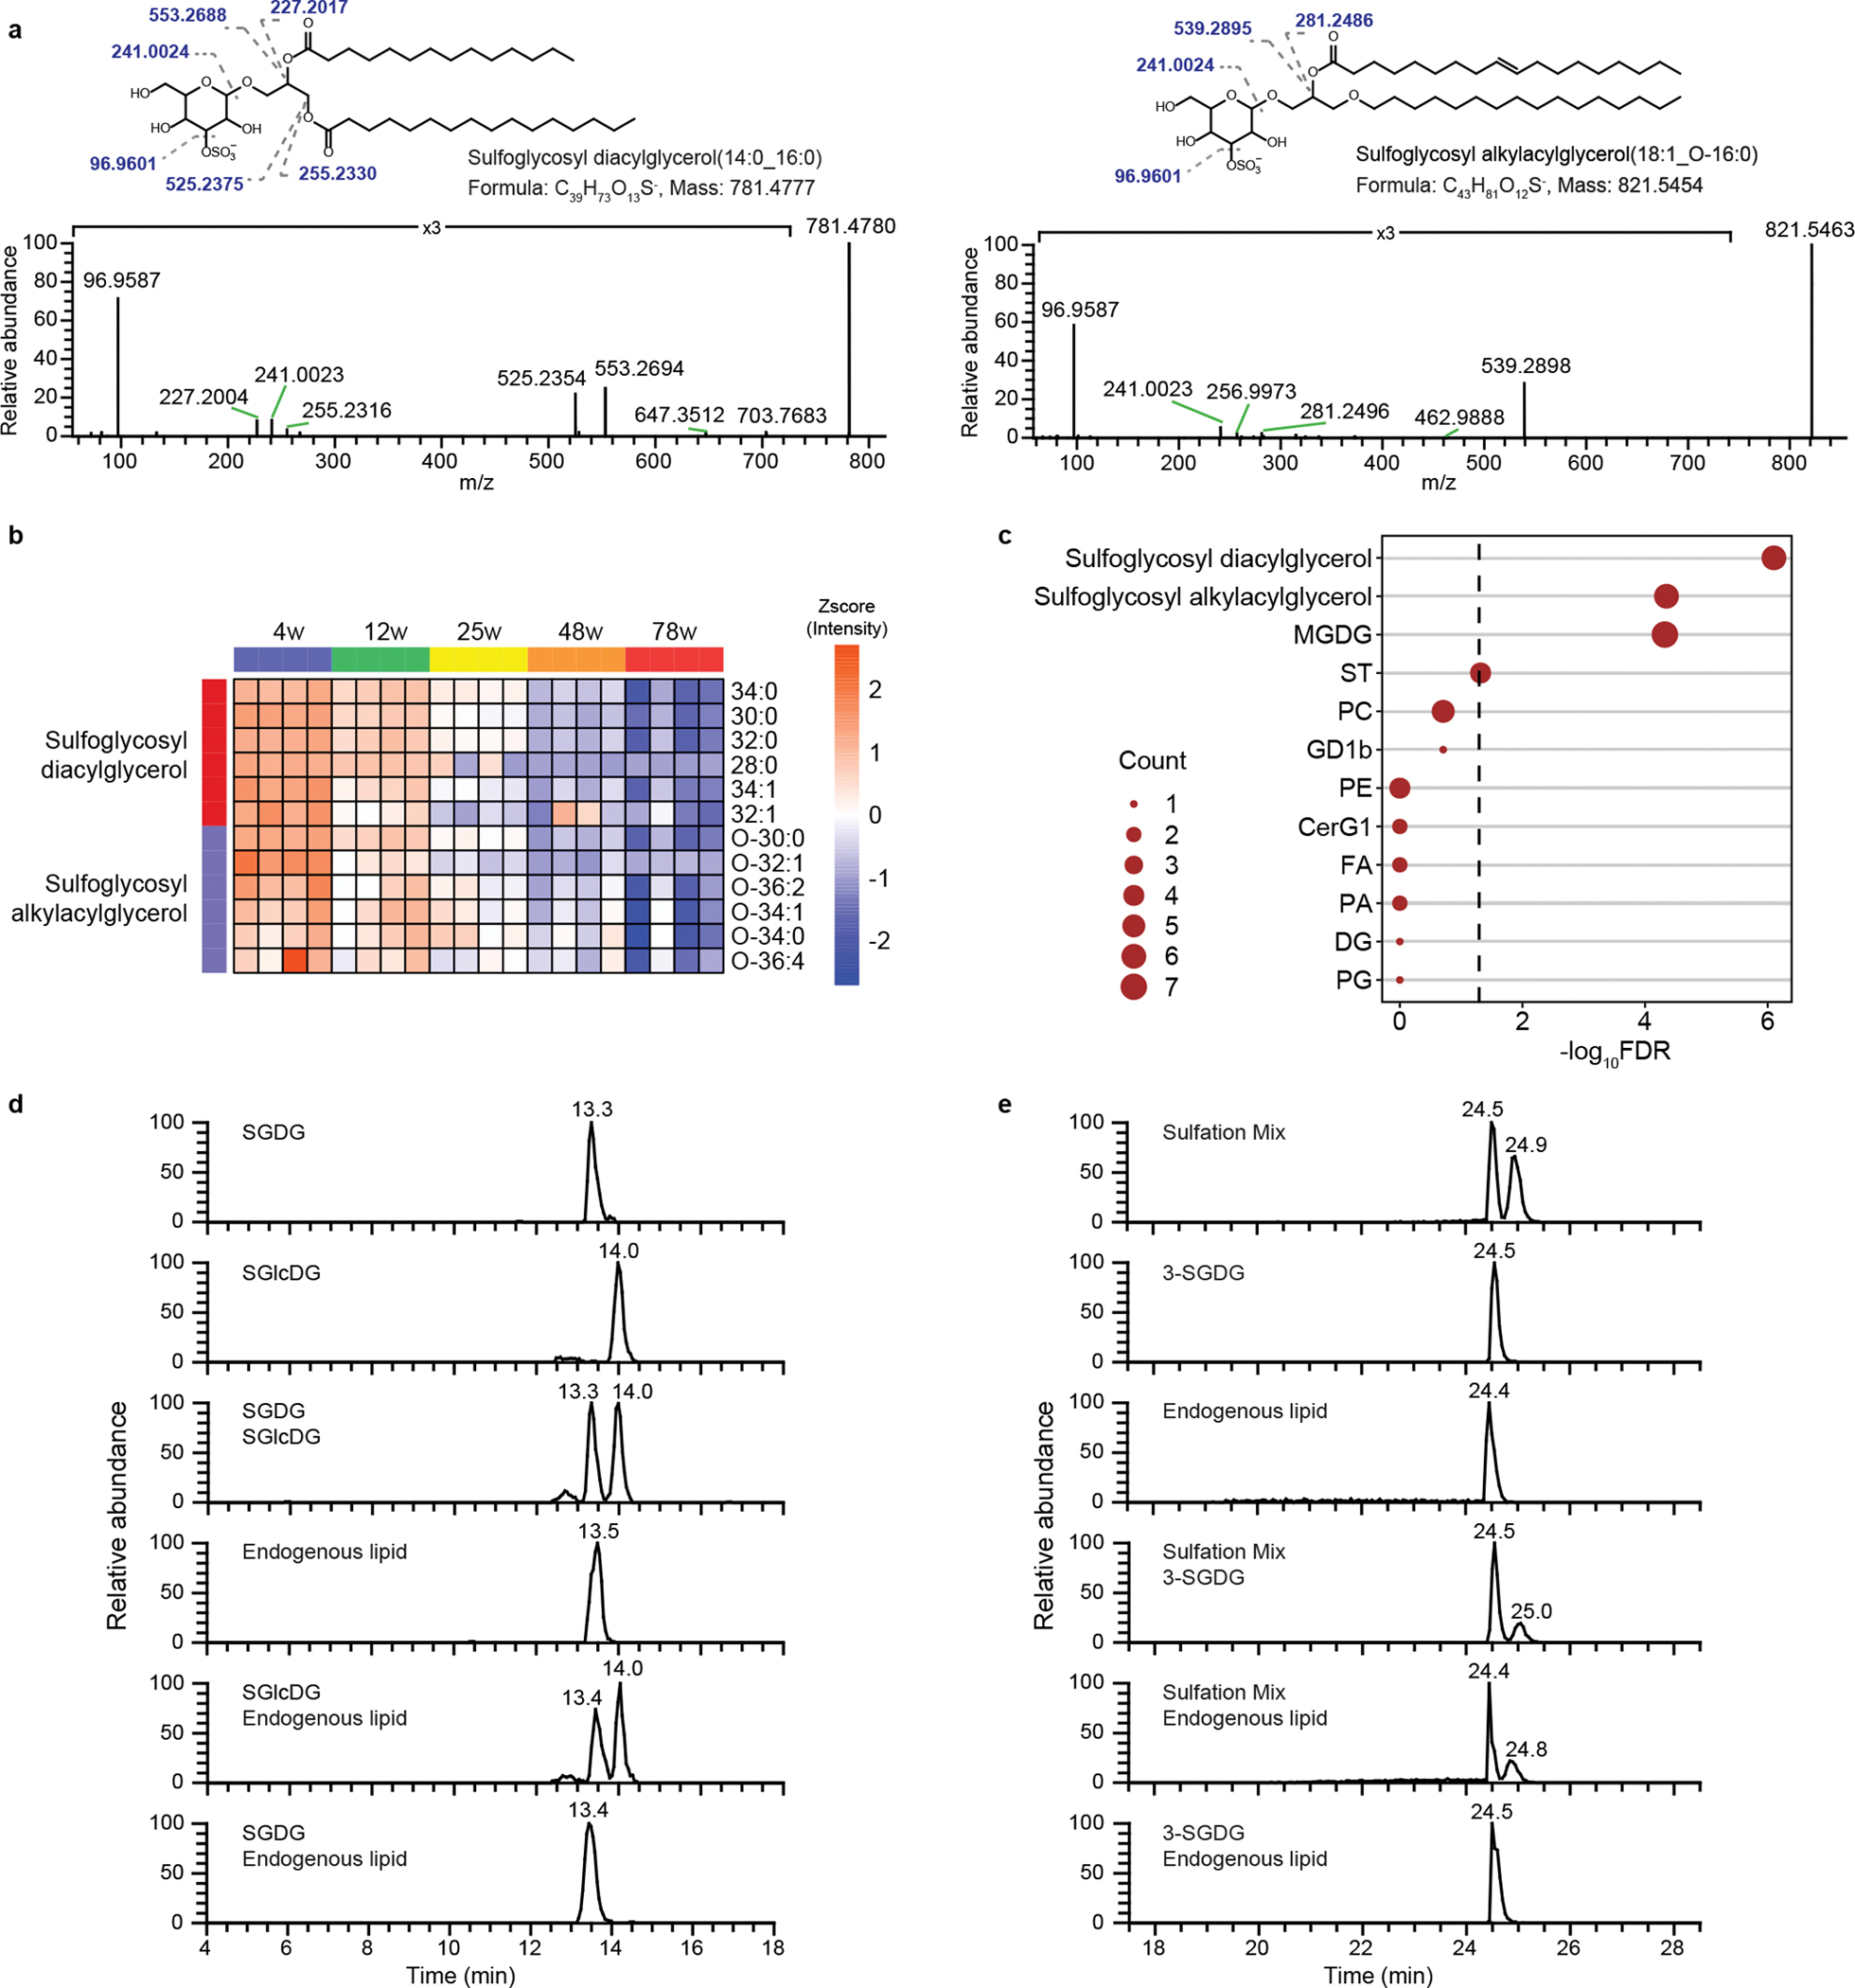
Discovery of a class of lipids that progressively decrease during aging. (a) Representative MS/MS spectrum of a sulfoglycosyl diacylglycerol and a sulfoglycosyl alkylacylglycerol identified in the mouse brain at HCD 30 V, featuring ions at m/z 96.9587 and m/z 241.0023 corresponding to sulfate and glycosyl sulfate. (b) Expression profile of sulfoglycosyl diacylglycerols and sulfoglycosyl alkylacylglycerols in the black module. (c) Enrichment analysis of lipid classes in the black module. Dashed line, FDR 0.05; node size, number of lipid species of the indicated lipid class. (d) Endogenous sulfoglycosyl diacylglycerol contains a galactose group. SGDG and SGlcDG are synthetic sulfoglycosyl diacylglycerol standards containing galactose and glucose, respectively. (e) The sulfate group is attached to the alcohol at the 3-position on SGDG. Sulfation mix was prepared by loading the sulfate unselectively. Shown in (d) and (e) are extracted ion chromatograms of SGDG(14:0/16:0). Endogenous lipid is crude lipid extract from mouse brain.
Structural determination of SGDG
While MS allowed us to identify the putative structure of sulfoglycosyl diacylglycerols, it could not provide key structural details, including the type of sugar and the position of sulfate. For example, glucose and galactose are different sugars, but since they have the same atomic composition and molecular mass, they cannot be distinguished by MS. Therefore, we used a combination of chemical synthesis and LC-MS to establish the molecular structures. First, we synthesized two sulfoglycosyl diacylglycerol standards, one containing galactose (SGDG) and the other containing glucose (SGlcDG). The two isomers were fully resolved on a hydrophilic interaction chromatography column with a combined amide/amino stationary phase with SGDG eluting earlier than SGlcDG (Fig. 2d). A single peak was observed from the lipid extract of mouse brain, suggesting only one isomer is present in vivo. Co-injecting the endogenous lipid with SGlcDG resulted in two peaks, whereas co-injecting with SGDG resulted in one peak, indicating that the naturally occurring lipid contains galactose (Fig. 2d).
The position where a sugar group is sulfated is critical for its interaction with proteins and thus biology relevant21. We synthesized 3-SGDG using a diarylborinic acid-catalyzed regioselective sulfation of galactose22. To verify that our LC method can distinguish SGDG regioisomers, we prepared a sulfation mix by performing the sulfation reaction without the catalyst. This results in nonselective sulfation of the two most nucleophilic hydroxyl groups, 3- and 6-positions of galactose22. Separation of the mix yielded two peaks on a reverse-phase column (Fig. 2e), indicating the presence of the two sulfated products. Co-injecting the mix with 3-SGDG yielded two peaks with the earlier eluting peak having a higher intensity (Fig. 2e), suggesting the earlier peak is 3-SGDG. The endogenous lipid co-eluted with 3-SGDG and the earlier peak in the sulfation mix but not the later peak (Fig. 2e), indicating that sulfate is attached to the alcohol at the 3-position on SGDG. Hereafter, we refer to 3-SGDG as SGDG.
SGDGs and SGAAGs decrease with aging specifically in the CNS
SGDGs are absent from lipid databases (LipidSearch, LipidBlast23, LIPID MAPS24, and METLIN25) and are rarely known. A few earlier studies showed that SGDGs are present in rat brain and increase in developing rat brain, followed by decreased levels in young adult rats26–28. Still, our observation of a continued decrease during the entire rodent lifespan into old age is novel. Also, because previously the analytical tools were limited to thin layer chromatography (TLC), changes in SGDG levels were not compared to other lipid classes as we can do now using untargeted lipidomics, so the uniqueness of SGDGs across the entire lipidome was unappreciated. As a result, there have only been a few reports of SGDGs since the initial studies in the 1970s, and fundamental questions remain unanswered about these lipids and their tissue specificity, regulation, and role in biology.
To answer these questions, we developed the first synthesis of SGDG and produced a 13C-labeled form for quantitative isotope dilution MS29 (Supplementary Note and Supplementary Fig. 1). We developed a multiple reaction monitoring (MRM)-based MS method by selecting ion transitions corresponding to sulfate and the loss of either fatty acyl group. Using the sensitive targeted approach and the 13C-labeled SGDG as an internal standard, we quantified the absolute levels of 15 SGDGs in the brains of mice at different ages (Fig. 3a). Notably, almost all the fatty acyls of detected SGDGs are saturated or mono-unsaturated, even though polyunsaturated fatty acids are abundant in the brain.
Figure 3.
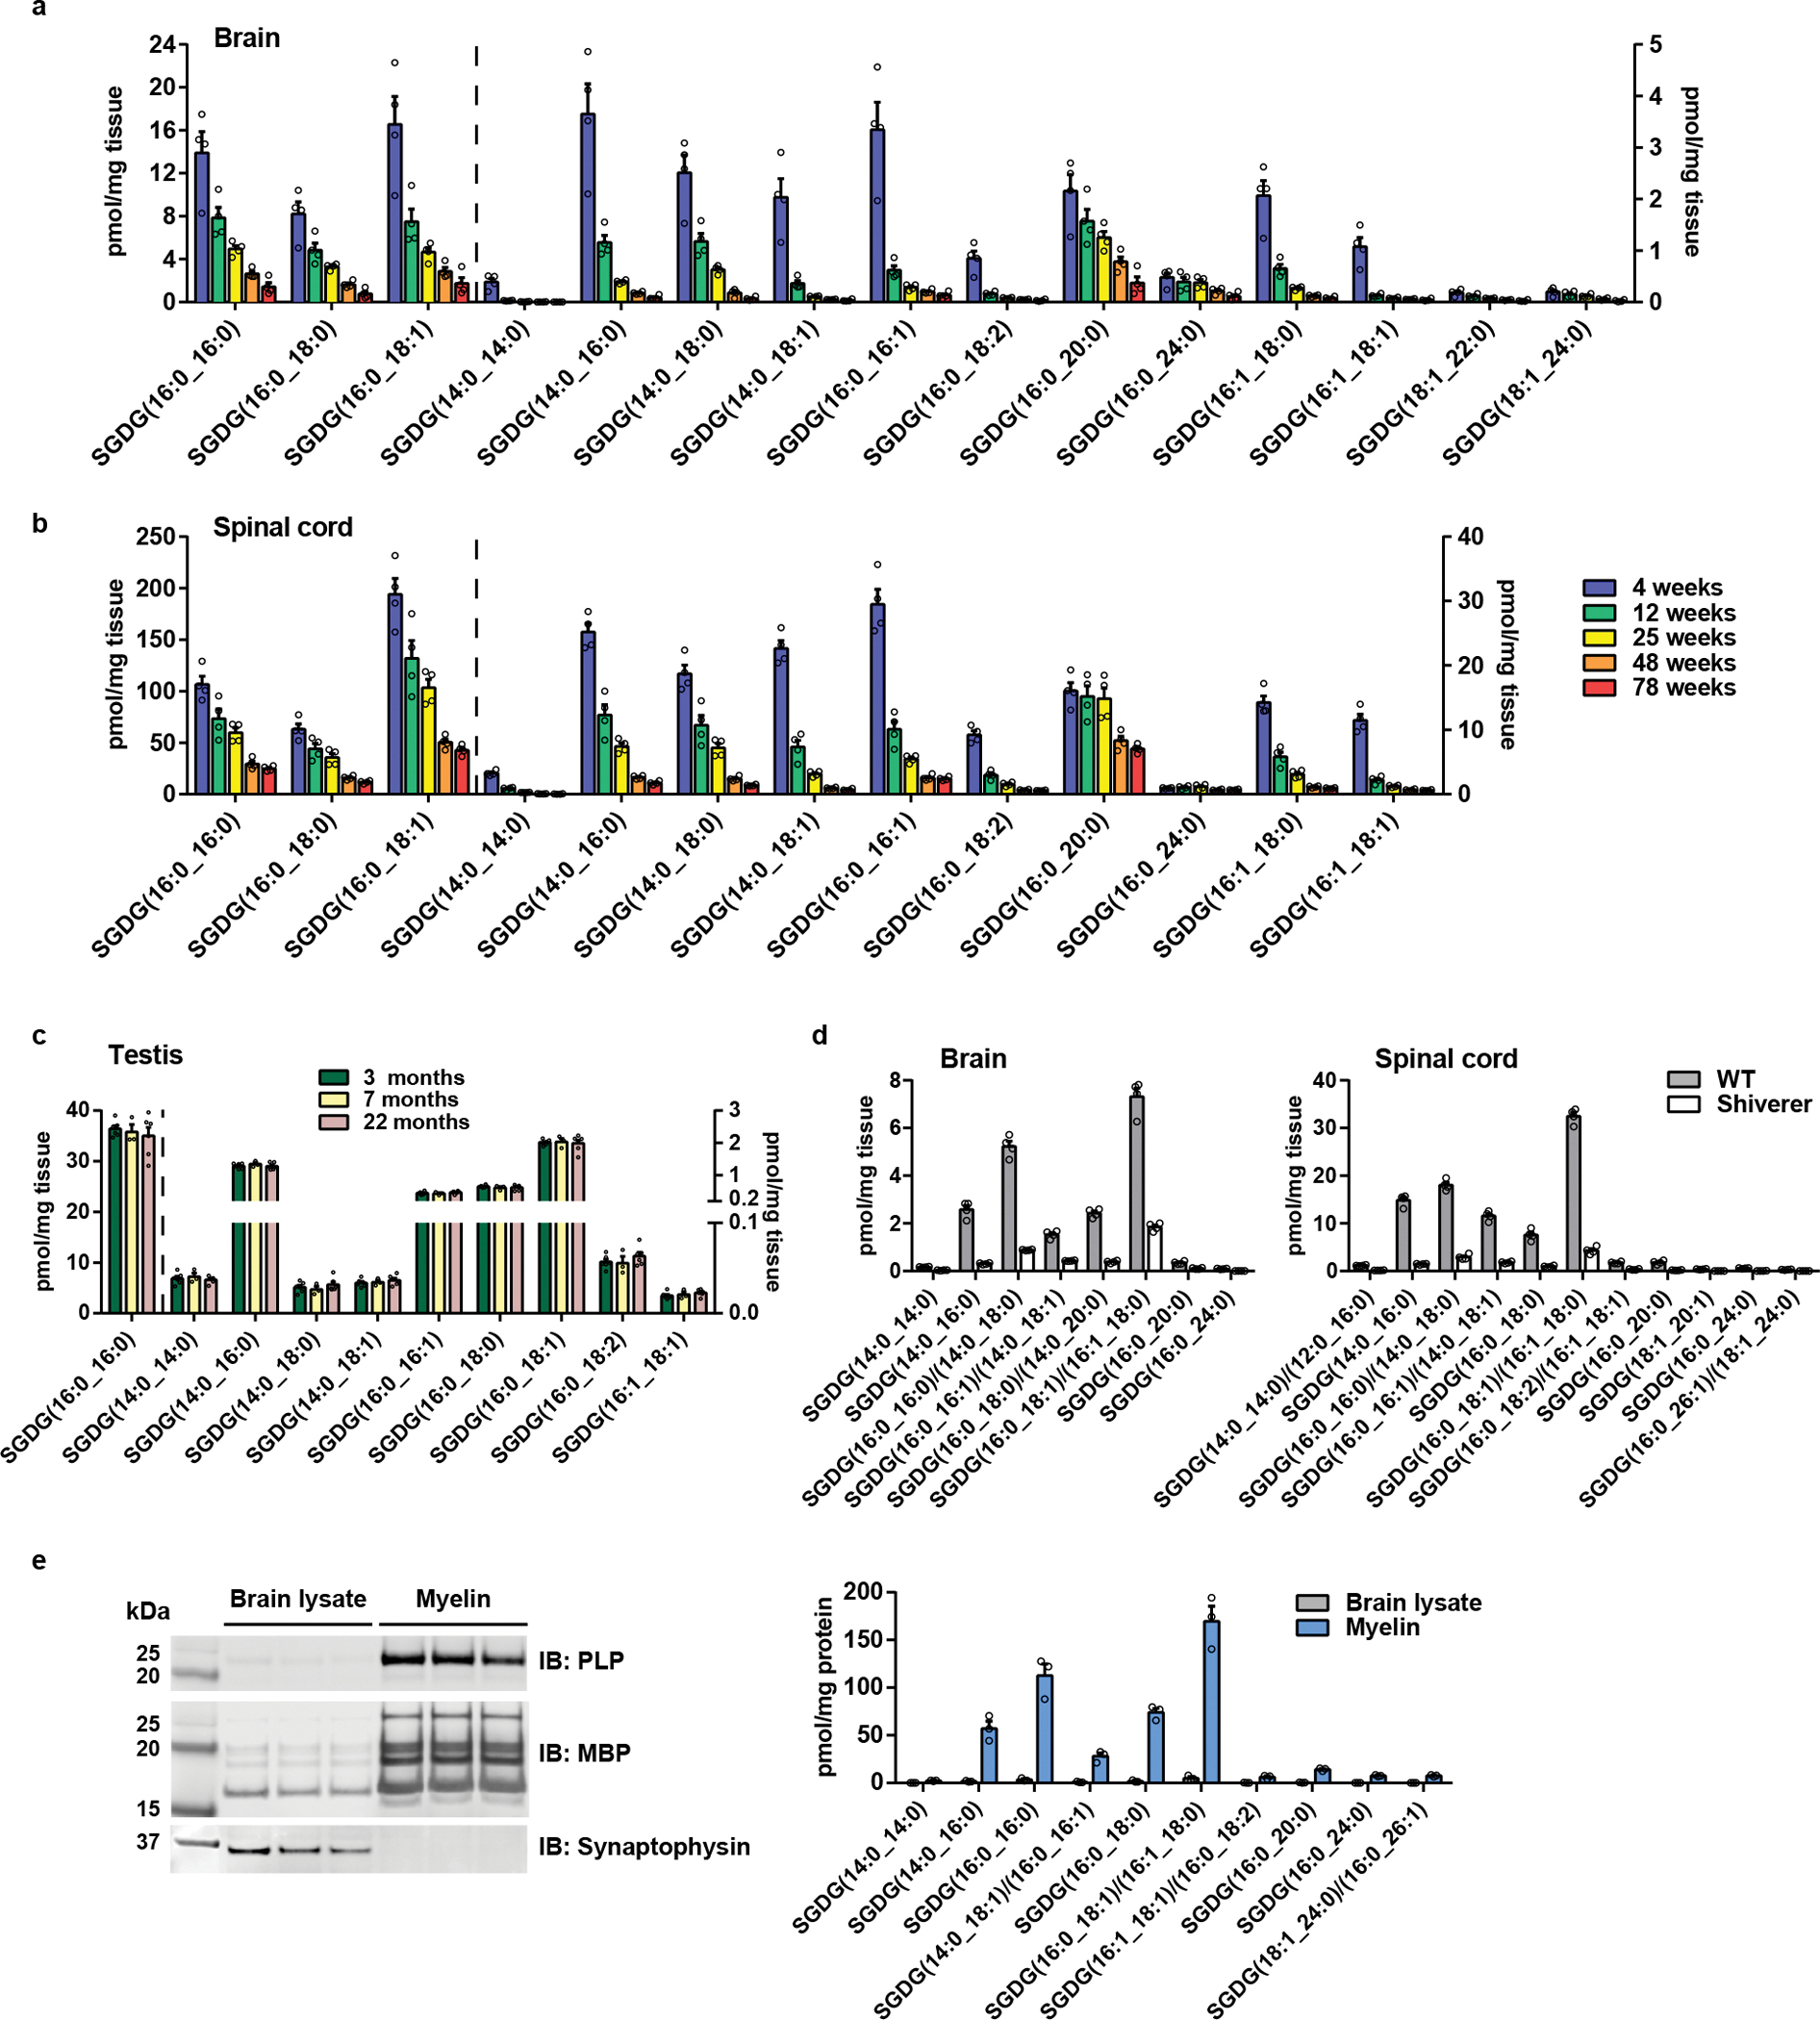
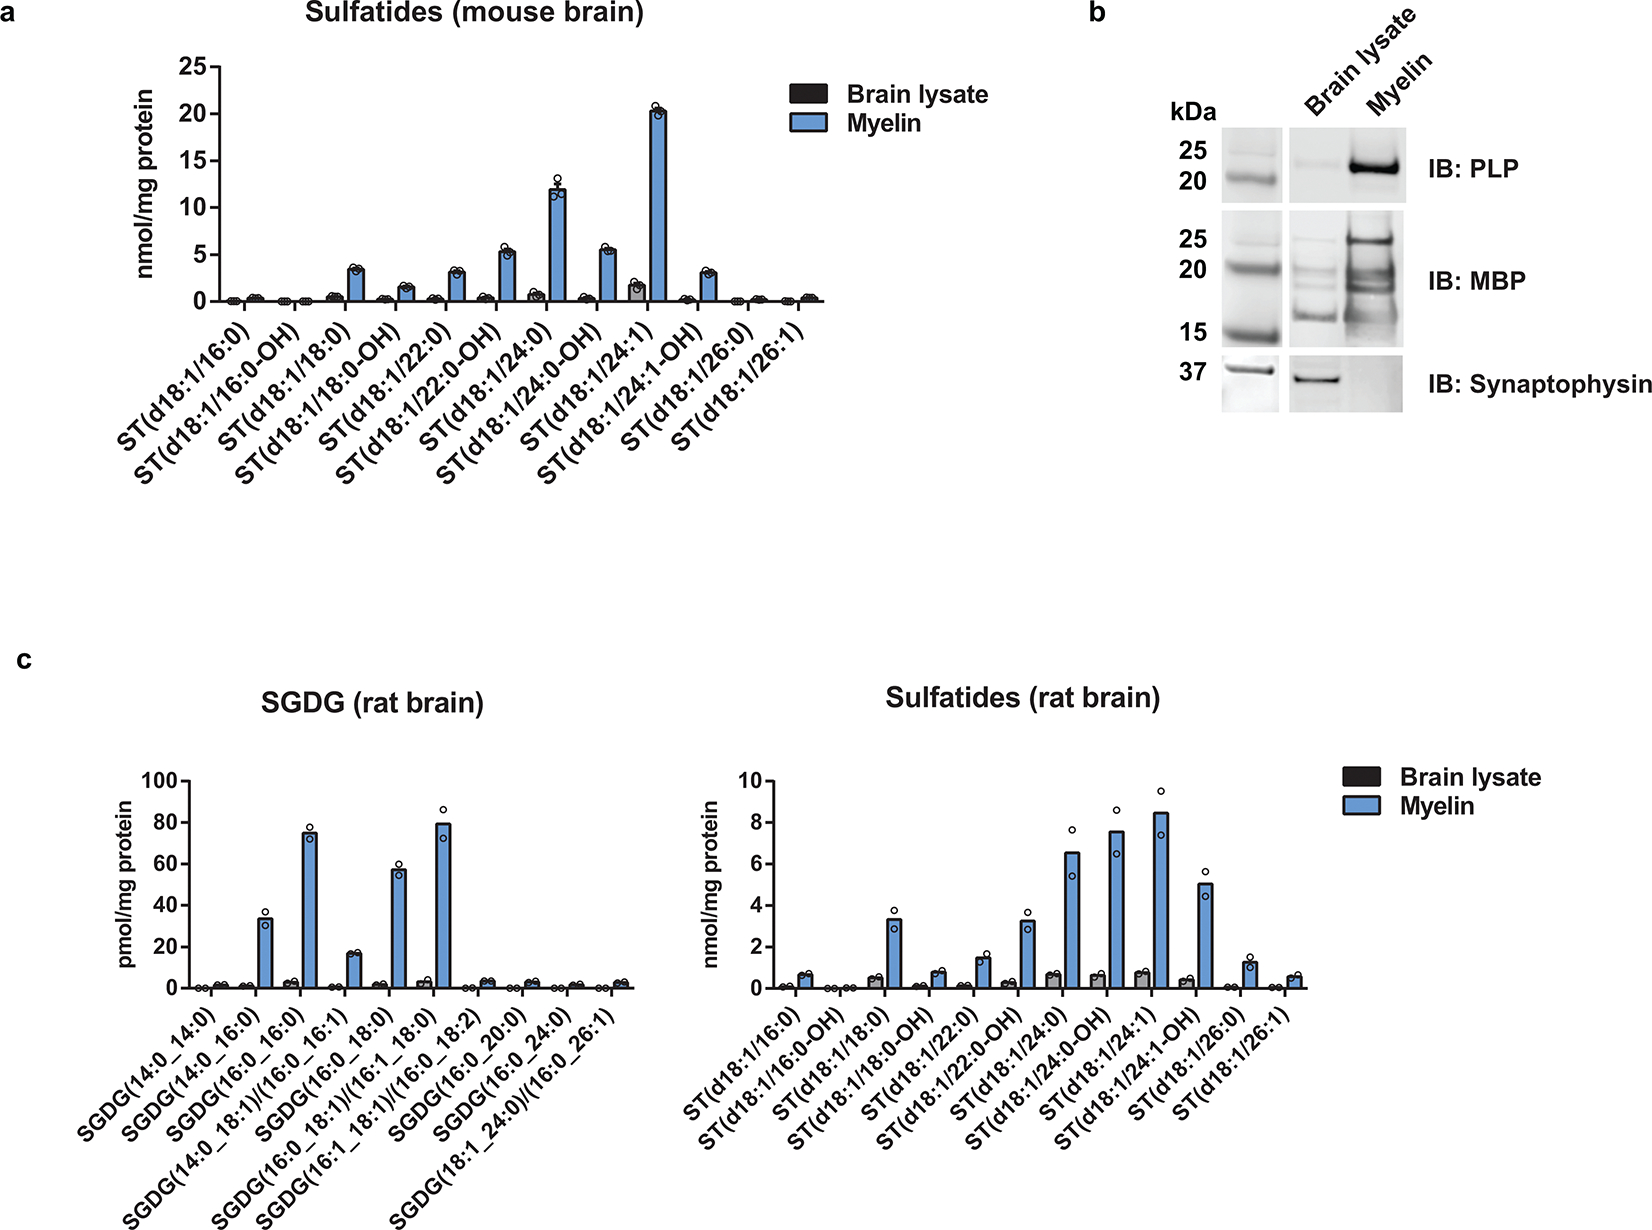
Quantification of SGDGs in mouse tissues. (a, b) Quantification of SGDGs in the brain (a) and spinal cord (b) of WT female mice at different ages. n = 4 mice/group. (c) Quantification of SGDGs in the testis of WT mice. Data were collected from six 3-month-old, three 7-month-old, and six 22-month-old male mice. (d) Quantification of SGDGs in the brain and spinal cord of shiverer mice. Sex, male; Age, 8–9 weeks. n = 4 mice/group. (e) Left panel, validation of myelin purification. Myelin proteins, PLP and MBP, are enriched in purified mouse brain myelin versus the brain lysate, whereas the abundant neuronal protein synaptophysin is depleted. Right panel, quantification of SGDGs in purified mouse brain myelin. n = 3 mice. Data in bar graphs are means ± SEM. In d and e, data were obtained using the untargeted method and ms1-based quantification.
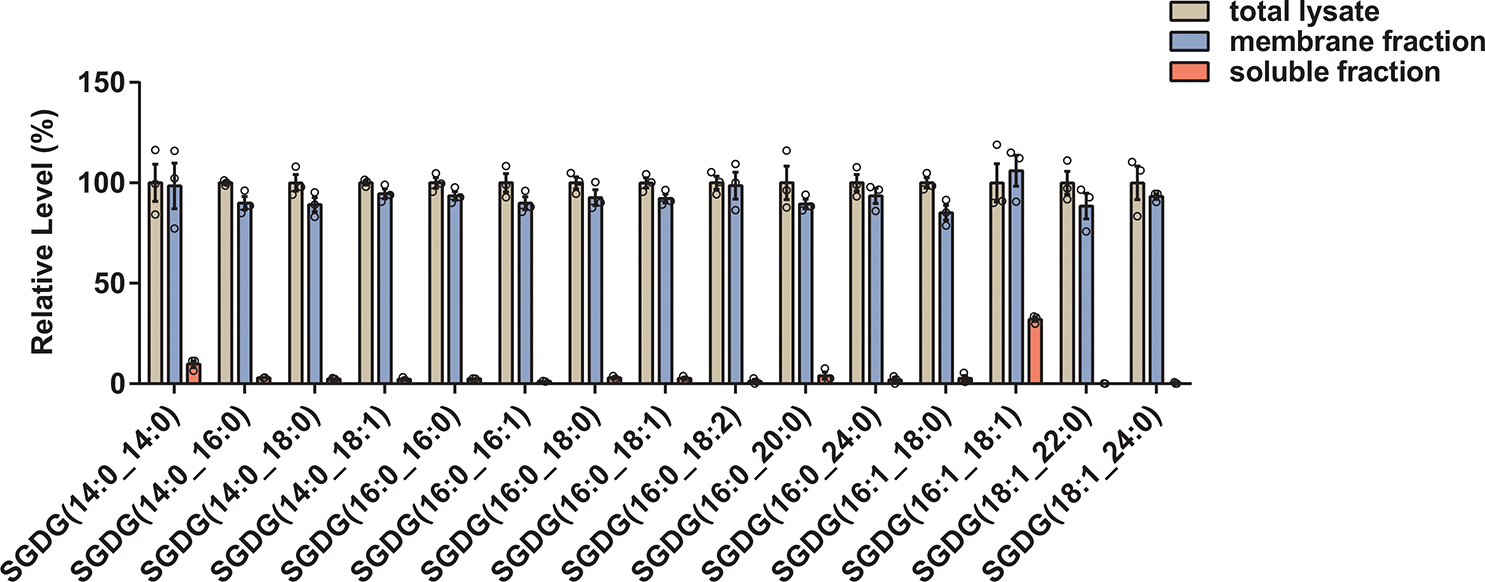
All the SGDG family members showed an inverse correlation with age (Fig. 3a). This is unique to the SGDG family and contrasts with ST and CerG1 which are remodeled with some decreasing and some increasing with age (Fig. 1 e, f and Supplementary Fig. 2). Since the global lipidomics was performed with female mice, we next verified SGDGs in male mice at the age of 3, 7, and 22 months. Male mice also exhibit the age-related decrease in SGDG levels (Supplementary Fig. 3), suggesting that this change is not sex-dependent. We then looked at 29-month-old mice, very old animals near the end of life30, and again observed SGDG decline compared with the 5-month-old mice (Supplementary Fig. 4). These data indicate that SGDGs are specific markers of brain aging, with a much more robust decrease associated with aging than any other lipid class we identified. As caloric restriction retards aging and extends lifespan, we measured SGDGs in the brain of calorie-restricted mice. Increased SGDG levels were observed in these mice (Extended Data Fig. 3), further strengthening the negative correlation between SGDG levels and aging. When we examined SGDG expression during mouse brain development, we found that low levels of SGDGs were detected at embryonic day 15, followed by an increase throughout further development, with the highest levels appearing on postnatal day 20 (Supplementary Fig. 5). By fractioning mouse brain lysate into the membrane and soluble fractions, we demonstrated that SGDGs are membrane-associated lipids (Extended Data Fig. 4).
Among serum and 13 tissues examined (brain, spinal cord, testis, ovary, adipose tissue, gut, kidney, liver, pancreas, spleen, lung, heart, muscle), we detected SGDGs in the brain, spinal cord, and testis. SGDG levels in the spinal cord are about 10-fold higher than in the brain and steadily decrease as mice age (Fig. 3b and Supplementary Fig. 3). However, SGDG levels did not change in the testis with aging (Fig. 3c). Similarly, sulfogalactosyl alkylacylglycerol (SGAAG) levels decreased in the brain and spinal cord but were not affected by aging in the testis where they are most abundant31 (Extended Data Fig. 5). These results suggest that the metabolic regulation of SGDGs and SGAAGs is tissue-specific.
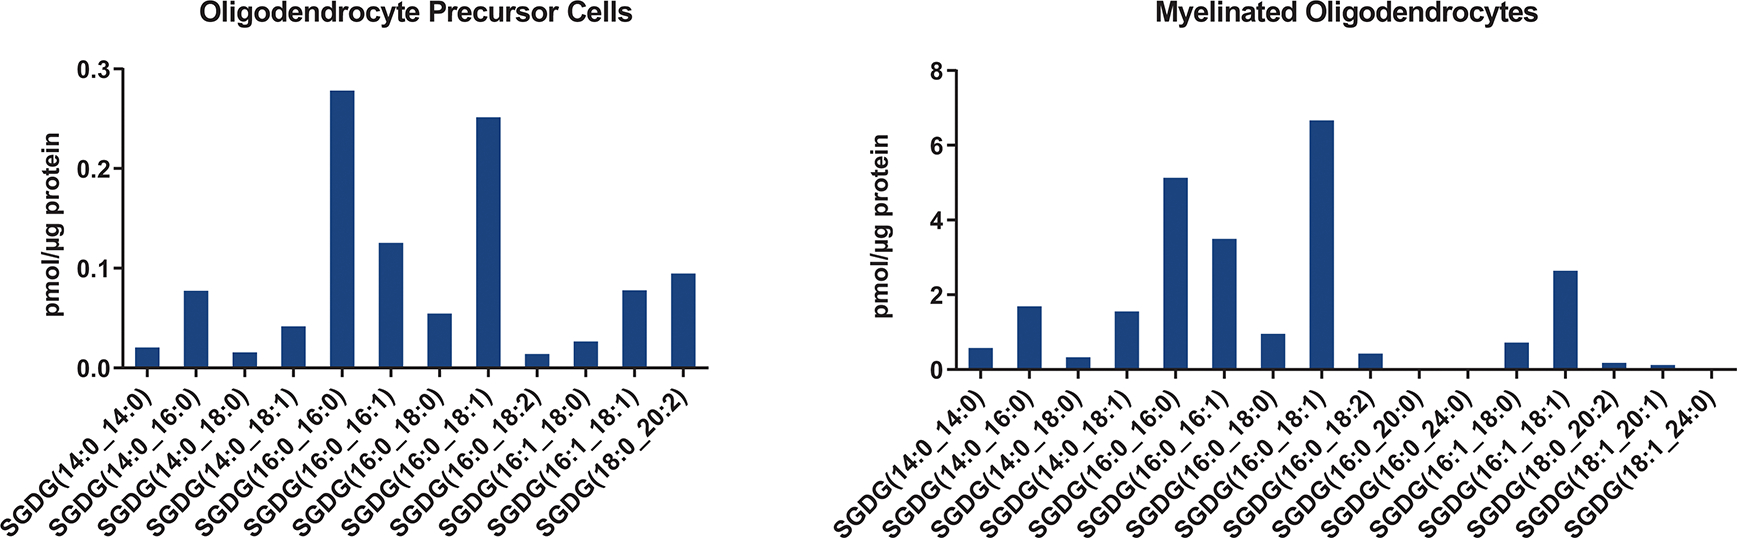
SGDG biosynthesis was linked to myelin in rat32, but this relationship was not rigorously tested. Here, we investigated whether myelin regulates SGDG levels by analyzing shiverer mice, which carry a mutation in the myelin basic protein (Mbp) gene resulting in a severe myelin deficiency throughout the CNS33. SGDG and SGAAG levels are greatly reduced in the brain and spinal cord of these mice similar to the myelin lipid ST (Fig. 3d and Supplementary Fig. 6). MGDGs are also dramatically reduced in the shiverer mice, cementing the link between the MGDG/SGDG pathway and myelin26, 34 (Supplementary Fig. 6). We next isolated myelin fractions from mouse or rat brains which were validated by the enrichment of myelin proteins (PLP and MBP) and the depletion of neuronal protein (synaptophysin)35, 36. SGDGs are highly enriched in myelin and are about ten times more abundant than STs (Fig. 3e and Extended Data Fig. 6). Moreover, SGDGs were detected in isolated oligodendrocyte precursor cells (OPCs) and mature myelinated oligodendrocytes with higher levels in the latter (Extended Data Fig. 7). These results suggest that SGDGs are structural components of myelin.
SGDGs are present in humans and non-human primates
To assess the potential relevance of SGDGs in other species, we asked whether SGDGs are present in human. A previous study analyzed SGDG in human brain but did not detect it27. Transitioning from rodent brains where the entire brain can be examined to the larger human brains where only a fraction of the total is analyzed raises the possibility of missing key brain regions containing the highest concentration of the lipid. In addition, while critical, certain lipids might only be induced under certain conditions or temporally regulated during development so that they could be missed. However, the excellent sensitivity of the targeted LC-MS method provides the best chance to observe SGDGs.
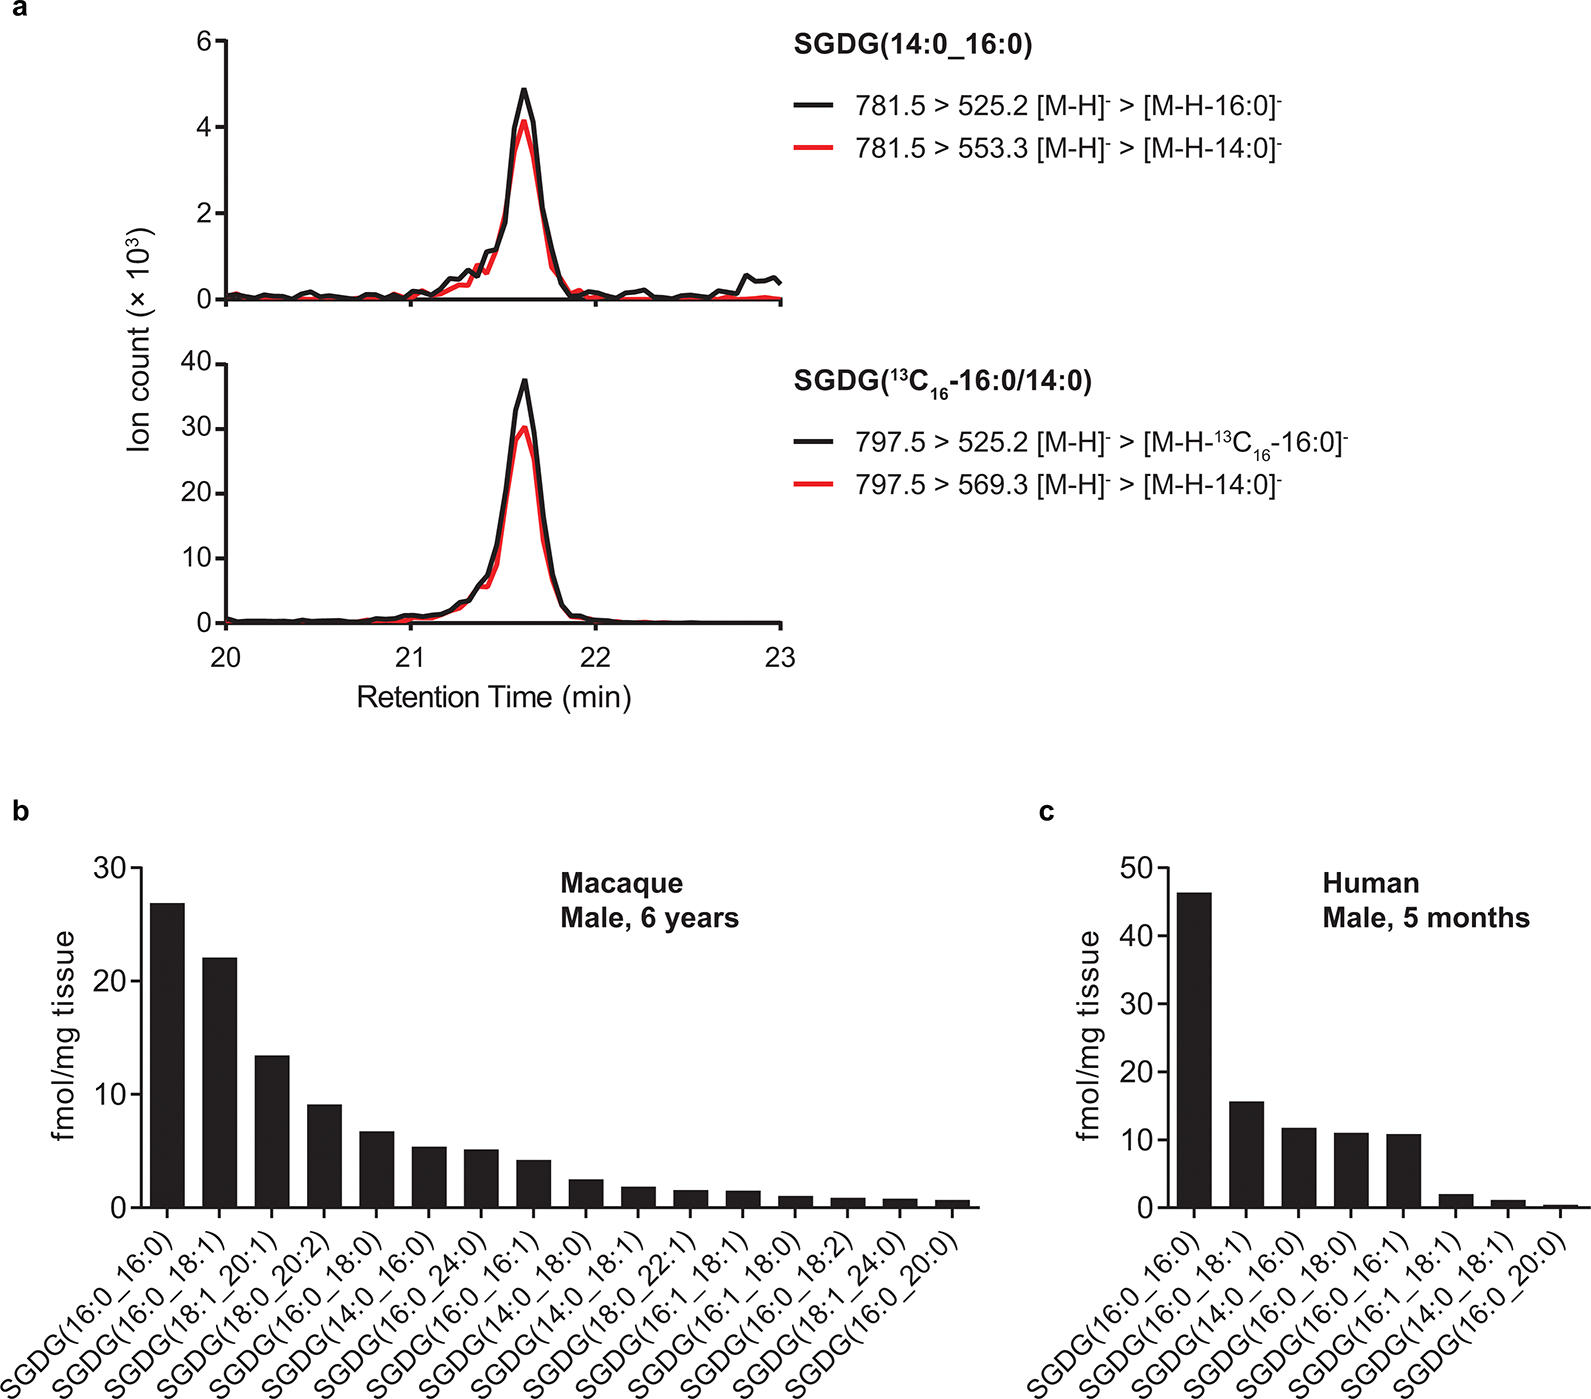
Initially, we observed a weak SGDG signal when analyzing crude lipid extract from human hippocampus by LC-MS. This validated SGDGs as being present in human brain but the levels were too low to quantify accurately.s Because SGDG levels in the human brain regions analyzed might be so low as to be masked by other interfering lipids, we developed a solid-phase extraction (SPE) method to enrich SGDGs from the crude lipid extract with a silica column. A heavy-labeled SGDG standard was spiked in the samples during lipid extraction as a control. We detected SGDGs from the frontal lobe of a 5-month-old human subject after SPE enrichment. The high-resolution MS/MS spectrum of the endogenous SGDG is in good agreement with that of the 13C-labeled SGDG (Fig. 4). We also detected SGDGs in the parietal cortex of a 6-year-old male macaque using SPE (Extended Data Fig. 8a). Human and macaque SGDGs are at the femtomole level per mg of tissue, lower than mouse SGDGs (Extended Data Fig. 8b, c).
Figure 4.

SGDGs are present in human. Alignment of MS/MS spectra of SGDG(14:0_16:0) from human brain and the heavy-labeled internal standard SGDG(13C16-16:0/14:0). The brain tissue was collected from the frontal lobe of a male subject at 5 months of age. The 13C-labeled carbons of the standard are indicated by asterisks.
Ex vivo biochemical processing of SGDG generates lyso-SGDG
In the testis, SGAAG is synthesized by sequential reactions catalyzed by ceramide galactosyltransferase (CGT) that transfers galactose to the lipid backbone, and cerebroside sulfotransferase (CST) that transfers sulfate to the galactose group of glycolipids. The degradation of SGAAG starts with the desulfation reaction catalyzed by arylsulfatase A (ASA). The same set of enzymes is responsible for the synthesis and degradation of ST, the major sulfoglycolipid in the brain37, 38. We found that SGDGs and SGAAGs decrease in the CNS but not in the testis with aging (Fig. 3a–c and Extended Data Fig. 5). Since most STs accumulate rather than decrease with age in the brain (Supplementary Fig. 2), we hypothesized that a different metabolic pathway regulates SGDGs and SGAAGs in the CNS.
In vitro studies showed that SGDG is synthesized by sulfation of MGDG in rat brain26, 34. The developmental pattern of MGDG sulfotransferase activity in rat brain is similar to that of CST activity, suggesting that in the brain SGDG is presumably synthesized by the same enzyme (CST) as ST32, 39, 40. Monohexosyl alkylacylglycerol has been reported in mouse brain recently41. On the other hand, the degradation pathway of SGDG and SGAAG in the brain is unknown. The differential regulation of SGDG and ST suggests that there must be differences in the catabolism of these lipids if their biosynthesis pathways are the same. To test this, we incubated SGDG(14:0/16:0) with mouse brain lysate and examined potential degradation products by LC-MS. We observed acyl chain hydrolysis from SGDG(14:0/16:0), resulting in lyso-SGDG(14:0) and lyso-SGDG(16:0) (Fig. 5a). In contrast, we did not detect any signal from MGDG, which would be expected if ASA processes this lipid, establishing a different catabolic pathway between SGDG and ST.
Figure 5.
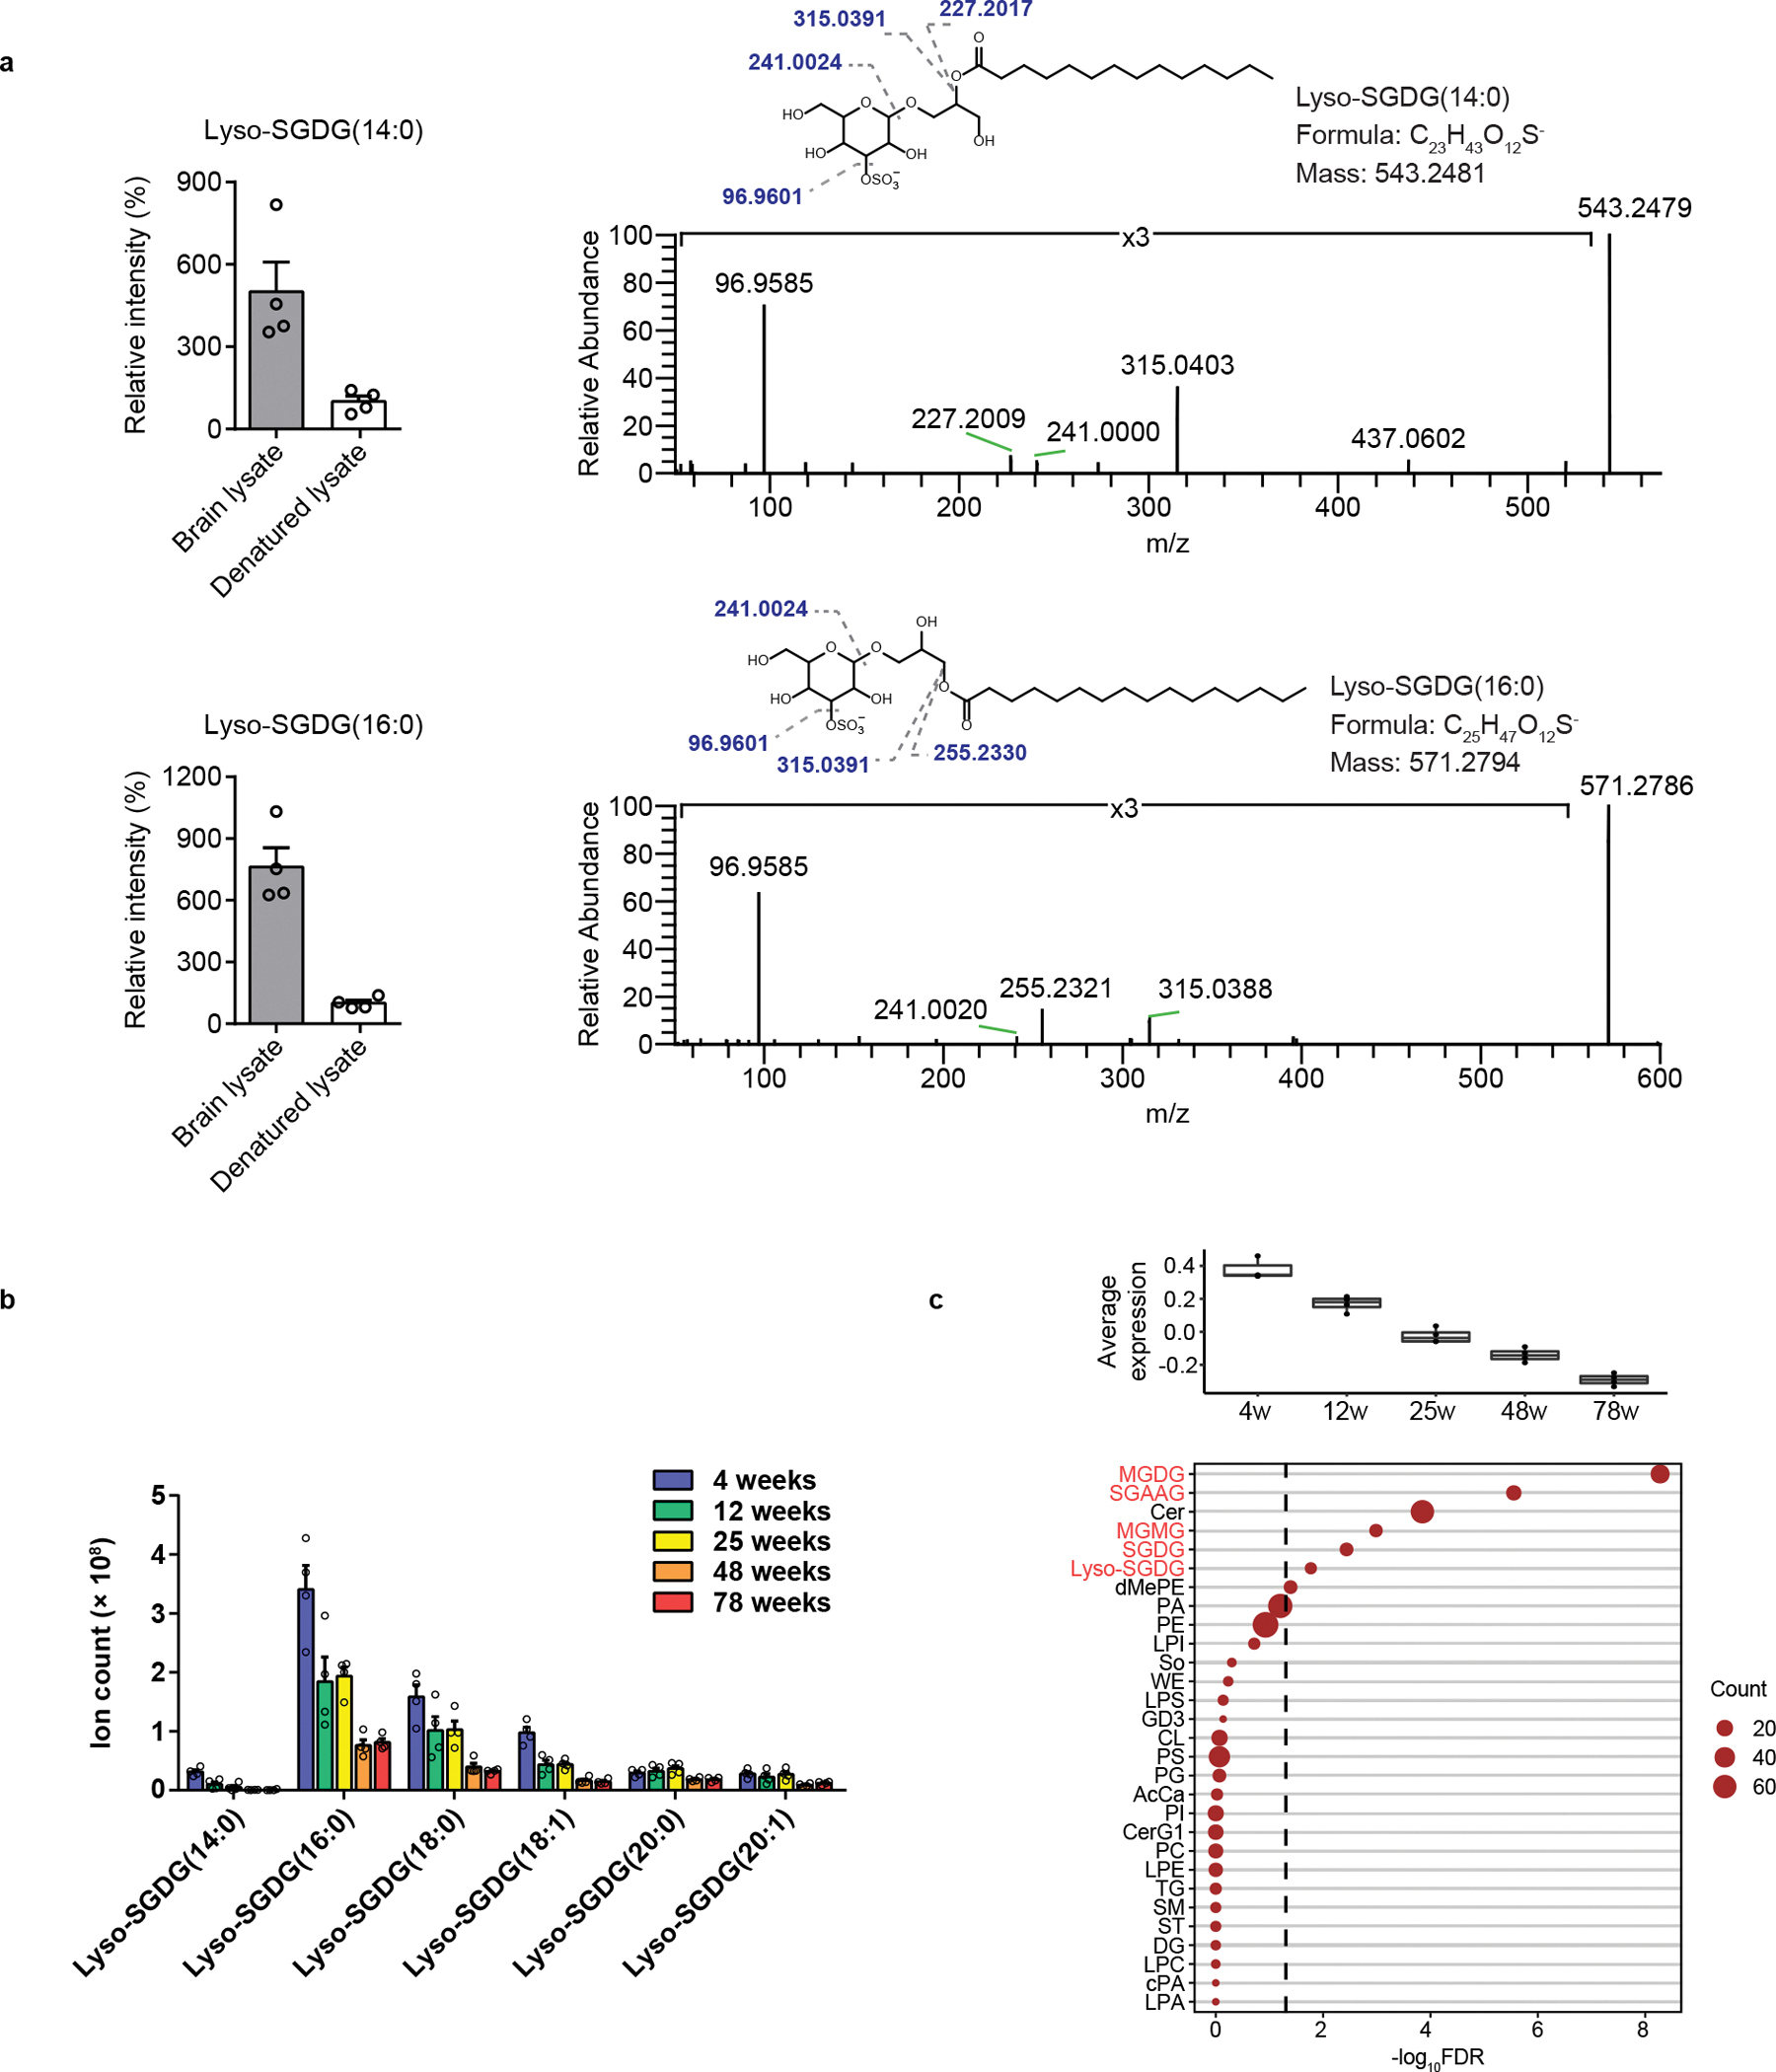
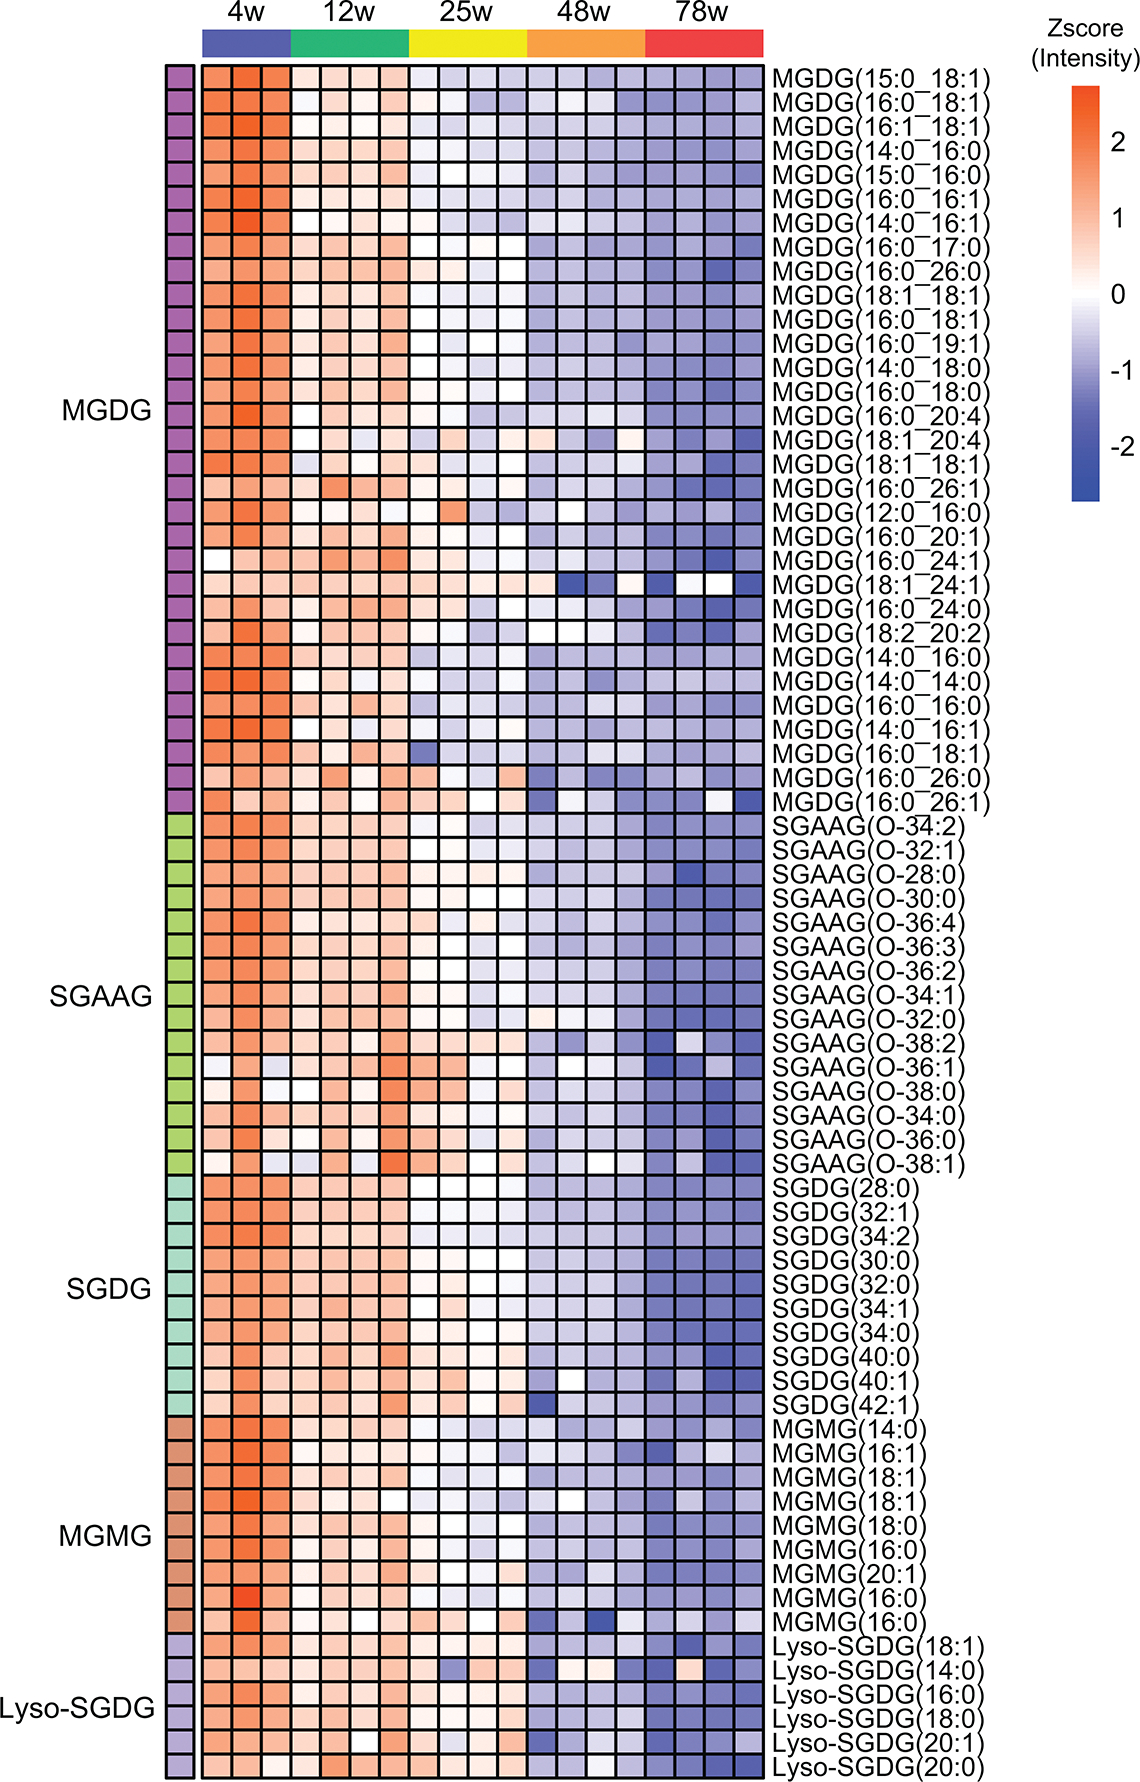
Lyso-SGDGs are the potential degradation products of SGDGs in the brain. (a) lyso-SGDG(14:0) and lyso-SGDG(16:0) were produced after incubating 100 μM of SGDG(14:0/16:0) with mouse brain lysate at 37 °C for 30 min. As a negative control, SGDG(14:0/16:0) was incubated with heat-denatured brain lysate. The left panel shows lyso-SGDG levels relative to the control. n = 4 replicates, data are means ± SEM. The right panels show MS/MS spectra of lyso-SGDGs at HCD 30 V. (b) Quantification of lyso-SGDGs in the spinal cord of WT female mice. n = 4 mice/group, data are means ± SEM. (c) Average levels of the co-expressed lipids (top panel) and the enrichment analysis of lipid classes (bottom panel) in the spinal cord module which shows progressive decrease during aging. SGDG and SGDG-related lipids are shown in red.
Lyso-SGDGs and SGDGs are co-expressed in the spinal cord
We next investigated whether lyso-SGDG levels change with aging by revisiting our untargeted lipidomics datasets. Since lyso-SGDGs are a new lipid class not included in any lipid databases, we manually annotated them based on the MS1 and MS2 spectra. Lyso-SGDG(18:0) was the only lyso-SGDG detected in the brains of the 4-week-old mice and not in the older mice. By contrast, we identified a series of lyso-SGDGs in the spinal cord with much higher intensity, consistent with our observation that SGDGs are 10 times more abundant in the spinal cord than in the brain (Fig. 3a, b). Lyso-SGDGs also continuously decrease with aging (Fig. 5b). The co-expression of lyso-SGDGs and SGDGs in the spinal cord prompted us to construct the co-expression network using the spinal cord lipidomics dataset. Similar to the black module found in the brain network, we identified a module that progressively decreased in the spinal cord with aging (Fig. 5c). It is enriched for MGDG, SGAAG, MGMG, SGDG, and lyso-SGDG, suggesting that they are co-regulated and involved in the same pathway with aging (Fig. 5c and Extended Data Fig. 9).
SGDG exerts anti-inflammatory effects via the NF-κB pathway
Gene expression analysis revealed that the inflammatory response is a major upregulated category in aged mice42. Given the strong correlation between SGDG levels and aging, we asked whether SGDG affects inflammation.
To test this, we induced an inflammatory response in RAW 264.7 macrophage cells by treating them with lipopolysaccharide (LPS), an outer membrane component of Gram-negative bacteria that activates toll-like receptors and stimulates the innate immune response. LPS treatment markedly increased the secretion of pro-inflammatory cytokines IL-6 and TNF-α into the media. This was inhibited by co-treatment of the cells with dexamethasone, a potent anti-inflammatory compound. Notably, co-treatment of the cells with SGDG(14:0/16:0) also substantially decreased the LPS-induced secretion of IL-6 and TNF-α (Fig. 6a). MGDG(14:0/16:0), tested as a negative control, did not inhibit cytokine secretion (Fig. 6a). SGDG(14:0/16:0) suppressed LPS-induced IL-6 secretion in a dose-dependent manner with an IC50 of 0.927 μM (Supplementary Fig. 7).
Figure 6.

SGDG exhibits anti-Inflammatory effects via the NF-κB pathway. (a) RAW 264.7 cells were incubated with media alone, 100 ng/mL of LPS, or co-treated with 100 ng/mL of LPS and 5 μM of SGDG(14:0/16:0), MGDG(14:0/16:0), or dexamethasone (Dex) for 24 hours. n = 4 replicates. P values were 0, 8.26e-06, 0, 0, 0, 0.00029, 0, 0 (left to right). (b) BMDMs were incubated with media alone, 100 ng/mL of LPS, or co-treated with 100 ng/mL of LPS and indicated concentrations of SGDG(14:0/16:0), MGDG(14:0/16:0), or Dex for 24 hours. n = 3 replicates. P values were 0, 0.52182, 3.11e-11, 0.01466, 0.00002, 3.45e-11, 5.60e-14, 0.75155, 1.30e-6, 0.02537, 0.00078, 9.20e-6 (left to right). In a and b, IL-6 and TNF-α levels in the media were measured by ELISA and normalized to cell viability determined by MTT assay. (c) BMDMs were incubated with media alone, 100 ng/mL of LPS, or co-treated with 100 ng/mL of LPS and 5 μM of SGDG(14:0/16:0) for 4 hours. mRNA levels were determined by RT-PCR. n = 4 replicates. P values were 2.24e-7, 9.62e-6, 4.54e-9, 8.60e-8, 2.84e-6, 0.00004, 0.00023, 0.02761, 7.85e-10, 0.00002, 2.86e-6, 0.00007, 2.62e-9, 0.00037 (left to right, top to bottom). (d) NF-κB-dependent luciferase activity in HEK293T cells transfected with TLR4 and MD-2 and treated with media alone, 100 ng/mL of LPS, or co-treated with 100 ng/mL of LPS and indicated concentrations of SGDG(14:0/16:0) or MGDG(14:0/16:0) for 6 hours. n = 3 replicates. P values were 9.43e-6, 0.94641, 0.23496, 0.00366 (left to right). In a, b, c, d, data are means ± SEM. *P < 0.05 versus LPS. Statistical significance was calculated using one-way ANOVA followed by post hoc Dunnett’s test to correct for multiple comparisons.
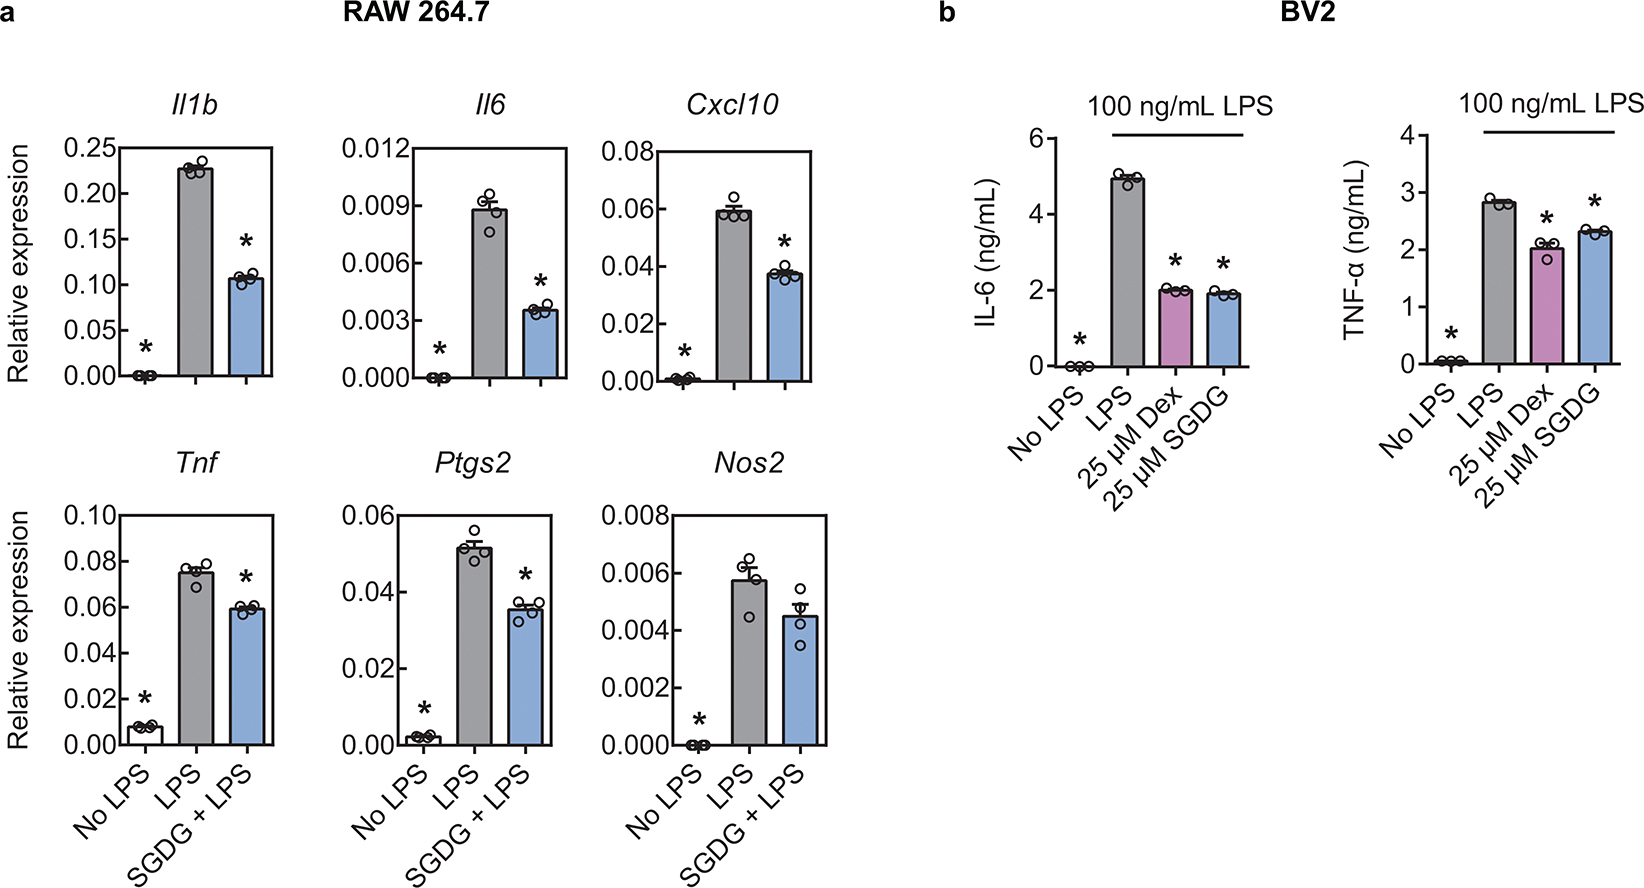
We next validated the anti-inflammatory effects of SGDG in primary bone marrow-derived macrophages (BMDMs). SGDG(14:0/16:0) suppressed the secretion of IL-6 and TNF-α from BMDMs in a dose-dependent manner (Fig. 6b). Furthermore, besides affecting cytokine protein levels, SGDG(14:0/16:0) significantly reduced the expression of LPS-induced genes at the mRNA level, including the pro-inflammatory cytokine genes (Il1b, Il6, Tnf, Il12a, Cxcl10), Ptgs2 that encodes a rate-limiting enzyme in prostaglandin biosynthesis, and Nos2 that encodes nitric oxide synthase (Fig. 6c). We also observed inhibition of LPS-induced gene expression by SGDG(14:0/16:0) in RAW 264.7 cells (Extended Data Fig. 10a). Since SGDGs are specifically expressed in CNS and microglia are the resident macrophages of CNS, we next validated the activity of SGDG(14:0/16:0) in the BV2 microglial cell line. Treatment of BV2 cells with SGDG(14:0/16:0) suppressed the release of IL-6 and TNF-α to a similar degree as dexamethasone (Extended Data Fig. 10b).
To investigate the mechanism underlying the anti-inflammatory effects of SGDGs, we tested the NF-κB pathway because it is critical for the LPS-induced expression of pro-inflammatory cytokines. Treatment of HEK293T cells expressing TLR4 and MD2 with SGDG(14:0/16:0) significantly reduced the NF-κB reporter activity while MGDG(14:0/16:0) did not (Fig. 6d), suggesting that SGDG exerts the anti-inflammatory effects via the TLR4/MD2 mediated NF-κB pathway.
DISCUSSION
Using lipidomics to identify and quantify lipids has led to many new insights. However, advances in lipidomics technology have led to the detection of tens of thousands of data points per experiment, requiring more advanced data analysis methods to find changes with biological significance. Here, combining untargeted lipidomics of the aging mouse nervous system with co-expression network analysis demonstrates the power of systems-level data analysis to reveal unique lipidomic changes in complex datasets. When SGDGs were first identified in rat brain four decades ago, their importance was under-appreciated because their unique expression profile during CNS aging had not been discovered. There were few follow-up studies on SGDGs and these lipids were essentially forgotten as they were overlooked in lipid databases. By identifying the ions corresponding to SGDGs as significant in the CNS lipidome, our data analysis demonstrates for the first time that SGDGs are a class of aging-related lipids and distinguishes SGDGs from hundreds of other lipids. Therefore, our findings elevate the importance of SGDGs and the entire SGDG pathway in CNS aging.
Most lipidomics workflows rely on the structural identification of ions using lipid databases. However, most ions remain unidentified using this approach16, revealing a knowledge gap that can mask important discoveries. Our unbiased systems-level analysis led us to a group of aging-related ions, but the standard lipidomics workflow did not identify them. Therefore, we used tandem MS to identify the major components of the lipids and then used chemical synthesis and co-elution by LC-MS to validate these ions as SGDGs. The original identification of SGDG from rat brains was a tour de force that used radioactive labeling, chemical degradation, gas chromatography, and co-elution by TLC26. However, the limited resolution of TLC cannot account for minor structural differences. Therefore, we designed an efficient method of SGDG synthesis and developed LC-MS separation conditions to validate the endogenous lipid as a 3-SGDG.
Importantly, these lipids were also detected in the human and macaque brain, providing the first evidence of the existence of SGDGs in human and non-human primates. SGDG levels in human brains are much lower than those in mouse brains. Multiple factors could contribute to the low levels, such as differences in brain structures—human brains are gyrencephalic (folded) whereas rodent brains are lissencephalic (smooth)—and different amounts of white matter to gray matter between species. Since we cannot profile the entire human/macaque brain as we can with the mouse brain, these lipids may be enriched in a region of the human/macaque brain that was not analyzed. As SGDGs are associated with myelination, it would be interesting to examine myelin-rich areas such as brainstem and spinal cord in humans or macaques. Lastly, human and macaque SGDGs might have acyl chain distributions that differ from mice leading to the most abundant SGDGs being missed. Additional studies looking at more brain samples and across a broader set of acyl chain possibilities might resolve these issues.
An added advantage of integrating chemical synthesis into lipidomics studies is the ability to generate sufficient quantities of lipid for biological testing. Bioactive lipids modulate diverse cellular processes and phenotypes such as cell growth, senescence, and inflammation43–45. Aging is characterized by chronic, low-grade inflammation and excessive inflammatory stimulation and insufficient anti-inflammatory responses contribute to aging and age-related pathologies46, 47. In the aged brain there is increased production of pro-inflammatory cytokines such as IL-6 and TNF-α and decreased production of anti-inflammatory cytokines such as IL-1048, 49. Therefore, we tested an SGDG in inflammatory assays and demonstrated its potent anti-inflammatory effects via the TLR4/MD2 mediated NF-κB pathway. Although we validated the activity in BMDMs and two cell lines, verification in primary microglia will be an important next step in confirming how SGDGs act in the aging brain. As membrane-associated lipids, SGDGs may exert their effects by interacting with TLR4 through direct or indirect mechanisms, such as changing membrane fluidity, remodeling lipid raft, or functioning via lyso-SGDGs. Alternative pathways, including other toll-like receptors, might also be involved.
Our results strongly support the link between SGDGs and myelination. With SGDGs detected in OPCs and myelinated oligodendrocytes, we cannot exclude the possibility that SGDGs are present in other cell types in the CNS. Further studies are required to clarify the cell-type specificity of SGDGs. Also, the longitudinal decrease in SGDGs does not mean myelin decreases with aging. CerG1 and ST, the established myelin lipids, are largely increased (Fig. 1 e, f and Supplementary Fig. 2), suggesting myelin undergoes remodeling with aging. Although myelin sheaths exhibit degenerative changes, myelin formation continues with aging50. Therefore, we believe that changes in SGDG levels with aging are due to changes in metabolism that are not necessarily linked to myelin levels.
Though STs and SGDGs contain 3-sulfogalatosyl glycan, their differential regulation with aging suggests they have alternative metabolic pathways. While the primary catabolic step for STs is the desulfation by ASA, our data suggests that SGDGs are primarily broken down by lipolysis of their acyl chains to generate lyso-SGDGs. Lipidomics data analysis revealed that lyso-SGDGs also decrease with aging, establishing the entire SGDG pathway—including MGDGs, lyso-SGDGs, SGAAGs, and MGMGs—as aging-related lipids. The eventual identification of the enzymes that regulate this pathway will be necessary to perturb endogenous SGDG levels and test the impact of these lipids on nervous system structure and function.
To our knowledge, this is the first study showing that a class of aging-related CNS lipids exerts anti-inflammatory effects. Our findings suggest that the progressive loss of SGDGs with age contributes to neuroinflammation in the aged brain, eventually leading to pathological changes associated with aging. Future studies are required to determine whether administering SGDGs can inhibit neuroinflammation in vivo and further mechanisms by which SGDGs inhibit the production of pro-inflammatory cytokines. These studies will provide insights into developing new therapeutics to treat inflammation and age-related diseases.
METHODS
Materials
Solvents for LC–MS analysis were purchased from Honeywell Burdick & Jackson. Mouse IL-6 and TNF-α ELISA MAX Deluxe sets were purchased from BioLegend. LPS from Escherichia coli O111:B4 and the RAW 264.7 cell line were purchased from Sigma-Aldrich. Dexamethasone was purchased from Cayman Chemical. BV2 cell line was purchased from Elabscience. Low glucose DMEM was purchased from Thermo Fisher Scientific.
Animals
C57BL/6J female mice at 4, 12, 25, 48, and 78 weeks of age were obtained from the Jackson Laboratory and maintained on chow diet (RD, PicoLab 5053 Lab Diet) until they were sacrificed for tissue collection. C57BL/6J male mice at 3, 7, and 22 months of age were bred in-house and maintained on chow diet until they were sacrificed for tissue collection. All mice were maintained on a 12 h light and dark cycle. All procedures involving mice were approved by the Institutional Animal Care and Use Committee (IACUC) of the Salk Institute for Biological Studies.
Four C57BL/6J female mice at 29 months of age, and two male mice at 29 months of age were bred in-house. Four C57BL/6J female mice at 5 months of age and three male mice at 5 months of age were obtained from the Jackson Laboratory. Whole brains and cephalic spinal cords (5 cm) were harvested from these mice following euthanasia by CO2 asphyxiation. All mice were housed on a 12 h light and dark cycle and maintained on normal chow diet (RD, PicoLab 5053 Lab Diet) until they were sacrificed for tissue collection. All procedures involving mice were approved by the Animal Care and Use Committee (ACUC) of the University of California, Berkeley.
For the calorie restriction experiment, C57BL/6J mice were kept in 12 h light and dark conditions, with ad libitum access to water and food (unless otherwise stipulated) until euthanasia. Calorie restriction was performed according to National Institute of Aging (NIA)51. NIH31/NIA-Fortified chow diet was initiated when animals were 14 weeks old. The diet started with a one-week 10% reduction in food intake (relative to ad libitum average consumption), 25% reduction in the second week, and a 40% reduction in the third week until the end of the experiment (3 months). Diet from the calorie restriction group was supplemented with 40% more vitamins to prevent malnourishment.
Animal and Human Tissues
Embryonic and postnatal whole mouse brains were purchased from Hilltop Lab Animals. Whole brains and spinal cord of shiverer mice were purchased from the Jackson Laboratory. Whole rat brains were purchased from BioChemed Services. The frontal brain tissue collected postmortem from a 5-month-old male subject was obtained from Cooperative Human Tissue Network Western Division. The parietal cortex tissue of a 6-year-old male macaque (biopsies) was obtained from Oregon National Primate Research Center.
Syntheses of SGDG Standards
For the detailed syntheses of SGDG standards and associated characterization spectra see the Synthesis Section inSupplementary Note.
Lipid Nomenclature
Synthetic standards are annotated as the lipid class followed by the fatty acyl chains in a sequence reflecting their sn positions linked to the lipid backbone which are separated by a slash (/). When the sn position of fatty acids cannot be determined for MS-detected lipids, the fatty acyl chains are separated by an underscore symbol (_).52
Lipid Extraction
Lipids were extracted from tissues using the Bligh and Dyer method53. Tissues were homogenized in 1:1 PBS:methanol followed by the addition of chloroform to make 1:1:2 PBS:methanol:chloroform solvent (v/v/v). The following internal standards were added to chloroform prior to lipid extraction unless otherwise stated: SGDG(13C16-16:0/14:0) for quantification of SGDGs and SGAAGs, ST(d18:1/17:0) for quantification of sulfatides. The mixtures were shaken vigorously for 30 s, vortexed for 15 s, and centrifuged at 2,200 g for 6 min at 4 °C. The bottom organic layer was collected and dried under a gentle stream of nitrogen.
Global Lipidomics Analysis
Lipid extracts corresponding to the same amount of tissue weight were injected into a Vanquish UHPLC system interfaced with a Q-Exactive Plus mass spectrometer (Thermo Fisher Scientific). Lipids were separated on a Waters XBridge BEH C8 column (5 μm, 50 × 4.6 mm) over a 70 min gradient as follows: 0% B for 5 min, 0–20% B in 0.1 min, 20–100% B in 50 min, held at 100% B for 8 min, 100–0% B in 0.1 min, held at 0% B for 6.9 min. The flow rate was set to 0.1 mL/min at the beginning, ramped to 0.3 mL/min at 5.1 min, and further increased to 0.4 mL/min at 63.1 min. Data were acquired in the positive and negative ionization modes using Xcalibur. Solvent A was 95:5 water:methanol. Solvent B was 70:25:5 isopropanol:methanol:water. For the positive ionization mode, 0.1% formic acid and 5 mM ammonium formate were added to the mobile phases as modifiers. For the negative ionization mode, 0.1% ammonium hydroxide solution containing 28% NH3 in water was added. The HESI source parameters were as follows: spray voltage, 3000 V (positive ionization mode), 2250 V (negative ionization mode); capillary temperature, 325 °C; sheath gas, 50; aux gas, 10; spare gas, 1; probe temperature, 200 °C; S-Lens RF level, 65. The Q-Exactive Plus mass spectrometer was operated in data-dependent mode with one full MS scan at a resolution of 70,000, AGC target of 1e6, maximum injection time of 100 ms, and a scan range of 150–1,500 m/z, followed by ten HCD MS/MS scans at a resolution of 17,500, AGC target of 1e5, maximum injection time of 200 ms, an isolation width of 1.0 m/z, stepped NCE of 20, 30, 40, and a scan range of 200–2,000 m/z. The dynamic exclusion was 30 s.
Quantification was performed using XCMS Online54 after conversion of the raw files to mzXML format using Proteowizard55. The following parameters were used for XCMS online: peak detection method, centWave; ppm, 8; peakwidth, 15–70; signal/noise threshold, 10; mzdiff, 0.01; prefilter peaks, 3; integration method, 1; prefilter peaks, 3; prefilter intensity, 100; noise filter, 0; retention time correction method, obiwarp; profStep, 0.25; mzwid, 0.015; bw, 10; minfrac, 0.5; minsamp, 1. The quantification results were normalized to total ion chromatogram. Lipids were identified with LipidSearch (Thermo Fisher Scientific) by searching the MS/MS spectra against a built-in database that contains more than 1.5 million lipid ions and their predicted fragment ions. The following parameters were used for LipidSearch: precursor tolerance, 8 ppm; product tolerance, 10 ppm; adducts for the positive mode, +H, +NH4, +Na, and +H-H2O; adducts for the negative mode, −H, −2H, and +Cl; m-Score threshold, 5.0; ID quality filter: A, B. The ID quality filter was set to A and B, which requires annotation of both the head group and fatty acyls for confident identification. The maximum intensity of lipids is required to be greater than 1e5. Skyline56 was used for additional manual inspection.
Lipid co-expression network analysis, module-trait association analysis, and lipid class enrichment
Lipids whose max intensity across all samples was less than 5e5 were filtered out from the normalized lipidomics data. The filtered data were log2 transformed. Acquisition order was then regressed out from the data. Lipid co-expression networks and modules were estimated using the blockwiseModules function with the following parameters: networkType = signed; corType = bicorr; power = 7; deepSplit = 2; minModuleSize = 40; mergeCutHeight = 0.1; pamStage = FALSE. The soft threshold power was chosen to correspond to the scale-free topology fit index of 0.8 or higher. Module eigenlipid-age associations were calculated using a linear regression model with module eigenlipid as dependent variable and age as explanatory variable. P values were FDR-corrected to account for multiple comparisons. Hub lipids within each module were prioritized based on their module membership (kME), defined as correlation of expression profiles between each lipid and the module eigenlipid. To test for enrichment of lipid classes in each module, fisher exact test was performed comparing each lipid class with each module. The resulting P values were FDR-corrected to account for multiple comparisons. All analyses are performed using R programing language.
Determination of the sugar type and sulfate position of SGDG
Separation of SGDG isomers was achieved on a Luna Omega Sugar column (3 μm, 150 × 4.6 mm, Phenomenex, 00F-4775-E0). The mobile phases consisted of (A) 50:50 acetonitrile:water with 5 mM ammonium acetate and (B) 95:5 acetonitrile: water with 5 mM ammonium acetate. SGDG and SGlcDG were separated within 30 min under isocratic elution using 55% B at a flow rate of 0.15 mL/min. SGDG sulfation isomers were separated as follows: 100% B for 5.1 min, 100–55% B in 4.9 min, held at 55% B for 30 min. The flow rate was 0.1 mL/min for the first 5 min and ramped to 0.15 mL/min in 0.1 min.
Targeted Lipidomics of SGDGs
Lipid extracts from the same amount of starting material were injected into an Acquity UPLC system interfaced with a TSQ Quantiva mass spectrometer (Thermo Fisher Scientific) for LC–MS analysis. Data was acquired using Xcalibur. Lipids were separated on an Acquity UPLC BEH C18 column (1.7 μm, 100 × 2.1 mm, Waters, 186002352) over a 35 min gradient as follows: 0% B for 8 min, 0–30% B in 1 min, 30–70% B in 18 min, 70–100% B in 0.1 min, held at 100% B for 2.9 min, 100–0% B in 0.1 min, held at 0% B for 4.9 min. Solvent A was 95:5 water:acetonitrile with 0.1% ammonium hydroxide solution containing 28% NH3. Solvent B was 90:10 isopropanol:acetonitrile with 0.1% ammonium hydroxide solution containing 28% NH3. The flow rate was 0.1 mL/min at the beginning and ramped to 0.2 mL/min in 1 min. The column was maintained at 50 °C. MRM experiments were carried out in the negative ionization mode with the following parameters: spray voltage, 2.5 kV; sheath gas, 30 L/min; aux gas, 12 L/min; sweep gas, 1 L/min; ion transfer tube temperature, 342 °C; vaporizer temperature, 358 °C; Q1 and Q3 resolution, 0.7; cycle time, 3 sec; collision energy, 55 V; RF lens voltage, 195 V. Ion transitions correspond to the deprotonated precursor to sulfate and the deprotonated precursor to the loss of a fatty acyl chain. The transition corresponding to the loss of a fatty acyl with higher intensity was used for quantification. Absolute concentration of SGDGs was calculated by dividing their peak areas by that of SGDG(13C16-16:0/14:0) and multiplying by the concentration of SGDG(13C16-16:0/14:0).
Fractionation of mouse brain lysate
Mouse brains were homogenized in PBS at 4 °C for 3 cycles (20 s per cycle, 6500 rpm, 15 s break) using Precellys Evolution homogenizer coupled with Cryolys Evolution cooling unit (Bertin Technologies). The homogenates were centrifuged at 1,000 g for 10 min at 4 °C to pellet cell debris. The supernatant was separated by ultracentrifugation at 100,000 g with an SW60 Ti rotor for 45 min at 4 °C, yielding the membrane and soluble fraction. Lipids were extracted from the membrane fraction and soluble fraction corresponding to the same amount of input material.
Myelin Purification
Myelin purification was performed as previously described35. Mouse or rat brain was homogenized in 0.32 M sucrose in ddH2O at 4 °C using Precellys Evolution homogenizer. Homogenate was layered on 0.85 M sucrose in ddH2O and centrifuged at 75,000 g for 30 min at 4 °C. The crude myelin fraction at the 0.32/0.85 M sucrose interface was collected and washed with ddH2O followed by two osmotic shocks. For each osmotic shock, the pellet was resuspended in cold ddH2O, incubated on ice for 10 min, and then centrifuged at 12,000 g for 15 min at 4 °C. The shocked membranes were resuspended in 0.32 M sucrose, layered on 0.85 M sucrose, and centrifuged at 75,000 g for 30 min at 4 °C. The 0.32/0.85 M sucrose interface was collected, washed with cold ddH2O, and resuspended in PBS. In all the steps, ddH2O and PBS were supplemented with Roche complete protease inhibitor cocktail tablet.
To myelin validation, myelin fraction and brain lysate containing 10 μg of protein were analyzed by Western blotting using the following antibodies: anti-PLP (abcam, ab254363, 1:2000), anti-MBP (abcam, ab7349, 1:5000), and anti-synaptophysin (Sigma-Aldrich, S5768, 1:500). Myelin fraction and brain lysate were delipidated by acetone precipitation before protein concertation determination using QuickStart Bradford 1× Dye Reagent (Bio-Rad, 500–0205).
Solid Phase Extraction for Human and Macaque Samples
SPE was performed at room temperature using a Strata SI-1 Silica SPE column (500 mg silica, 3 mL, Phenomenex, 8B-S012-HBJ-T). The SPE column was conditioned with 2 mL of hexane three times. Next, the crude lipid extract from the human or macaque brain was reconstituted in 200 μL of chloroform and loaded to the column. The sample vial was rinsed with another 200 μL of chloroform and loaded to the column to ensure the complete transfer of lipids. The column was washed with 2 mL of chloroform 3 times, 2 mL of 10:90 methanol:chloroform 3 times, followed by elution of SGDGs using 2 mL of 15:85 methanol:chloroform twice. The SGDG fraction was dried under a gentle stream of nitrogen and stored at −80°C prior to LC-MS analysis.
SGDG degradation assay and LC-MS analysis
Mouse brains were homogenized in PBS and centrifuged at 1,000 g for 10 min at 4 °C. The supernatants were used for the degradation assay. Denatured brain lysates were prepared by heating the lysates at 95 °C for 30 min. 200 μg of brain lysate was incubated with 100 μM of SGDG(14:0/16:0) in 200 μL of PBS at 37 °C for 30 min. The reaction was stopped by adding 300 μL of PBS, 500 μL of methanol, and 1 mL of chloroform with 50 pmol of 13C16-palmitic acid. The mixture was vortexed and centrifuged at 2,200 g for 6 min. The bottom organic layer was collected and dried under a stream of nitrogen. Lipid extract was dissolved in 80 μL of 1:1 methanol:chloroform. 10 μL of the sample was analyzed using a Vanquish UHPLC system interfaced with a Q-Exactive Plus mass spectrometer. Lipids were separated on a Bio-Bond C4 column (5 μm, 50 × 4.6 mm, Dikma, 84410) using the same gradient as global lipidomics except that the flow rate was 0.1 mL/min at 0–5 min, 0.4 mL/min at 5.1–55 min, 0.5 mL/min at 55.1–70 min. Solvent A was 95:5 water:methanol with 0.1% ammonium hydroxide solution. Solvent B was 60:35:5 isopropanol:methanol:water with 0.1% ammonium hydroxide solution. MS data were acquired in the negative ionization mode using the same parameters as global lipidomics. The HESI source parameters were as follows: spray voltage, 2200 V; capillary temperature, 275 °C; sheath gas, 52.5; aux gas, 13.75; spare gas, 2.75; probe temperature, 425 °C; S-Lens RF level, 50. Lyso-SGDGs were quantified by integrating their peak areas. Results were normalized to the internal standard.
Cell cultures
RAW 264.7 cells were maintained in RPMI 1640 with 10% FBS. BV2 cells were maintained in low glucose DMEM with 10% FBS and changed to regular DMEM medium with 7.5% FBS for treatment. Both cell lines were incubated at 37 °C in a humidified 5% CO2 atmosphere.
For mouse BMDM preparation, bone marrow cells were flushed from femur and tibia bones of 8 weeks C57BL6 male mice as described previously57–59. Red blood cells were lysed, and cells were plated at a density of 1.0 × 10⁶ cells/mL in RPMI-1640 medium containing 1% L-glutamine, MEM Amino Acids, Sodium Pyruvate, MEM Vitamin, 10% FBS, and 20ng/mL of M-CSF (Peprotech, 315–02) for six days.
Primary OPCs were purified by immunopanning from P5-P7 Sprague Dawley rat as previously described60. OPCs were seeded at a density of 50,000/10-cm dish post-prep. All plastic ware was coated with 0.01 mg/ml poly-D-lysine hydrobromide (PDL, Sigma P6407). OPCs were cultured in DMEM-SATO base media containing 4.2 μg/ml forskolin (Sigma-Aldrich, F6886), 10 ng/ml PDGF (Peprotech, 100–13A), 10 ng/ml CNTF (Peprotech, 450–02), and 1 ng/ml neurotrophin-3 (Peprotech, 450–03) for proliferation at 37 °C in a 10% CO2 atmosphere. Cells were changed to DMEM-SATO base media containing 4.2 μg/ml forskolin (Sigma-Aldrich, F6886), 10 ng/ml CNTF (Peprotech, 450–02), 40 ng/ml thyroid hormone (Sigma-Aldrich, T6397), and 1x NS21-MAX (R&D Systems, AR008) for differentiation. OPCs proliferated for four days post-prep before harvest. Oligodendrocytes were differentiated from OPCs for five days. To harvest cells, all cells were washed with ice-cold PBS, scraped using a sterile plastic cell scraper, and centrifuged at 200 g for 15 minutes at 4 °C to collect cell pellets. Cell pellets were flash frozen in liquid nitrogen and stored at −80 °C until lipid extraction was performed.
ELISA and MTT assay
RAW 264.7 cells were seeded at 3 × 10⁴/well onto a 48-well plate overnight. On the second day, cells were incubated with media alone, 100 ng/ml of LPS, or co-treated with 100 ng/mL of LPS and indicated compound for 24 hours. To control for potential effects of vehicles, the same amount of vehicles were added to each group including the no LPS and LPS-only controls. Media were collected and centrifuged at 2,000g for 5 min at 4 °C. The supernatants were assayed using mouse IL-6 or TNF-α ELISA MAX™ Deluxe kits according to the manufacturer’s protocols. Cells adherent to the plate were tested for viability using MTT (3-(4,5-dimethylthiazol-2-yl)-2,5-diphenyltetrazolium bromide) assay. Briefly, cells were changed to media containing 500 μg/mL of MTT and incubated at 37 °C for 4 hours. After removing the media, 200 μl of DMSO were added to cells to solubilize the formazan product. The absorption was measured at 570 nm. IL-6 and TNF-α levels were normalized to cell viability. BMDMs and BV2 cells were treated the same way as RAW 264.7 cells except that BV2 cells were preincubated with the compound for 1 hour before being treated with LPS.
RT-PCR analysis
RAW 264.7 cells or BMDMs were seeded onto a 6-well plate before treatment. Then cells were treated with media alone, 100 ng/ml of LPS, or co-treated with 100 ng/mL of LPS and 5 μM of SGDG(14:0/16:0). After 4 hours of incubation, cells were washed with ice-cold PBS. RNA was extracted using the RNeasy Plus Mini Kit (Qiagen, 74134). cDNA was prepared from 1 μg of RNA using the QuantiTect Reverse Transcription Kit (Qiagen, 205313). RT-PCR was performed with Taqman Gene Expression Assays (Thermo Fisher Scientific, 4453320) for Il1b (Mm00434228_m1), Il6 (Mm00446190_m1), Cxcl10 (Mm00445235_m1), Tnf (Mm00445235_m1), Ptgs2 (Mm00478374_m1), Nos2 (Mm00440502_m1), and Gapdh (Mm99999915_g1). Gene expression levels were quantified relative to Gapdh.
NF-κB luciferase reporter assay
HEK293T cells were plated at 100,000 cells per well in a 24-well plate pre-coated with 50 μg/ml poly-L-lysine and incubated overnight. Plasmids encoding β-galactosidase, NF-κB-luciferase, TLR4, and MD2 were transfected into cells using Lipofectamine 2000 (Thermo Fisher Scientific, 11668019). On the second day, cells were washed twice with DMEM containing 0.2% FBS and 0.1% BSA and treated with media alone, 100 ng/mL of LPS, or co-treated with 100 ng/mL of LPS and indicated compound for 6 hours. Cells were lysed on ice with luciferase lysis buffer. Luciferase activity and β-galactosidase activity in each well were measured. Relative luciferase units were calculated and normalized to β-galactosidase activity.
Statistical analysis
Unless otherwise stated, quantitative data are shown in bar graphs with means ± SEM. Statistical significance was calculated using ordinary one-way ANOVA followed by post hoc Dunnett multiple comparison test. Significant P values are indicated (*P < 0.05).
DATA AVAILABILITY
The lipidomics raw data and metadata have been deposited into MassIVE public repository with the accession number MSV000090179 (doi:10.25345/C59Z90G8H). LipidBlast, Lipid MAPS, and METLIN are available at https://fiehnlab.ucdavis.edu/projects/lipidblast, https://www.lipidmaps.org/, and https://metlin.scripps.edu/landing_page.php?pgcontent=mainPage, respectively.
Extended Data
Extended Data Fig. 1.
Average levels of the co-expressed lipids in the 23 modules across different ages. n = 4 mice/group. Values are expressed with box plots. Boxes represent 25th to 75th percentile. Center lines represent the median values. Whiskers represent 1.5× interquartile range.
Extended Data Fig. 2.
Association between module eigenlipid and age. Blue line represents fitted linear regression line between module eigenlipid and age. Pink shaded area represents 95% confidence interval of the regression line. Modules that are significantly associated with age are highlighted with red boxes.
Extended Data Fig. 3.

Quantification of SGDGs in the brain of mice with three months of calorie restriction. Sex, male; Age, 6 months. n = 8 mice/group, data are means ± SEM. *P < 0.05 versus ad libitum-fed mice. P values were 0.0217, 0.0155, 0.0276, 0.0453, 0.0410, 0.0243, 0.2387, 0.0694, 0.1417, 0.1103, 0.0423, 0.0451 (left to right). Statistical significance was calculated using unpaired, two-tailed Student’s t-test with equal variance.
Extended Data Fig. 4.
Fractionation of the mouse brain lysate into membrane and soluble fractions revealed that SGDGs are largely membrane-associated. Bar graph shows SGDG levels relative to the total lysate. n = 3, data are means ± SEM.
Extended Data Fig. 5.

Quantification of SGAAGs in mouse tissues. (a) Quantification of SGAAGs in the brain and spinal cord of WT female mice at different ages. n = 4 mice/group, data are means ± SEM. (b) Quantification of SGAAGs in the brain, spinal cord, and testis of WT male mice at different ages. Data were collected from six 3-month-old, three 7-month-old, and six 22-month-old mice. Data are means ± SEM.
Extended Data Fig. 6.
SGDGs are enriched in myelin. (a) Quantification of sulfatides in purified mouse brain myelin. n = 3 mice, data are means ± SEM. (b) Validation of myelin purification. Immunoblot shows that myelin proteins, PLP and MBP, are enriched in purified rat brain myelin compared with the brain lysate, whereas the abundant neuronal protein synaptophysin is depleted. (c) Quantification of SGDGs and sulfatides in purified rat brain myelin. n = 2 technical replicates, data are means ± SEM.
Extended Data Fig. 7.
Quantification of SGDGs in oligodendrocyte precursor cells and myelinated oligodendrocytes at day 5 of differentiation.
Extended Data Fig. 8.
Quantification of SGDGs in macaque and human brains. (a) Extracted ion chromatograms of SGDG(14:0_16:0) from the parietal cortex of a 6-year-old male macaque and the internal standard SGDG(13C16-16:0/14:0). (b) Quantification of SGDGs in the parietal cortex of a 6-year-old male macaque. (c) Quantification of SGDGs in a frontal brain sample collected postmortem from a 5-month-old male subject.
Extended Data Fig. 9.
Expression profile of MGDGs, SGAAGs, SGDGs, MGMGs, and lyso-SGDGs in the spinal cord module which shows progressive decrease during aging.
Extended Data Fig. 10.
SGDG exhibits anti-Inflammatory effects in RAW 264.7 cells and BV2 cells. (a) RAW 264.7 cells were incubated with media alone, 100 ng/mL of LPS, or co-treated with 100 ng/mL of LPS and 5 μM of SGDG(14:0/16:0) for 4 hours. mRNA levels were determined by RT-PCR. n = 4 replicates. P values were 3.24e-13, 9.54e-11, 3.44e-9, 3.22e-7, 9.35e-11, 5.41e-7, 1.36e-10, 0.00004, 7.10e-10, 0.00001, 2.17e-6, 0.06078 (left to right, top to bottom). (b) BV2 cells were incubated with media alone, 100 ng/mL of LPS, or co-treated with 100 ng/mL of LPS and 25 μM of SGDG(14:0/16:0) or dexamethasone (Dex) for 24 hours. IL-6 and TNF-α levels in the media were measured by ELISA and normalized to cell viability. n = 3 replicates. P values were 0, 0, 0, 0, 0.00005, 0.00038 (left to right). In a, b, data are means ± SEM. *P < 0.05 versus LPS. Statistical significance was calculated using one-way ANOVA followed by post hoc Dunnett’s test to correct for multiple comparisons.
Supplementary Material
ACKNOWLEDGEMENTS
We thank members of the Saghatelian laboratory for helpful advice and discussions; R. Rissman for providing the human hippocampus sample; J. Ning for providing the anti-PLP antibody. This research was supported by Ferring Pharmaceuticals and Frederik Paulsen (D.S. and A.S.), NIH (P30 CA014195, R01DK106210, A.S.), ONPRC (P51 OD 010092, S.G.K.), the Anderson Foundation (D.T.), the Bruce Ford and Anne Smith Bundy Foundation (D.T.), Pioneer Fellowship (D.T.), NIH (R01NS119823, J.B.Z.), the Howard Hughes Medical Institute (A.D.), CZI Neurodegeneration Network (N.J.A.), FAPESP (2017/01184–9, M.A.M.), and NIH (R01AG069206, RF1AG061296, P.M.)
Footnotes
COMPETING INTERESTS
The authors declare no competing interests.
REFERENCES
- 1.Mattson MP & Arumugam TV Hallmarks of brain aging: adaptive and pathological modification by metabolic states. Cell metabolism 27, 1176–1199 (2018). [DOI] [PMC free article] [PubMed] [Google Scholar]
- 2.Bishop NA, Lu T & Yankner BA Neural mechanisms of ageing and cognitive decline. Nature 464, 529–535 (2010). [DOI] [PMC free article] [PubMed] [Google Scholar]
- 3.Wenk MR The emerging field of lipidomics. Nature reviews Drug discovery 4, 594–610 (2005). [DOI] [PubMed] [Google Scholar]
- 4.Hallett PJ, Engelender S & Isacson O Lipid and immune abnormalities causing age-dependent neurodegeneration and Parkinson’s disease. Journal of neuroinflammation 16, 1–15 (2019). [DOI] [PMC free article] [PubMed] [Google Scholar]
- 5.Bu G Apolipoprotein E and its receptors in Alzheimer’s disease: pathways, pathogenesis and therapy. Nature Reviews Neuroscience 10, 333–344 (2009). [DOI] [PMC free article] [PubMed] [Google Scholar]
- 6.Lwin A, Orvisky E, Goker-Alpan O, LaMarca ME & Sidransky E Glucocerebrosidase mutations in subjects with parkinsonism. Molecular genetics and metabolism 81, 70–73 (2004). [DOI] [PubMed] [Google Scholar]
- 7.Blankman JL, Long JZ, Trauger SA, Siuzdak G & Cravatt BF ABHD12 controls brain lysophosphatidylserine pathways that are deregulated in a murine model of the neurodegenerative disease PHARC. Proceedings of the National Academy of Sciences 110, 1500–1505 (2013). [DOI] [PMC free article] [PubMed] [Google Scholar]
- 8.Li Q et al. Changes in lipidome composition during brain development in humans, chimpanzees, and macaque monkeys. Molecular biology and evolution 34, 1155–1166 (2017). [DOI] [PMC free article] [PubMed] [Google Scholar]
- 9.Yu Q et al. Lipidome alterations in human prefrontal cortex during development, aging, and cognitive disorders. Molecular psychiatry 25, 2952–2969 (2020). [DOI] [PMC free article] [PubMed] [Google Scholar]
- 10.Tu J, Yin Y, Xu M, Wang R & Zhu Z-J Absolute quantitative lipidomics reveals lipidome-wide alterations in aging brain. Metabolomics 14, 1–11 (2018). [DOI] [PubMed] [Google Scholar]
- 11.Ding J et al. A metabolome atlas of the aging mouse brain. Nature Communications 12, 1–12 (2021). [DOI] [PMC free article] [PubMed] [Google Scholar]
- 12.Saghatelian A et al. Assignment of endogenous substrates to enzymes by global metabolite profiling. Biochemistry 43, 14332–14339 (2004). [DOI] [PubMed] [Google Scholar]
- 13.Yore MM et al. Discovery of a class of endogenous mammalian lipids with anti-diabetic and anti-inflammatory effects. Cell 159, 318–332 (2014). [DOI] [PMC free article] [PubMed] [Google Scholar]
- 14.Amor S, Puentes F, Baker D & Van Der Valk P Inflammation in neurodegenerative diseases. Immunology 129, 154–169 (2010). [DOI] [PMC free article] [PubMed] [Google Scholar]
- 15.Wyss-Coray T & Mucke L Inflammation in neurodegenerative disease—a double-edged sword. Neuron 35, 419–432 (2002). [DOI] [PubMed] [Google Scholar]
- 16.Sindelar M & Patti GJ Chemical discovery in the era of metabolomics. Journal of the American Chemical Society 142, 9097–9105 (2020). [DOI] [PMC free article] [PubMed] [Google Scholar]
- 17.Langfelder P & Horvath S WGCNA: an R package for weighted correlation network analysis. BMC bioinformatics 9, 1–13 (2008). [DOI] [PMC free article] [PubMed] [Google Scholar]
- 18.Cutler RG et al. Involvement of oxidative stress-induced abnormalities in ceramide and cholesterol metabolism in brain aging and Alzheimer’s disease. Proceedings of the National Academy of Sciences 101, 2070–2075 (2004). [DOI] [PMC free article] [PubMed] [Google Scholar]
- 19.Li M-L et al. 547 transcriptomes from 44 brain areas reveal features of the aging brain in non-human primates. Genome biology 20, 1–17 (2019). [DOI] [PMC free article] [PubMed] [Google Scholar]
- 20.Horvath S et al. Analysis of oncogenic signaling networks in glioblastoma identifies ASPM as a molecular target. Proceedings of the National Academy of Sciences 103, 17402–17407 (2006). [DOI] [PMC free article] [PubMed] [Google Scholar]
- 21.Toida T, Chaidedgumjorn A & Linhardt RJ Structure and bioactivity of sulfated polysaccharides. Trends in Glycoscience and Glycotechnology 15, 29–46 (2003). [Google Scholar]
- 22.Gorelik D, Lin YC, Briceno-Strocchia AI & Taylor MS Diarylborinic Acid-Catalyzed, Site-Selective Sulfation of Carbohydrate Derivatives. The Journal of Organic Chemistry 84, 900–908 (2019). [DOI] [PubMed] [Google Scholar]
- 23.Kind T et al. LipidBlast in silico tandem mass spectrometry database for lipid identification. Nature methods 10, 755–758 (2013). [DOI] [PMC free article] [PubMed] [Google Scholar]
- 24.Sud M et al. Lmsd: Lipid maps structure database. Nucleic acids research 35, D527–D532 (2007). [DOI] [PMC free article] [PubMed] [Google Scholar]
- 25.Smith CA et al. METLIN: a metabolite mass spectral database. Therapeutic drug monitoring 27, 747–751 (2005). [DOI] [PubMed] [Google Scholar]
- 26.Flynn TJ, Deshmukh D, Rao GS & Pieringer RA Sulfogalactosyl diacylglycerol: occurrence and biosynthesis of a novel lipid in rat brain. Biochemical and biophysical research communications 65, 122–128 (1975). [DOI] [PubMed] [Google Scholar]
- 27.Ishizuka I, Inomata M, Ueno K & Yamakawa T Sulfated glyceroglycolipids in rat brain. Structure sulfation in vivo, and accumulation in whole brain during development. Journal of Biological Chemistry 253, 898–907 (1978). [PubMed] [Google Scholar]
- 28.Ishizuka I Sulphated glycoglycerolipids in rat brain: decrease and disappearance after developmental age. (1979). [DOI] [PubMed]
- 29.Baillie TA Stable isotopes: Applications in pharmacology, toxicology and clinical research. (Springer, 1978). [Google Scholar]
- 30.Willott JF, Bross LS & McFadden SL Morphology of the dorsal cochlear nucleus in C57BL/6J and CBA/J mice across the life span. Journal of Comparative Neurology 321, 666–678 (1992). [DOI] [PubMed] [Google Scholar]
- 31.Ishizuka I Chemistry and functional distribution of sulfoglycolipids. Progress in lipid research 36, 245–319 (1997). [DOI] [PubMed] [Google Scholar]
- 32.Pieringer J, Rao GS, Mandel P & Pieringer RA The association of the sulphogalactosylglycerolipid of rat brain with myelination. Biochemical Journal 166, 421–428 (1977). [DOI] [PMC free article] [PubMed] [Google Scholar]
- 33.Chernoff GF Shiverer: an autosomal recessive mutant mouse with myelin deficiency. Journal of Heredity 72, 128–128 (1981). [DOI] [PubMed] [Google Scholar]
- 34.Rao GS, Norcia LN, Pieringer J & Pieringer RA The biosynthesis of sulphogalactosyldiacylglycerol of rat brain in vitro. Biochemical Journal 166, 429–435 (1977). [DOI] [PMC free article] [PubMed] [Google Scholar]
- 35.Erwig MS et al. Myelin: Methods for Purification and Proteome Analysis. Methods in molecular biology (Clifton, N.J.) 1936, 37–63 (2019). [DOI] [PubMed] [Google Scholar]
- 36.Gopalakrishnan G et al. Lipidome and proteome map of myelin membranes. Journal of neuroscience research 91, 321–334 (2013). [DOI] [PubMed] [Google Scholar]
- 37.Honke K Biosynthesis and biological function of sulfoglycolipids. Proceedings of the Japan Academy, Series B 89, 129–138 (2013). [DOI] [PMC free article] [PubMed] [Google Scholar]
- 38.Tanphaichitr N et al. Properties, metabolism and roles of sulfogalactosylglycerolipid in male reproduction. Progress in lipid research 72, 18–41 (2018). [DOI] [PMC free article] [PubMed] [Google Scholar]
- 39.McKhann GM & Ho W The in vivo and in vitro synthesis of sulphatides during development. Journal of neurochemistry 14, 717–724 (1967). [DOI] [PubMed] [Google Scholar]
- 40.Burkart T, Caimi L, Herschkowitz NN & Wiesmann UN Metabolism of sulfogalactosyl glycerolipids in the myelinating mouse brain. Developmental biology 98, 182–186 (1983). [DOI] [PubMed] [Google Scholar]
- 41.Wang C, Wang J, Qin C & Han X Analysis of monohexosyl alkyl (alkenyl)-acyl glycerol in brain samples by shotgun lipidomics. Analytica chimica acta 1129, 143–149 (2020). [DOI] [PMC free article] [PubMed] [Google Scholar]
- 42.Lee C-K, Weindruch R & Prolla TA Gene-expression profile of the ageing brain in mice. Nature genetics 25, 294–297 (2000). [DOI] [PubMed] [Google Scholar]
- 43.Hannun YA & Obeid LM Principles of bioactive lipid signalling: lessons from sphingolipids. Nature reviews Molecular cell biology 9, 139–150 (2008). [DOI] [PubMed] [Google Scholar]
- 44.Guijas C, Montenegro-Burke JR, Warth B, Spilker ME & Siuzdak G Metabolomics activity screening for identifying metabolites that modulate phenotype. Nature biotechnology 36, 316–320 (2018). [DOI] [PMC free article] [PubMed] [Google Scholar]
- 45.Chiurchiù V, Leuti A & Maccarrone M Bioactive lipids and chronic inflammation: managing the fire within. Frontiers in immunology 9, 38 (2018). [DOI] [PMC free article] [PubMed] [Google Scholar]
- 46.Franceschi C & Campisi J Chronic inflammation (inflammaging) and its potential contribution to age-associated diseases. Journals of Gerontology Series A: Biomedical Sciences and Medical Sciences 69, S4–S9 (2014). [DOI] [PubMed] [Google Scholar]
- 47.Franceschi C et al. Inflammaging and anti-inflammaging: a systemic perspective on aging and longevity emerged from studies in humans. Mechanisms of ageing and development 128, 92–105 (2007). [DOI] [PubMed] [Google Scholar]
- 48.Ye S-M & Johnson RW Increased interleukin-6 expression by microglia from brain of aged mice. Journal of neuroimmunology 93, 139–148 (1999). [DOI] [PubMed] [Google Scholar]
- 49.Porcher L et al. Aging triggers an upregulation of a multitude of cytokines in the male and especially the female rodent hippocampus but more discrete changes in other brain regions. J Neuroinflammation 18, 219 (2021). [DOI] [PMC free article] [PubMed] [Google Scholar]
- 50.Peters A The effects of normal aging on myelin and nerve fibers: a review. Journal of neurocytology 31, 581–593 (2002). [DOI] [PubMed] [Google Scholar]
METHODS-ONLY REFERENCES
- 51.Turturro A et al. Growth curves and survival characteristics of the animals used in the Biomarkers of Aging Program. The journals of gerontology. Series A, Biological sciences and medical sciences 54, B492–501 (1999). [DOI] [PubMed] [Google Scholar]
- 52.Liebisch G et al. Shorthand notation for lipid structures derived from mass spectrometry. Journal of lipid research, jlr. M033506 (2013). [DOI] [PMC free article] [PubMed] [Google Scholar]
- 53.Bligh EG & Dyer WJ A rapid method of total lipid extraction and purification. Canadian journal of biochemistry and physiology 37, 911–917 (1959). [DOI] [PubMed] [Google Scholar]
- 54.Tautenhahn R, Patti GJ, Rinehart D & Siuzdak G XCMS Online: a web-based platform to process untargeted metabolomic data. Analytical chemistry 84, 5035–5039 (2012). [DOI] [PMC free article] [PubMed] [Google Scholar]
- 55.Kessner D, Chambers M, Burke R, Agus D & Mallick P ProteoWizard: open source software for rapid proteomics tools development. Bioinformatics 24, 2534–2536 (2008). [DOI] [PMC free article] [PubMed] [Google Scholar]
- 56.MacLean B et al. Skyline: an open source document editor for creating and analyzing targeted proteomics experiments. Bioinformatics 26, 966–968 (2010). [DOI] [PMC free article] [PubMed] [Google Scholar]
- 57.Ip WE, Hoshi N, Shouval DS, Snapper S & Medzhitov R Anti-inflammatory effect of IL-10 mediated by metabolic reprogramming of macrophages. Science 356, 513–519 (2017). [DOI] [PMC free article] [PubMed] [Google Scholar]
- 58.Moraes-Vieira PM et al. Leptin deficiency impairs maturation of dendritic cells and enhances induction of regulatory T and T h17 cells. European journal of immunology 44, 794–806 (2014). [DOI] [PMC free article] [PubMed] [Google Scholar]
- 59.Moraes-Vieira PM et al. RBP4 activates antigen-presenting cells, leading to adipose tissue inflammation and systemic insulin resistance. Cell metabolism 19, 512–526 (2014). [DOI] [PMC free article] [PubMed] [Google Scholar]
- 60.Dugas JC & Emery B Purification of oligodendrocyte precursor cells from rat cortices by immunopanning. Cold Spring Harbor protocols 2013, 745–758 (2013). [DOI] [PubMed] [Google Scholar]
Associated Data
This section collects any data citations, data availability statements, or supplementary materials included in this article.
Supplementary Materials
Data Availability Statement
The lipidomics raw data and metadata have been deposited into MassIVE public repository with the accession number MSV000090179 (doi:10.25345/C59Z90G8H). LipidBlast, Lipid MAPS, and METLIN are available at https://fiehnlab.ucdavis.edu/projects/lipidblast, https://www.lipidmaps.org/, and https://metlin.scripps.edu/landing_page.php?pgcontent=mainPage, respectively.