

Abstract
Background & Aims:
We studied longitudinal trends in mortality, outpatient, and inpatient care for cirrhosis in a national cohort in the first 2 years of the COVID-19 pandemic. We evaluated trends in hepatocellular carcinoma (HCC) surveillance and factors associated with completion.
Methods:
Within the national cirrhosis cohort in the Veterans Administration from 2020 to 2021, we captured mortality, outpatient primary care (PCP), gastroenterology/hepatology (GI/HEP) visits, and hospitalizations. HCC surveillance was computed as percent of time up to date with surveillance every 6 months (PTUDS). Multivariable models for PTUDS were adjusted for patient demographics, clinical factors, and facility-level variables.
Results:
The total cohort was 68,073; 28,678 were eligible for HCC surveillance. Outpatient PCP and GI/HEP appointment rates initially dropped from 30% to 7% with a rebound one year into the pandemic and steady subsequent use. Telemedicine monthly visit rates rose from less than 10% to a peak of 20% with a steady gradual decline. Nearly 70% of Veterans were up to date with HCC surveillance prior to the pandemic with an early pandemic nadir of about 50%, and 60% PTUDS 2 years into the pandemic. In adjusted models, use of a population-based cirrhosis dashboard (β 8.5, 95% CI 6.9 – 10.2), GI/HEP visits both in-person (β 3.2, 95% CI 2.9– 3.6) and telemedicine (β 2.1, 95% CI 1.9–2.4) were associated with higher PTUDS.
Conclusions:
Outpatient utilization and HCC surveillance rates have rebounded but remain below baseline. Population-based approaches and specialty care for cirrhosis were associated with higher completion of HCC surveillance.
Keywords: care delivery, quality improvement, outcomes, advanced liver disease, population health
Introduction
The COVID-19 pandemic interrupted clinical care in the U.S. after March 2020. Early in the pandemic, widespread shelter-in-place orders, patient and clinician concerns about infection, and COVID-19-related hospitalizations resulted in major shifts in the delivery of acute care and ambulatory services for patients with cirrhosis.(1–3) Our data from a national cirrhosis cohort from the Veterans Health Affairs (VHA), VOCAL, demonstrated outpatient shifts to telemedicine, declining hospitalization rates, and initial declines and subsequent resurgence of biannual hepatocellular carcinoma (HCC) surveillance, a key quality indicator for cirrhosis care.(1, 2, 4) Experts predicted that the impact of pandemic care disruptions would lead to long-term devastating consequences exacerbated with each wave.(5) Given these national trends, we aimed to quantify how the pandemic has affected hospitalization rates, outpatient care utilization, HCC surveillance, and all-cause mortality trends in a national cirrhosis cohort through later phases of the pandemic. We also evaluated whether HCC surveillance completion was associated with (1) access to outpatient primary care (PCP) or gastroenterology/hepatology (GI/HEP) care, (2) outpatient visit modality (in-person, telephone, video), and (3) use of a population-based dashboard for cirrhosis care.
Methods
Study Design and Cohort Creation
We performed a retrospective cohort study using data from the VOCAL cohort that includes longitudinal clinical and demographic information from the Corporate Data Warehouse (CDW) across 127 VHA medical centers. VOCAL contains patients with cirrhosis diagnosed between 2008 and 2021 identified using well-established algorithms.(6–8) The study window spanned from 1/1/2020 (index date) to 12/31/2021. For this study, we created two cohorts:
Cohort 1:
A cirrhosis cohort to evaluate broad healthcare utilization trends during the COVID-19 pandemic. Patients were excluded if they received liver transplant, had no further follow-up beyond 2020, or died prior to the index date.
Cohort 2:
A subcohort to explore HCC surveillance trends and variables associated with remaining up to date with surveillance, excluding patients if they had Child-Turcotte-Pugh (CTP) class C cirrhosis, diagnosis of metastatic cancer, or an established HCC diagnosis prior to the index date. To isolate patients who had been actively engaged in care, we also excluded patients without any outpatient visits preceding the COVID-19 pandemic in the 2019 calendar year.
Variable Collection
For each patient we collected detailed information on demographics (age, sex, race), smoking status, body mass index, comorbidities (diabetes mellitus, coronary artery disease, atrial fibrillation, heart failure), and prior cirrhosis decompensation using methods previously validated in the VHA.(9) CTP class was determined using a validated VHA algorithm, and model for end-stage liver disease-sodium (MELD-Na) was computed from laboratory values.(7) The variables were all obtained in time-updated fashion to correspond to the study index date. Dates of death, liver transplantation, and HCC diagnosis were recorded during the study window for each patient. Facility-level factors were academic center affiliation and use of a clinical advanced liver disease dashboard. This dashboard was assembled through work by the VHA Hepatic Innovation Team (HIT), which formed in 2015 in order to develop population-based approaches for cirrhosis care delivery in coordination with the VA National GI/Hepatology Program.(10, 11) Regular dashboard use was defined as any staff with EMR access at the VA facility logging in at least monthly, intermittent use as at least twice within 6 months, and no use was defined as no logins in 6 months. The VA dashboard (Supplemental Figures 1 and 2) queries data from the VA CDW and defines eligible patients as adult patients who are alive and have diagnosis codes for cirrhosis or complications, are in receipt of clinical care or release of a VA prescription within 18 months; Veterans with a diagnosis of HCC or bile duct cancer and history of liver transplantation are excluded from the eligible denominator. Additional modifications to the eligible denominator account for patients having life expectancy of < 6 months (from the VA health factors file) or those who are on hospice. The definitions of eligible denominator and exclusions are iterative and evolve over time based on user feedback. Imaging adherence to abdominal CT, MRI, or ultrasound is based on 6-month intervals with a 2-month grace period. The dashboard does not write back information into the medical record. However, the dashboard is enabled to flag information derived from the EMR HCC clinical reminder if that reminder was entered by a provider (examples include: “patient does not agree to HCC surveillance”, “patient receives liver care in the community”). These flags are identified in the dashboard for review and resolution.
Study Outcomes
Several healthcare utilization outcomes were evaluated during the study window to consolidate and extend findings from our prior studies, including outpatients visits(12), cirrhosis hospitalizations(1), and completion of HCC surveillance.(2).
Visits. Outpatient visit CDW tables were queried to identify all gastroenterology (GI)/hepatology(HEP) and primary care provider (PCP) outpatient visits for the cohort during the study window as per prior methodology.(12) These were further categorized into telemedicine and in-person visits following prior methods from our group.(1, 2) Due to low overall proportions of video visits, telemedicine visits were grouped to include either phone-based or video-based visits.
Hospitalizations (≥48 hours). Hospitalization records during the study window were obtained from the inpatient CDW tables. Hospitalizations were classified as COVID-19-related if the patient had a polymerase chain reaction (PCR) test result return positive within 30 days prior to or 15 days after hospitalization. For comparative purposes, we obtained United States COVID-19 incidence rates throughout the pandemic from curated data sources, which were expressed per 1,000 cases per month.(13)
HCC Surveillance. All imaging studies that would satisfy HCC surveillance requirement per the American Association for the Study of Liver Diseases (AASLD) guidelines were obtained using structured query language between 7/1/2019 (6 months prior to the index date) and 12/31/2021.(14, 15) This broadly included abdominal ultrasound, liver ultrasound, right upper quadrant ultrasound, contrast-enhanced computed tomography (CT) of the abdomen, and contrast-enhanced magnetic resonance imaging (MRI) of the abdomen following prior methods.(2, 4, 16, 17) Studies were included irrespective of the intent for which they were ordered.(2, 16) Geographic location of HCC surveillance was categorized as Northeast, Southeast, Midsouth, Central, or West.(4, 18) Using imaging data beginning in 7/1/2019, the future month where surveillance was due, i.e., “due month” was coded on a rolling basis throughout the follow-up window. Patients were identified as due for surveillance 6 months after a qualifying imaging study, consistent with national guidelines.(19) These data were used to compute the percent of time up-to-date with surveillance (PTUDS) on a monthly basis during the study window.
Statistical Analysis
Descriptive statistics were used to describe the data for cohorts 1 and 2, where continuous data were summarized with medians and interquartile ranges (IQRs), and categorical data as frequencies and percentages. Using cohort 1, we first plotted the number of patient deaths occurring per month of the study window. This, along with incident transplantation and loss-to-follow-up events, was used to establish the “patients at risk” denominator for subsequent analyses, which was also plotted. Next, to evaluate changes in outpatient visits during the pandemic, we computed the rate of telemedicine versus in-person visits per month as well as the absolute numbers of monthly appointments and plotted these data during the study window. The rate of hospitalizations for patients with cirrhosis for any indication was plotted with overlays of the percentage of hospitalizations attributable to COVID-19 infection and the national COVID-19 incidence rates.(13) Linear regression was used to evaluate the effect of the early COVID-19 pandemic on the above outcomes adjusted for secular trends. Beta coefficients with 95% confidence intervals were presented, with linear combinations of interaction terms utilized where indicated.
Using cohort 2, we plotted the percent of patients who were up to date with HCC surveillance for each month of the study window, stratified by geographic region. Linear regression models were fit to evaluate the association between outpatient visit type (GI/HEP telemedicine, GI/HEP in-person, PCP telemedicine, PCP in-person) and the percent of time up to date during the study window. In models, the effect size of outpatient visit type was expressed per appointments per 6-months. Only appointments that occurred during the time at risk for a patient were included in the aggregate data. Associations between visit type and HCC surveillance were evaluated in a reduced model (model 1), and an adjusted model incorporating the following variables selected a priori: age, race, etiology of liver disease, MELD-Na, academic center, dashboard usage (model 2). For both models, the beta coefficient for each variable and 95% confidence interval (CI) was presented. An alpha threshold of 5% was used for statistical significance. Additional a priori secondary analyses included (1) refitting of model 2 parameters as stratified by U.S. region to evaluate for possible variation in the association between outpatient visit types and HCC surveillance completion, and (2) an interaction between academic center status and categorical dashboard usage. Variation in dashboard use by U.S. region was also evaluated using chi-squared testing. Institutional review board approval for this study was obtained from the Michael J. Crescenz Philadelphia Veterans Affairs Medical Center. All data management and analysis were performed using structured query language and STATA/BE 17.0 (College Station, TX).
Results
Cohort creation and characteristics
After applying prespecified exclusion criteria (Supplemental Figure 3), a total of 68,073 patients with cirrhosis in the VOCAL cohort were alive without a liver transplant at the index date (1/1/2020, cohort 1). To obtain the HCC surveillance cohort, 5,382 patients were excluded due to a diagnosis of HCC prior to 2020, 629 had CTP C cirrhosis, 1,128 had a diagnosis of metastatic cancer, and 32,856 had no outpatient appointments in calendar year 2019, leaving a total of 28,678 patients eligible for HCC surveillance (cohort 2). Table 1 shows the baseline characteristics of both cohorts. The median age was in the 60s and the VHA cohort was 97% male. The cohort was racially/ethnically diverse with greater than 20% of patients of Black and 8% of patients of Hispanic race and ethnicity, respectively. The most common etiologies of liver disease were alcohol-related liver disease, hepatitis C virus, and non-alcoholic fatty liver disease (NAFLD). The median MELD at baseline was 8 and about one third of patients had a previous hepatic decompensation. Greater than half of the cohort had concomitant diabetes and about one third had coronary artery disease. Greater than 60% received care at a VHA with an academic affiliation and the geographic distribution of the cohort reflected the national VHA population. A total of 72% of centers routinely used the cirrhosis/advanced liver disease dashboard, 21% used it intermittently, and 7% had no regular use within the past 6 months. The care utilization (cohort 1) and HCC surveillance (cohort 2) groups had similar characteristics.
Table 1 –
Primary Healthcare Utilization and HCC Surveillance Subgroup Cohort Characteristics
| Factor | Healthcare Utilization Cohort (Cohort 1) N=68,673 |
HCC Surveillance Cohort (Cohort 2) N=28,678 |
|---|---|---|
| Age, median (IQR) | 63 (57.6, 68.2) | 61.6 (56.7, 66) |
| Sex | ||
| Female | 2426 (3.5%) | 978 (3.4%) |
| Male | 66247 (96.5%) | 27700 (96.6%) |
| Race/Ethnicity | ||
| White | 42604 (62.0%) | 17378 (60.6%) |
| Black | 14442 (21.0%) | 6487 (22.6%) |
| Hispanic | 5311 (7.7%) | 2371 (8.3%) |
| Asian | 1010 (1.5%) | 396 (1.4%) |
| Other | 5306 (7.7%) | 2046 (7.1%) |
| BMI, median (IQR) | 29.0 (25.4, 33.3) | 29.1 (25.6, 33.3) |
| Etiology | ||
| Hepatitis C virus (HCV) | 16424 (24.0%) | 8481 (29.6%) |
| Hepatitis B virus | 808 (1.2%) | 391 (1.4%) |
| Alcohol-related liver disease (ALD) | 19106 (27.9%) | 7130 (24.9%) |
| HCV+ALD | 11946 (17.4%) | 5355 (18.7%) |
| Non-alcoholic fatty liver disease | 17730 (25.9%) | 6278 (21.9%) |
| Other | 2552 (3.7%) | 1021 (3.6%) |
| CTP Class | ||
| A | 59535 (86.7%) | 25926 (90.4%) |
| B | 8444 (12.3%) | 2752 (9.6%) |
| C | 694 (1.0%) | 0 (0.0%) |
| MELD-Na, median (IQR) | 8 (6, 12) | 7 (6, 11) |
| Cirrhosis Decompensation | 19926 (29.0%) | 9670 (33.7%) |
| Diabetes Mellitus | 37797 (55.0%) | 16132 (56.3%) |
| Atrial Fibrillation | 10165 (14.8%) | 3964 (13.8%) |
| Coronary Artery Disease | 19690 (28.7%) | 8453 (29.5%) |
| Heart Failure | 11914 (17.3%) | 4771 (16.6%) |
| Academic Center | 42257 (61.5%) | 17838 (62.2%) |
| U.S. Region | ||
| Northeast | 8958 (13.0%) | 3835 (13.4%) |
| Southeast | 17220 (25.1%) | 7134 (24.9%) |
| Midsouth | 15892 (23.1%) | 6558 (22.9%) |
| Central | 10504 (15.3%) | 4392 (15.3%) |
| West | 15547 (22.6%) | 6503 (22.7%) |
| Other | 552 (0.8%) | 256 (0.9%) |
| Center Advanced Liver Disease Dashboard Usage | ||
| Not Using | 2009 (7.0%) | |
| Intermittent Use | 5897 (20.6%) | |
| Routine Use | 20772 (72.4%) |
Patterns of cirrhosis healthcare utilization and HCC surveillance
Figure 1, panels A-D, provide cohort clinical outcomes, healthcare utilization, and HCC surveillance for 24 months extending through the COVID-19 pandemic. Crude monthly mortality (Panel A) was approximately 1% with numerical increases noted at months 7–8 and 12–13. These observed increases in monthly mortality trended towards but did not reach statistical significance in linear regression relative to the surrounding baseline, accounting for secular trends (i.e., months 12–13, β 0.24, 95% CI −0.02 – 0.50, p=0.07; and months 7–8, β 0.12, 95% CI −0.15 – 0.38, p=0.37, each relative to other months; Supplemental Table 1).
Figure 1.

Cohort clinical outcomes, healthcare utilization and HCC Surveillance during the COVID-19 pandemic
Panel A shows crude monthly mortality rates from 1/1/20 to 12/31/21
Panel B shows the percent visit type, in-person versus telemedicine, superimposed on the monthly visit volume
Panel C shows total monthly hospitalization rates among patients with cirrhosis, percent attributable to COVID-19 infection, and U.S. COVID-19 cases during the study period
Panel D shows the monthly percent of the cohort that was up to date with HCC surveillance during the study period
Outpatient PCP and GI/HEP appointment utilization are shown in Panel B. In the early months of the pandemic the monthly percent of the VOCAL cohort with outpatient appointments dropped from about 30% in months 1–2 (representing the period prior to the initial public health emergency with shelter-in-place (SIP) orders) to about 7% (month 4–5). During this time, telemedicine visits rose to a peak of 20% of patients receiving telemedicine visits early in the pandemic, however, this use tapered to less than 10% in the second year of the pandemic. There were approximately 22,000 monthly visits in the initial SIP period (months 2–3) with noted decline early in the pandemic. There was an observed rebound of visit volumes by months 9 and 10 and a notable peak of outpatient visits in months 14 and 15 coinciding with about the 1-year anniversary of the first wave of the pandemic and occurring shortly after the spike in U.S. COVID-19 cases in early 2021. Changing trends in outpatient visits were statistically significant in linear regression analysis (Supplemental Table 1), with the percentage of cohort in-person visits declining 7.0% per month (beta −7.0, 95% CI −11.4 – −2.6, p=0.003) through month 4 of follow-up, and gradually rising 1.1% per month thereafter (β 1.13, 95% CI 0.75 – 1.52, p<0.001). Inverse trends were noted with telemedicine visits, with a 4.9% monthly increase through month 4 (β 4.92, 95% CI 3.54 – 6.30, p<0.001) with gradual decline thereafter (β −0.67, 95% CI −0.79 – −0.55, p<0.001).
Cohort rates of cirrhosis hospitalization (Panel C) were reduced from about 6% to 3% early in the pandemic and have remained at 3–4% subsequently. In linear regression analysis, there were significant changes in hospitalization trends during the follow-up period (interaction p<0.001): a substantial decline in rates from months 1–4 (β −0.76, 95% CI −1.00 – −0.52), rebound from months 5–7 (β 0.27, 95% CI −0.11 – 0.65), and gradual decline thereafter (−0.01, 95% CI −0.04 – 0.02; Supplemental Table 1). The proportion of hospitalizations attributable to COVID-19 followed spikes in U.S. COVID-19 cases.
With regards to HCC surveillance with the PTUDS measure, 70% of Veterans were up to date with HCC surveillance immediately prior to the pandemic (panel D shows PTUDS by geographic region); there was an early-pandemic nadir to about 50% with a rebound to approximately 60% which has remained lower than pre-pandemic levels. There was notable regional variation in PTUDS throughout the study period. In linear regression analysis, there were significant changes in the overall PTUDS trends during the follow-up period; monthly rates significantly declined from months 1–6 (beta −3.89, 95% CI −4.48 – −3.29, p<0.001), remained flat in months 7–8 (beta 0.05, 95% CI −3.49 – 3.58, p=0.98), and gradually increased thereafter (beta 0.52, 95% CI 0.39 – 0.66, p<0.001; Supplemental Table 1).
Outpatient visits, clinical and health-system factors associated with HCC surveillance
Models evaluating the associations between outpatient visit modality (in-person, telemedicine) as well as specialty are shown in Table 2. Model 1 shows associations with visit type and model 2 adjusts for demographics, clinical, and health-system factors. In model 1 there was a positive association between each GI/HEP visit and HCC surveillance with a stronger association noted for GI/HEP in-person visits (β 3.29, 95% CI 2.94 – 3.65) and a positive association with GI/HEP telemedicine visits (β 2.23, 95% CI 1.95–2.41). No significant associations were observed between PCP visits and HCC surveillance. Results were similar in model 2 (adjusted model); GI/HEP telemedicine: (β 2.13, 95% CI 1.85 – 2.41); GI/HEP in-person (β 3.22, 95% CI 2.87 – 3.57). Factors associated with lower HCC surveillance were “Other” race/ethnicity relative to White (β −3.12, 95% CI −10.32 - −5.60), coronary artery disease (β−1.04, 95% CI −2.00 - −0.09), and a modest inverse association with higher MELD scores. HCV and HBV liver disease etiologies, CTP B (vs. CTP A; [β 6.68, 95% CI 4.94 – 8.41]) and receiving care at an academic center (β 4.86, 95% CI 3.99 – 5.74) were associated with higher HCC surveillance. The facility-level factor most strongly associated with higher HCC surveillance was cirrhosis dashboard use (intermittent use vs. no use: β 5.66, 95% CI 3.83 – 7.48; routine use vs. no use β 8.51, 95% CI 6.86 – 10.17).
Table 2 –
Multivariable Linear Regression Models for Percentage of Time Up to Date with HCC Surveillance
| Model 1 | Model 2 | |||
|---|---|---|---|---|
| Coefficient (95% CI) | p-value | Coefficient (95% CI) | p-value | |
| GI/Hep Telemed * | 2.23 (1.95 – 2.51) | <0.001 | 2.13 (1.85 – 2.41) | <0.001 |
| GI/Hep In-person * | 3.29 (2.94 – 3.65) | <0.001 | 3.22 (2.87 – 3.57) | <0.001 |
| PCP Telemed * | 0.27 (−0.03 – 0.58) | 0.08 | 0.22 (−0.09 – 0.52) | 0.17 |
| PCP In-person * | −0.15 (−0.37 – 0.06) | 0.16 | −0.11 (−0.33 – 0.10) | 0.29 |
| Age (per year) | 0.05 (−0.01 – 0.10) | 0.11 | ||
| Race/Ethnicity | ||||
| White | (ref) | |||
| Black | 0.99 (−0.08 – 2.07) | 0.07 | ||
| Hispanic | 0.60 (−0.96 – 2.16) | 0.45 | ||
| Asian | 6.22 (2.63 – 9.80) | 0.001 | ||
| Other | −3.10 (−4.75 – −1.45) | <0.001 | ||
| Diabetes | 3.12 (2.24 – 4.00) | <0.001 | ||
| Coronary Artery Disease | −1.04 (−2.00 – −0.09) | 0.03 | ||
| Etiology | ||||
| Hepatitis C virus (HCV) | (ref) | |||
| Hepatitis B virus | 9.37 (5.72 – 13.01) | <0.001 | ||
| Alcohol-related liver disease (ALD) | −6.18 (−7.35 – −5.02) | <0.001 | ||
| HCV+ALD | −3.33 (−4.57 – −2.10) | <0.001 | ||
| Non-alcoholic fatty liver disease | −5.67 (−6.90 – −4.43) | <0.001 | ||
| Other | −7.96 (−10.32 – −5.60) | <0.001 | ||
| MELD-Na | −0.33 (−0.44 – −0.23) | <0.001 | ||
| CTP Class | ||||
| A | (ref) | |||
| B | 6.68 (4.94 – 8.41) | <0.001 | ||
| Academic Center | 4.86 (3.99 – 5.74) | <0.001 | ||
| Center Advanced Liver Disease Dashboard Usage | ||||
| Not Using | (ref) | |||
| Intermittent Use | 5.66 (3.83 – 7.48) | <0.001 | ||
| Routine Use | 8.51 (6.86 – 10.17) | <0.001 | ||
Per appointment per 6 months
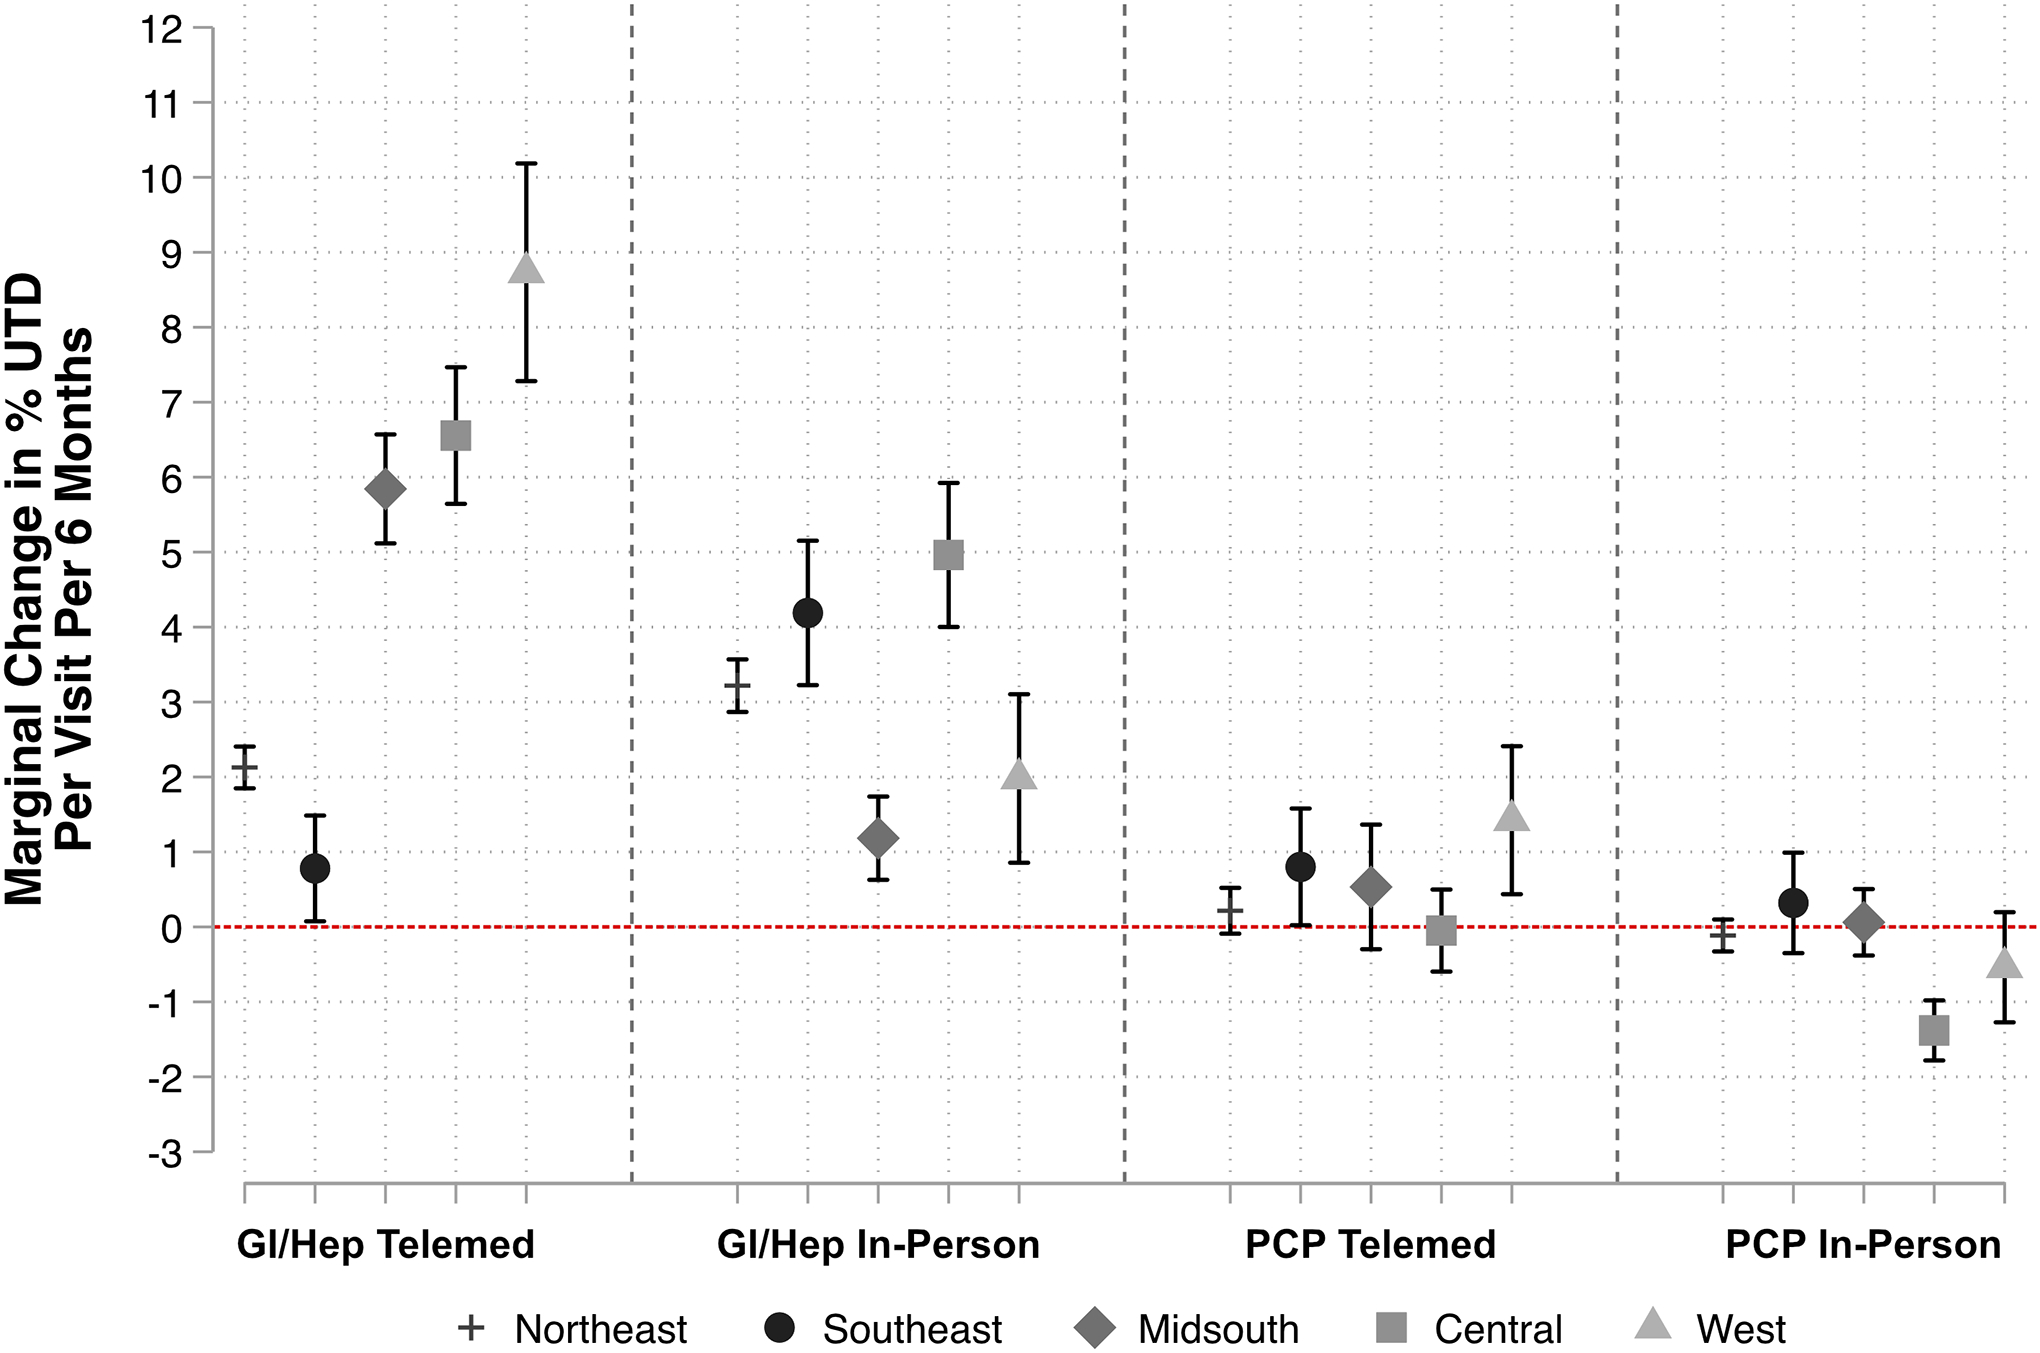
In a secondary analysis, the strength of association between GI/HEP telemedicine varied by U.S. region, with the strongest associations noted in the West, Central, and Midsouth regions, and minimal impact in the Southeast (Figure 2).
Figure 2 –

Association between Incremental Visits and Changes in Percent Time Up to Date (UTD), Stratified by U.S. Region
Finally, in a secondary analysis to practically highlight how center-level factors may affect PTUDS, adjusted PTUDS is computed for a hypothetical scenario of a Veteran of Black race with HCV cirrhosis, diabetes, MELD-Na 20, and CTP Class B with results shown in Figure 3. PTUDS is stratified by dashboard use (Panel A, generated from model 2) as well as dashboard use and academic center (Panel B, generated from model 2 with additional interaction between U.S. region and dashboard use, interaction p<0.001). Relative to no use, intermittent and routine dashboard use would increase PTUDS in a stepwise fashion for this hypothetical scenario (from 46.3% [95% CI 43.9–48.7] no use to 55.5% [95% CI 53.6–57.3] routine use; Panel A). For this same scenario in the interaction model, dashboard use would increase PTUDS by a larger magnitude at a non-academic relative to an academic center (Panel B). Of note, dashboard significantly varied by U.S. region (Table 3, p<0.001). In particular, the regions corresponding to the highest and lowest PTUDS at the end of the follow-up period (Figure 1D) demonstrated the highest and lowest routine dashboard use (92.8% Central vs. 59.6% Northeast, p<0.001).
Figure 3 –
Adjusted Association between Center-Level Advanced Liver Disease Dashboard Usage and Percent of Time Up to Date with HCC Surveillance in (A) Model 2 and (B) Interaction Model with Academic Center Status*
* In both models, estimates were computed for a hypothetical Black patient with hepatitis C virus-related cirrhosis, diabetes, MELD-Na 20, Child-Pugh class B. All other model variables are held at mean values.
Table 3 –
Association between Dashboard Use and United States Region*
| U.S. Region | Not Using | Intermittent Use | Routine Use | Total |
|---|---|---|---|---|
| Northeast | 28 (0.7%) | 1,520 (39.6%) | 2,287 (59.6%) | 3,835 |
| Southeast | 1,385 (19.4%) | 863 (12.1%) | 4,886 (68.5%) | 7,134 |
| Midsouth | 165 (2.5%) | 2,424 (37.0%) | 3,969 (60.5%) | 6,558 |
| Central | 182 (4.1%) | 133 (3.0%) | 4,077 (92.8%) | 4,392 |
| West | 249 (3.8%) | 861 (13.2%) | 5,393 (82.9%) | 6,503 |
Chi-square p<0.001 for association between U.S. region and dashboard use
Discussion
This study of national VHA data details the longer-term impact of the COVID-19 pandemic on cirrhosis care delivery with several key findings. We show that outpatient visit volume remained stable throughout the pandemic with a rapid scale-up of telemedicine that gradually regressed to pre-pandemic levels. Moreover, loss to follow-up was quite low. Mortality remained stable at pre-pandemic levels with brief rises possibly attributable to COVID-19 (both directly and due to downstream disruption) prior to vaccine availability. Hospitalizations for patients with cirrhosis had an early decline and then remained stable relative to pre-pandemic levels, whereas COVID-19-related hospitalizations dropped relative to COVID-19 case counts following vaccine availability. Finally, we found that HCC surveillance rates have initially declined, but have nearly returned to pre-pandemic levels with geographic disparities explained in part by utilization of the national cirrhosis quality dashboard. These findings highlight how an integrated system of care has weathered massive shifts in care delivery and has maintained access to care and adherence to HCC surveillance, key quality metrics for cirrhosis.
HCC Surveillance Rates Express the Effectiveness of VA Cirrhosis Care
HCC surveillance is a guideline-recommended, high priority focus of cirrhosis care delivery.(4) Evidence of consistent HCC surveillance is a complex function that integrates several implicit factors: systems to track candidates and completion, timely orders for imaging, and coordination of screening visits including scheduling and transportation. First, we find that Veterans complete surveillance at high rates. Meta-analyses have found pooled rates of HCC surveillance range from only about 10% in population-based studies to 30% for cohort-based studies.(17, 20) Though VA HCC surveillance rates fell to 50–60% early in the pandemic from 70%, they quickly rebounded and continue to exceed rates among those receiving care in most other healthcare settings in the U.S.(21)
We find that patient and center-related factors explain substantial portions of observed HCC surveillance rates. Key factors include outpatient access to subspecialty clinics, in-person and via telemedicine, routine use of the Advanced Liver Disease Dashboard, and disease etiology. While persons with hepatitis B are more likely to undergo surveillance, those with ALD are less likely, underscoring the role of social determinants of health affecting adherence to surveillance. As shown in Figure 2, even after standardizing patient factors, there was a clear dose-dependent increase in HCC surveillance rates commensurate with dashboard utilization. The dashboard was developed with the intention of tracking process measures for quality improvement (QI) and these data demonstrate its impact is robust to the impact of the pandemic. Furthermore, these data show that utilization of the dashboard is directly linked to the outcome for which it was intended. The impact of dashboard use, however, is clear evidence of the dividends paid from VHA investment in centralized QI efforts.(11, 22) The VHA has a coordinated population-based approach across 127 VA facilities with established Hepatic Innovations Teams (HITs) led by teams of experts in system redesign, facilitators, and expert clinicians. HIT leaders routinely internally assess VA implementation strategies and work towards continuous process improvement.(10, 11) The HITs host monthly didactic conferences to help frontline clinicians stay current with liver-disease best practices and evidence-based guidelines. Such initiatives serve as an aspirational models for other health systems and practices.
Translating VA Best Practices to Other Systems of Care
Recent work by Yakovchenko et al., identified effective strategies to improve delivery of evidence-based care for cirrhosis. These included participation in national learning initiatives, use of clinical dashboards in at-risk populations (e.g., HCC surveillance for cirrhosis), direct patient outreach, collaborative care with experts, didactic training for local clinicians, clinical reminders, tailoring tools to specific environments and rapid cycle innovation. Other integrated health systems such as Kaiser have formed groups to focused on care delivery research and practice in hepatology. (23) Outside of integrated health systems, some QI efforts have been driven by large EMR vendors in collaboration with practicing clinicians by forming specialty steering boards to improve data capture and the EMR experience for specific conditions.(24) Nevertheless, sustainable QI has many challenges; most clinicians do not have protected time for QI and lack formal training. The EMR is a perceived source of burnout and after-hours work, therefore, additional alerts without consideration of design and implementation may compromise rather than improve care. (25) Small practices may not have sufficient resources or infrastructure to focus on QI initiatives. Despite the challenges, best practices for cirrhosis care (e.g., population health management, timely access to specialty care) have been identified and may be disseminated by national societies by including specific tools, checklists, diagnosis codes, and implementation strategies. Formalized clinician training in QI methodology such as Six Sigma or Lean can improve care delivery and efficiency. Health systems should allot resources to sustainable QI initiatives and training.
Improved and Stable Clinical Outcomes During the Pandemic
We find that while overall mortality remained constant, there was a divergence in COVID-19 cases and hospitalizations in the post-vaccine era, outpatient visits remained stable, and total hospitalizations decreased. While numerous factors account for these observations, they each support the broad conclusion that the VA was able to provide effective outpatient care, protecting Veterans from COVID-19 and reducing the burden of inpatient cirrhosis care.
Contrasting Expected and Observed Outcomes
As the pandemic emerged, it was assumed that reduced outpatient services and delayed care would have long-lasting and deleterious impacts on cirrhosis outcomes. Our early data showed that cirrhosis hospitalizations declined precipitously,(1) as did rates of HCC surveillance.(2) At the same time, in-person outpatient visits declined while telemedicine visits rose rapidly.(12) These factors were felt to increase the risk of mortality for patients with decompensated cirrhosis and HCC while the use of telemedicine was poised to increase substantially and durably.(5) In contrast, we find that overall mortality was stable despite reductions in hospitalizations and after telemedicine utilization fell to pre-pandemic levels. It is unknown from these data whether rates of early detection of HCC were reduced by the interruption of surveillance activities and may be the subject of future research. On balance, however, in the context of the VA, care delivery largely returned to pre-pandemic patterns. Although we did not directly investigate COVID-19 vaccination’s impact on outcomes, our team and others have shown that vaccination was more likely among older Veterans with and without cirrhosis and among those with multiple comorbidities, thus potentially offsetting the “would-be” expected increases in mortality.(26–28)
Contextual factors
These data must be interpreted in the context of the study design. Results from an integrated healthcare system may not generalize to other healthcare settings, however, we highlight how care implementation strategies at an integrated system may serve as a model for other healthcare settings. We evaluated HCC surveillance outcomes among Veterans who received routine care in 2019 and, therefore, were regular VA users – our results may not apply to those with intermittent follow-up. We did not capture data on outpatient visits and imaging outside the VA, therefore, access to subspecialty care and HCC surveillance may be higher than reported. We did not capture how various other implementation strategies, e.g., use of electronic health record, clinical reminders, formal and informal expert consultation, and other care delivery strategies may impact HCC surveillance and other quality measures for cirrhosis. We evaluated structured data only and thus were not able to capture additional factors like advanced liver disease knowledge, coordination of care with primary care or the community, and issues such as staffing and turnover that could impact care delivery. Finally, the methodology for capturing HCC surveillance may have differed than what is currently used for internal VHA QI efforts with regards to the eligible patient denominator and surveillance time windows.
Conclusion
The COVID-19 pandemic led to major short-term disruptions in access to care for cirrhosis and in HCC surveillance. Most recently, care has returned to pre-pandemic levels highlighting the coordinated efforts of the VA hepatic innovation teams and benefits of receiving care in an integrated health system.
Supplementary Material
Acknowledgements:
We would like to thank Karine B. Rozenberg, PharmD, Hepatitis Program Manager and Dashboard Development at Veterans Administration, for her assistance with the cirrhosis dashboard data.
Funding/Grant Support:
Marina Serper is supported by the National Institute of Diabetes and Digestive and Kidney Diseases, award #1K23DK115897. This project was supported by a pilot grant from the Leonard Davis Institute of Health Economics, University of Pennsylvania, Philadelphia, PA. Nadim Mahmud is supported by the National Institute of Diabetes and Digestive and Kidney Diseases (K08-DK124577).
Abbreviations:
- CI
confidence interval
- COVID-19
coronavirus disease-2019
- LOS
length of stay
- MELD
model for end-stage liver disease
- SIP
shelter-in-place
- VHA
Veterans Health Administration
- VOCAL
Veterans Outcomes and Costs Associated with Liver Disease
Footnotes
Disclosures: The authors have no conflicts as relevant to this manuscript to report.
References
- 1.Mahmud N, Hubbard RA, Kaplan DE, Serper M. Declining Cirrhosis Hospitalizations in the Wake of the COVID-19 Pandemic: A National Cohort Study. Gastroenterology 2020;159:1134–1136 e1133. [DOI] [PMC free article] [PubMed] [Google Scholar]
- 2.Mahmud N, Kaplan DE, Goldberg DS, Taddei TH, Serper M. Changes in Hepatocellular Carcinoma Surveillance and Risk Factors for Noncompletion in the Veterans Health Administration Cohort During the Coronavirus Disease 2019 Pandemic. Gastroenterology 2021;160:2162–2164.e2163. [DOI] [PMC free article] [PubMed] [Google Scholar]
- 3.Serper M, Shaked A, Olthoff KM, Hoteit M, Appolo B, Reddy KR. A local response to COVID-19 for advanced liver disease: Current model of care, challenges and opportunities. J Hepatol 2020;73:708–709. [DOI] [PMC free article] [PubMed] [Google Scholar]
- 4.Serper M, Kaplan DE, Shults J, Reese PP, Beste LA, Taddei TH, Werner RM. Quality Measures, All-Cause Mortality, and Health Care Use in a National Cohort of Veterans With Cirrhosis. Hepatology 2019;70:2062–2074. [DOI] [PMC free article] [PubMed] [Google Scholar]
- 5.Tapper EB, Asrani SK. COVID-19 pandemic will have a long-lasting impact on the quality of cirrhosis care. Journal of hepatology 2020. [DOI] [PMC free article] [PubMed] [Google Scholar]
- 6.VA Corporate Data Warehouse (CDW), https://www.hsrd.research.va.gov/for_researchers/vinci/cdw.cfmm, Accessed April 1st, 2022.
- 7.Kaplan DE, Dai F, Aytaman A, Baytarian M, Fox R, Hunt K, Knott A, et al. Development and performance of an algorithm to estimate the Child-Turcotte-Pugh score from a national electronic healthcare database. Clinical Gastroenterology and Hepatology 2015;13:2333–2341. e2336. [DOI] [PMC free article] [PubMed] [Google Scholar]
- 8.Mahmud N, Kaplan DE, Taddei TH, Goldberg DS. Incidence and mortality of acute‐on‐chronic liver failure using two definitions in patients with compensated cirrhosis. Hepatology 2019;69:2150–2163. [DOI] [PMC free article] [PubMed] [Google Scholar]
- 9.Goldberg D, Lewis J, Halpern S, Weiner M, Lo Re V 3rd. Validation of three coding algorithms to identify patients with end-stage liver disease in an administrative database. Pharmacoepidemiol Drug Saf 2012;21:765–769. [DOI] [PMC free article] [PubMed] [Google Scholar]
- 10.Yakovchenko V, Morgan TR, Miech EJ, Neely B, Lamorte C, Gibson S, Beste LA, et al. Core implementation strategies for improving cirrhosis care in the Veterans Health Administration. Hepatology 2022. [DOI] [PMC free article] [PubMed] [Google Scholar]
- 11.Rogal SS, Yakovchenko V, Gonzalez R, Park A, Beste LA, Rozenberg-Ben-Dror K, Bajaj JS, et al. The Hepatic Innovation Team Collaborative: A Successful Population-Based Approach to Hepatocellular Carcinoma Surveillance. Cancers (Basel) 2021;13. [DOI] [PMC free article] [PubMed] [Google Scholar]
- 12.Mahmud N, Goldberg DS, Kaplan DE, Serper M. Major Shifts in Outpatient Cirrhosis Care Delivery Attributable to the COVID-19 Pandemic: A National Cohort Study. Hepatology Communications;n/a. [DOI] [PMC free article] [PubMed] [Google Scholar]
- 13.O’Leary JG, Greenberg CS, Patton HM, Caldwell SH. AGA Clinical Practice Update: Coagulation in Cirrhosis. Gastroenterology 2019;157:34–43 e31. [DOI] [PubMed] [Google Scholar]
- 14.Marrero JA, Kulik LM, Sirlin CB, Zhu AX, Finn RS, Abecassis MM, Roberts LR, et al. Diagnosis, Staging, and Management of Hepatocellular Carcinoma: 2018 Practice Guidance by the American Association for the Study of Liver Diseases. Hepatology 2018;68:723–750. [DOI] [PubMed] [Google Scholar]
- 15.Asrani SK, Ghabril MS, Kuo A, Merriman RB, Morgan T, Parikh ND, Ovchinsky N, et al. Quality measures in HCC care by the Practice Metrics Committee of the American Association for the Study of Liver Diseases. Hepatology 2021. [DOI] [PubMed] [Google Scholar]
- 16.Goldberg DS, Taddei TH, Serper M, Mehta R, Dieperink E, Aytaman A, Baytarian M, et al. Identifying barriers to hepatocellular carcinoma surveillance in a national sample of patients with cirrhosis. Hepatology 2017;65:864–874. [DOI] [PubMed] [Google Scholar]
- 17.Wolf E, Rich NE, Marrero JA, Parikh ND, Singal AG. Use of Hepatocellular Carcinoma Surveillance in Patients With Cirrhosis: A Systematic Review and Meta-Analysis. Hepatology 2021;73:713–725. [DOI] [PMC free article] [PubMed] [Google Scholar]
- 18.Serper M, Kaplan DE, Lin M, Taddei TH, Parikh ND, Werner RM, Tapper EB. Inpatient Gastroenterology Consultation and Outcomes of Cirrhosis-Related Hospitalizations in Two Large National Cohorts. Dig Dis Sci 2021. [DOI] [PMC free article] [PubMed] [Google Scholar]
- 19.Heimbach JK, Kulik LM, Finn RS, Sirlin CB, Abecassis MM, Roberts LR, Zhu AX, et al. AASLD guidelines for the treatment of hepatocellular carcinoma. Hepatology 2018;67:358–380. [DOI] [PubMed] [Google Scholar]
- 20.Wolf E, Rich NE, Marrero JA, Parikh ND, Singal AG. Use of hepatocellular carcinoma surveillance in patients with cirrhosis: a systematic review and meta‐analysis. Hepatology 2021;73:713–725. [DOI] [PMC free article] [PubMed] [Google Scholar]
- 21.Abara WE, Spradling P, Zhong Y, Moorman A, Teshale EH, Rupp L, Gordon SC, et al. Hepatocellular Carcinoma Surveillance in a Cohort of Chronic Hepatitis C Virus-Infected Patients with Cirrhosis. Journal of gastrointestinal cancer 2020;51:461–468. [DOI] [PMC free article] [PubMed] [Google Scholar]
- 22.Tapper EB, Parikh ND. The Future of Quality Improvement for Cirrhosis. Liver Transpl 2021. [DOI] [PMC free article] [PubMed] [Google Scholar]
- 23.Permanente Kaiser, Delivery Science and Applied Research, https://deliveryscience-appliedresearch.kaiserpermanente.org/specialty-research-networks/hepatology, Accessed August 15th, 2022.
- 24.Weathers AL, Haq IU, Ficker DM, Ney JP, Meyers SL. Neurology steering board effects change for a major electronic health record vendor. Neurol Clin Pract 2019;9:360–364. [DOI] [PMC free article] [PubMed] [Google Scholar]
- 25.Eschenroeder HC Jr, Manzione LC, Adler-Milstein J, Bice C, Cash R, Duda C, Joseph C, et al. Associations of physician burnout with organizational electronic health record support and after-hours charting. Journal of the American Medical Informatics Association 2021;28:960–966. [DOI] [PMC free article] [PubMed] [Google Scholar]
- 26.John BV, Deng Y, Schwartz KB, Taddei TH, Kaplan DE, Martin P, Chao H-H, et al. Postvaccination COVID-19 infection is associated with reduced mortality in patients with cirrhosis. Hepatology;n/a. [DOI] [PMC free article] [PubMed] [Google Scholar]
- 27.Mahmud N, Chapin SE, Kaplan DE, Serper M. Identifying Patients at Highest Risk of Remaining Unvaccinated Against Severe Acute Respiratory Syndrome Coronavirus 2 in a Large Veterans Health Administration Cohort. Liver Transpl 2021;27:1665–1668. [DOI] [PMC free article] [PubMed] [Google Scholar]
- 28.Ioannou GN, Green P, Locke ER, Berry K. Factors associated with early receipt of COVID-19 vaccination and adherence to second dose in the Veterans Affairs healthcare system. PLoS One 2021;16:e0259696. [DOI] [PMC free article] [PubMed] [Google Scholar]
Associated Data
This section collects any data citations, data availability statements, or supplementary materials included in this article.