

Abstract
Losses and malformations of cranial neural crest cell (cNCC) derivatives are a hallmark of several common brain and face malformations. Nevertheless, the etiology of these cNCC defects remains unknown for many cases, suggesting a complex basis involving interactions between genetic and/or environmental factors. However, the sheer number of possible factors (thousands of genes and hundreds of thousands of toxicants) has hindered identification of specific interactions. Here, we develop a high‐throughput analysis that will enable faster identification of multifactorial interactions in the genesis of craniofacial defects. Zebrafish embryos expressing a fluorescent marker of cNCCs (fli1:EGFP) were exposed to a pathway inhibitor standard or environmental toxicant, and resulting changes in fluorescence were measured in high‐throughput using a fluorescent microplate reader to approximate cNCC losses. Embryos exposed to the environmental Hedgehog pathway inhibitor piperonyl butoxide (PBO), a Hedgehog pathway inhibitor standard, or alcohol (ethanol) exhibited reduced fli1:EGFP fluorescence at one day post fertilization, which corresponded with craniofacial defects at five days post fertilization. Combining PBO and alcohol in a co‐exposure paradigm synergistically reduced fluorescence, demonstrating a multifactorial interaction. Using pathway reporter transgenics, we show that the plate reader assay is sensitive at detecting alterations in Hedgehog signaling, a critical regulator of craniofacial development. We go on to demonstrate that this technique readily detects defects in other important cell types, namely neurons. Together, these findings demonstrate this novel in vivo platform can predict developmental abnormalities and multifactorial interactions in high‐throughput.
Keywords: birth defect, high‐throughput screening, multifactorial interactions, neural crest, teratogen, toxicology, zebrafish
Abbreviations
- BL
body length
- BMS
BMS‐833923 (Shh pathway inhibitor)
- cNCCs
cranial neural crest cells
- dpf
days post fertilization
- EL
ethmoid plate length
- ETOH
ethanol/alcohol
- hpf
hours post fertilization
- ITW
inter‐trabeculae width
- PBO
piperonyl butoxide
- RFU
relative fluorescent units
- SEM
standard error of mean
- Shh
sonic hedgehog
- TL
trabecula length
1. INTRODUCTION
Birth defects are the leading cause of infant mortality (Matthews, MacDorman, & Thoma, 2015), affecting 2%–4% of live births (Harris et al., 2017). The majority of human birth defects are thought to be of unknown causes. Estimates vary from 43% (Nelson & Holmes, 1989) to 80% (Feldkamp, Carey, Byrne, Krikov, & Botto, 2017) to 91% (Yang et al., 2022). It is important to note, however, that the Feldkamp paper points out that the lower 43% figure categories a large number of defects as being of known etiology when they would better be classified as unknown. Thus, it is likely safe to say that a large majority of birth defects are of unknown etiology. This high rate of unknown etiology is in part due to the very large number of genetic and environmental factors (>80,000 untested EPA‐registered chemicals [Krewski et al., 2010]) that may cause developmental defects but which have not been adequately examined. Complicating matters, researchers have hypothesized that birth defects often result from an interplay between these genetic and environmental factors (reviewed in [Beames & Lipinski, 2020; Brent, 2004; Krauss & Hong, 2016]). These multifactorial interactions exponentially increase the number of potential causes that require study. Current screening methods are insufficient to test such a vast number of combinations (Krewski et al., 2010).
Among the most common of birth defects are those disrupting development of the craniofacial skeleton (Mai et al., 2019; Parker et al., 2010). Unsurprisingly, most craniofacial birth defects involve abnormal development of the cells that give rise to the craniofacial tissues, the cranial neural crest cells (cNCCs). The cNCCs are a transient developmental cell population that form along the dorsal margins of the neural folds (Dupin, Creuzet, & Le Douarin, 2006). Following epithelial–mesenchymal transition (EMT), these cells migrate ventrally to populate the facial primordia, where they give rise to the craniofacial bones and cartilages (Minoux & Rijli, 2010; Roth, Bayona, Baddam, & Graf, 2021). These cNCC‐derivatives form improperly in the context of craniofacial birth defects. Thus, we hypothesized that quantifying changes in a cNCC marker could provide a fidelitous method for early detection of craniofacial birth defects. Such a model would enable higher throughput testing to identify multifactorial interactions that can cause craniofacial defects.
The zebrafish provides the ideal model for these studies. Zebrafish embryos develop externally and are optically clear. A large number of transgenic zebrafish lines are available that label various cell types of interest, including cNCCs. This means that the fluorescence from live zebrafish embryos can be imaged (or read) to measure cNCC development in vivo and in situ in a 96‐well format.
Here, we develop a novel platform for rapid detection of craniofacial birth defects. Using transgenic zebrafish with fluorescently‐labeled cNCCs (fli1:EGFP), we found that reporter fluorescence can be used to accurately and sensitively measure cellular changes, which predict later craniofacial malformations. We observed dose‐dependent disruptions of the cNCCs at 26 h post fertilization (hpf) by either alcohol alone or in combination with the environmental hedgehog pathway inhibitor piperonyl butoxide (PBO) from 6–24 hpf. Reduced fluorescence readings corresponded with malformations measured at five days post fertilization. We go on to demonstrate that this technique is useful for detecting alterations to signaling pathway activity and disruptions to other sensitive cell types, such as neurons. Together, this work demonstrates the feasibility of using a plate reader to monitor development, paving the way for the high‐throughput analyses required to better understand the origin of human birth defects.
2. METHODS
2.1. Animals
This study was conducted in accordance with the recommendations in The Zebrafish Book, fifth edition (Westerfield, 1993), and the Guide for the Care and Use of Laboratory Animals of the National Institutes of Health. The protocol was approved by the University of Texas at Austin Institutional Animal Care and Use Committee. Zebrafish embryos were generated by outcrossing homozygous fli1:EGFP (ZDB‐ALT‐011017‐8, [Roman et al., 2002]), sox10:EGFP (ZDB‐ALT‐050913‐4, [Whitlock, Smith, Kim, & Harden, 2005]), 8xGliBS:mCherry (ZDB‐ALT‐141030‐1, [Mich, Payumo, Rack, & Chen, 2014]), or elavl3:eGFP (ZDB‐ALT‐060301‐2, [Park et al., 2000]) (all maintained on an AB background) zebrafish with wild‐type AB animals (ZDB‐GENO‐960809‐7). This generated clutches 100% heterozygous for the transgene. Embryonic developmental staging was determined using previously defined morphological features (Kimmel, Ballard, Kimmel, Ullmann, & Schilling, 1995). At six hpf, embryos were split into groups of 30 embryos each for chemical exposure.
2.2. Chemical exposure
Embryos were exposed in 30 mm petri dishes (Figure 1a). For alcohol exposures, absolute ethanol was dissolved in embryo media (Westerfield, 1993) at the indicated final media concentrations (0.75%, 1%, 1.25%, 1.5% and 2%). Previous studies have found between 25% and 35% of the alcohol in the media is taken up by the embryo (Flentke, Klingler, Tanguay, Carvan, & Smith, 2014; Lovely, Nobles, & Eberhart, 2014; Zhang, Ojiaku, & Cole, 2013). Specifically, we found a 1% dose of ethanol resulted in 41 mM tissue concentration (Lovely et al., 2014), which is roughly equivalent to 0.2% blood alcohol concentration (BAC). Thus, these doses represent human binge doses. However, a 1% dose of ethanol does not cause significant craniofacial defects in zebrafish and is, therefore, considered sub‐teratogenic (Everson, Batchu, & Eberhart, 2020; Swartz et al., 2014; Swartz, Lovely, McCarthy, Kuka, & Eberhart, 2020). Chemical inhibitors were first dissolved in dimethyl sulfoxide (DMSO) to make stocks at 100 mM in 100% DMSO which were stored at −20 °C for up to six months. On the day of exposure, a 100 mM stock was diluted with embryo media to make a fresh 1 mM solution with 1% DMSO. Finally, this 1 mM, 1% DMSO stock solution was further dissolved in embryo media to the indicated final media concentrations (1.56, 3.125, 6.25, 12.5, 25, and 50 μM). DMSO concentrations were matched between treatments within an experiment. The maximum final DMSO concentration was 0.05%. PBO, 5‐[2‐(2‐butoxyethoxy)ethoxymethyl]‐6‐propyl‐1,3‐benzodioxole, CAS# 51–03‐6, was obtained from Toronto Research Chemicals (Toronto, ON). The Sonic Hedgehog (Shh) pathway inhibitor standard BMS‐833923, CAS# 1059734–66‐5, was obtained from MedChem Express (Monmouth Junction, NJ).
FIGURE 1.

Experimental timeline. (a) Embryos were exposed from 6 to 24 hpf in petri dishes. (b) At 24 hpf, embryos were manually removed from their chorions and loaded into individual wells of a 96‐well plates. (c) At 26 hpf, embryos were scanned and imaged in vivo on a plate reader. (d) Embryos were then developed to 5 dpf, upon which time embryos were euthanized, fixed, stained, imaged, and finally morphologically measured. hpf = hours post fertilization, dpf = days post fertilization
2.3. Plate reader scanning and imaging
At 24 hpf, media were replaced with clean embryo media. Thus, chemical exposures spanned 6–24 hpf (gastrulation through pharyngula stage). Embryos were then dechorionated and loaded one per well into a 96‐well clear, flat bottom plates (Falcon 96 Well Black with Clear Flat Bottom TC‐Treated Imaging Plate with Lid Fisher Scientific 08–772‐225) in 75 μl of embryo media (Figure 1b). Clove oil, an anesthetic, was then added at a final concentration of 0.1 mg/mL to ensure the embryos do not move during scanning. This is critical, as movement risks the embryo being scanned more than once in the 5 × 5 matrix scan, which would artificially increase the measured signal. At 26 hpf, plates were scanned on a BioTek (now owned by Agilent) Cytation 5 (Santa Clara, CA) multimode reader (Figures 1c, 2a). Each well was scanned in a 5 × 5 matrix array, creating read values for 25 total regions for each well of the 96‐well microplate.
FIGURE 2.

Plate reader data analysis. (a) Heatmaps show the area scan results for a single 96‐well plate. Treatment groups were as follows: (rows A + B = Control, C + D = 1% ETOH, E + F = 1.5% ETOH, G + H = 2% ETOH. (b) For each well, 25 single regions were scanned in a 5 × 5 matrix. These 25 per‐well reads were thresholded to remove background fluorescence and target fluorescence from the head (see methods). (c) Fluorescence that met or exceeded the threshold value were summed to generate a cumulative well measurement for each embryo. ETOH = ethanol
2.4. Plate reader parameters and protocol
Plate type: Falcon Clear Flat Bottom 96‐Well Plate, (1) Shake: orbital 15 s. frequency 425 cycles per minute (3 mm) (this helps center the embryo in the well), (2) Delay 2 min (rest time), (3) Read: fluorescent area scan, full plate, matrix size 5 × 5, ignore well and carrier limitations; filter set for EGFP (excitation: 479/20, emission 520/20) or filter set for mCherry (excitation: 579/10, emission 616/20), optics: bottom, gain: extended; light source: Xenon Flash, lamp energy = high, extended dynamic range; read speed = normal, delay = 100 msec; measurements/data point = 10; read height = 7 mm, (4) Image: images were captured with a 1.25X magnification lens on the Cytation 5. Plates underwent orbital shake for 15 sec. to center embryos followed by a 2 min rest before imaging. Imaging parameters were: GFP channel (469 excitation, 525 emission), auto‐exposure, target exposure percentage = 75, skip percentage = 0.1, default integration threshold, fixed focal height at bottom elevation plus 0 μm, delay after plate movement: 300 msec. Quality control: Cell debris can emit a large amount of autofluorescence. Debris can be avoided by using filtered embryo media that is replaced following embryo dechorionation (manual removal of chorion). However, in addition to identify artifacts from cell debris, images of each well were examined. Cells with debris (which exhibit high autofluorescence) were omitted from the analysis. Finally, scanning errors that resulted in reduced dynamic range within a well (i.e., wells with higher than normal background fluorescence) were omitted.
2.5. Data analysis
The 5 × 5 array scan produces 25 readings per well calculated in relative fluorescent units (RFU). To target analysis to the head/anterior of each embryo where fluorescence happens to be greatest, the 25 readings per well were thresholded to select the top regions and remove the background and posterior embryo fluorescence. (Figure 2b). The optimal threshold value was determined empirically for each fluorophore and strictly adhered to for all experiments with that transgenic. Fluorescence thresholds: fli1:EGFP with an observed dynamic range of approximately 300–15,000 RFU was thresholded at 550 RFU, while GliBS:mCherry with a lower dynamic range of approximately 4–20 RFU was thresholded at 7 RFU, elavl3:EGFP with a dynamic range of approximately 1,000–5,000 RFU was thresholded at 450 RFU, sox10:EGFP with a dynamic range of approximately 300–1,400 RFU was thresholded at 450 RFU. Readings that met or surpassed the threshold were summed to generate a per‐well cumulative fluorescence measurement for each embryo (Figure 2c). Individual cumulative measurements for each well (embryo) were plotted as individual values and statistically analyzed in Graphpad Prism (v. 9.1.2) for between treatment group differences using two‐tailed ANOVA with post hoc Tukey's correction for multiple comparisons between all groups, with an alpha value of p < .05 considered significant.
2.6. Bone and cartilage staining
Embryos were stained using a standard protocol (Walker & Kimmel, 2007) (Figure 1d) adapted for use in a 96‐well plate. Protocol adaptations: (1) media volumes for all steps were reduced to 100 μl per well and administered using a multichannel pipette. (2) To avoid damaging embryos or erroneously sucking them up into the pipette tips, only ~75% (75 μl) of the media was removed following each staining step, with the pipette tip held close to the media surface. To account for the increased carry‐over of media between steps, washes were then conducted in duplicate—first to rinse out most of the media left behind from the previous step (1 min), and then again for a clean wash (5 min). Embryos were euthanized with tricaine methanesulfonate (MS‐222) and fixed in 2% paraformaldehyde in phosphate‐buffered saline (PBS) for 45 min. Cartilage was then stained in Alcian Blue overnight. Next, embryos were serially rehydrated before bleaching with 3% H2O2 and 0.5% KOH in PBS for 10 min. Finally, bone was stained with Alizarin Red for 30 min before final rinses and clearing with 25% glycerol and 0.2% KOH before storage and imaging in 50% glycerol and 0.2% KOH.
2.7. Morphological measurements
Craniofacial defects were quantified using linear measurements of specific cartilage elements as previously described (Figure 1d) (Everson et al., 2020). Whole‐mount embryos were submerged in 50% glycerol 0.2% KOH in a 30 mm petri dish and imaged with an Olympus SZX7 microscope affixed with a DP22 digital camera. Whole body images were captured of embryos on their right sides at 3.2X magnification. Next, craniofacial elements were imaged both ventrally and dorsally at 5.6X magnification. Linear measurements of neurocranial elements were collected using ImageJ. The following measurements were gathered: whole body length (BL), whole skull length, trabecula length (TL), inter‐trabeculae width (ITW) (i.e., distance between the trabeculae), and ethmoid plate length (EPL). Average measurements were compared between treatment groups using two‐tailed ANOVA with post hoc Tukey's correction for multiple comparisons, with an alpha value of p ≤ .05 considered significant in Graphpad Prism v. 9.1.2.
3. RESULTS
3.1. High‐throughput detection of neural crest defects
To assess the accuracy and sensitivity of NCC‐reporter fluorescence to identify craniofacial defects, fli1:EGFP fluorescent fish was exposed to chemical teratogens at doses and critical periods of development previously shown to cause craniofacial defects (Everson et al., 2020). The general experimental procedure (Figure 1a–d) and the data processing method (Figure 2a–c) are provided. Previous work by ourselves and others has found that while a 1% ethanol dose (in media) from 6–24 hpf causes few or no overt malformations, higher doses, such as 1.5% ethanol cause malformations of the neural crest cell‐derived facial cartilages (Bilotta, Barnett, Hancock, & Saszik, 2004; Everson et al., 2020; Fish, Tucker, Peterson, Eberhart, & Parnell, 2021; McCarthy et al., 2013; Swartz et al., 2014; Zhang et al., 2014). Therefore, as a proof of principle, we first exposed fli1:EGFP embryos to 0%, 1%, 1.25%, or 1.5% ethanol from 6–24 hpf and measured fluorescence at 26 hpf (Figure 3a–d). In accordance with previous morphological data, fli1:EGFP fluorescence was not significantly altered by 1% ethanol (mean ± SEM for control = 8,121.20 ± 534.33 RFU; 1% ETOH = 7,290.69 ± 584.65 RFU, p = .59), but was significantly reduced at both 1.25% ETOH (4,603.21 ± 226.25 RFU, p = <.0001) and 1.5% ETOH (4,015.94 ± 229.14 RFU, p < .0001) ethanol (Figure 3e). These responses were dose‐dependent, with 1.25% ethanol causing a significantly lower fluorescence than 1% ethanol (p = .0001). However, no significant difference was observed between fluorescence at 1.25% and 1.5% ethanol (p = .85), indicating a thresholding of effect at doses greater than 1.25% ethanol.
FIGURE 3.

Ethanol exposure reduces fli1:EGFP expression. (a–d) Fluorescent images of 26 hpf fli1:EGFP embryos exposed to control or the indicated concentration of ethanol from 6–24 hpf showing dose‐dependent reduction of fluorescence. (e) Column graph showing fli1:EGFP fluorescence for each embryo (open circles). Black bars show mean fluorescence in relative fluorescence units (RFU) for each group ± SEM. Sample sizes: control n = 15; 1% ETOH n = 16; 1.25% ETOH n = 14; 1.5% ETOH n = 16. Statistic: two‐tailed ANOVA with Tukey's multiple comparison's correction between all groups. *** = p < .001, **** p < .0001. Scale bar = 0.2 mm. RFU = relative fluorescence units. ETOH = ethanol
Notably, in addition to being expressed in the neural crest, fli1 is also expressed in the vasculature. Therefore, to validate that the observed reductions in fli1:EGFP fluorescence represent NCC defects, sox10:EGFP (a neural crest cell marker that is not also expressed in the vasculature; however, it is additionally expressed in the developing ear) fluorescence was measured following the same alcohol exposures (Figure S1A–D). We found significant reductions in sox10:mRFP expression at the same ethanol doses in which reductions in fli1:EGFP expression were observed, with 1.25% and 1.5% ethanol causing significant reductions in both fli1:EGFP (Figure 1e) and sox10:mRFP (Figure S1E) fluorescence, (mean ± SEM for control = 2,192.50 RFU ± 98.17; 1% ETOH = 1821.79 ± 81.63, p = .08; 1.25% ETOH = 1,688.29 ± 135.85, p = .0078; 1.5% ETOH = 1,552.15 ± 104.70, p = .0006). This suggests the changes we observed using fli1 are at least in large part driven by changes in the neural crest.
Next, we assessed the ability of this system to observe multifactorial interactions between chemical teratogens. We have previously characterized synergistic interactions between alcohol and the pesticide synergist, PBO (Everson et al., 2020). We tested the ability of this assay to detect co‐environmental interactions by exposing embryos to either control (DMSO), 1% ethanol + DMSO, 25 μM PBO, or 1% ethanol and 25 μM PBO in combination (Figure 4). Previously, these concentrations of ethanol and PBO were found to cause few malformations on their own, but strongly synergized when co‐exposed (Everson et al., 2020). Consistently, a nonsignificant trend of reduced fli1:EGFP fluorescence was observed in embryos exposed to either 1% ethanol or 25 μM PBO individually (control: 9249.41 RFU ± 385.12; 1% ETOH: 7740.65 RFU ± 617.49, p = .21; 25 μM PBO‐only: 7486.43 RFU ± 862.76, p = .14). However, a significant reduction of fli1:EGFP fluorescence was observed in co‐exposed, 1% ETOH+25 μM PBO, embryos (3,643.53 RFU ± 297.58, p < .0001), demonstrating a synergistic interaction. This reduction was significant compared to both 1% ethanol alone (p < .0001) and PBO‐only (p < .0001) (Figure 4e).
FIGURE 4.

PBO and alcohol interact to synergistically reduce fli1:EGFP expression. (a–d) Fluorescent images of 26 h post fertilization (hpf) fli1:EGFP embryos exposed to control or the indicated concentration of PBO, ethanol, or both from 6–24 hpf showing a synergistic interaction between ethanol and PBO. (e) Column graph showing fli1:EGFP fluorescence measurements for each embryo (open circles). Black bars show mean fluorescence for each group ± SEM. Sample sizes: control n = 17; 1% ETOH n = 17; 25 μM PBO n = 14; ETOH+PBO n = 17. Statistic: two‐tailed ANOVA with Tukey's multiple comparison's correction between all groups. **** p < .0001. Scale bar = 0.2 mm. RFU = relative fluorescence units. ETOH = ethanol. PBO = piperonyl butoxide, environmental Hedgehog pathway inhibitor
3.2. Correlation between reduced fluorescence and facial malformations
Current alternative methods to assess craniofacial malformations typically involve staining facial elements with Alcian Blue and Alizarin Red followed by imaging each embryo for either scoring or morphometric measurements. We, therefore, compared the sensitivity and accuracy of these methods to the fluorescent plate reader assay. For this, we focused on our most well‐characterized chemical exposures: 0, 1%, 1.5%, and 2% ethanol from 6–24 hpf. Fluorescence (fli1:EGFP) was measured at 26 hpf and then embryos were returned to the incubator to continue developing. At 5 dpf, embryos were euthanized, fixed, and stained using the standard staining protocol adapted for use in a 96‐well plate (see methods). Following staining, each embryo's malformations were scored before being imaged in the side and dorsal views. First, malformation severity was determined using a semi‐quantitative scoring system based on increasing body axis defects, midfacial hypoplasia, and shortened snout length (Figure 5a–j). Moderate and severe malformations were only observed in 1.5% and 2% ethanol exposed embryos (Figure 5m). A significant increase in malformation incidence was observed at 1.5% ETOH (p = .0018) and 2% ETOH (p < .0001) ethanol (Figure 5n). Notably, this is consistent with the doses in which reduced fli1:EGFP fluorescence was observed (Figure 3e).
FIGURE 5.

Malformation severity scoring. (a, d, g, j) Dorsal, (b, e, h, k) ventral, or lateral (c, f, i, l) images of five days post fertilization (dpf) embryos stained with alcian blue (cartilage) and alizarin red (bone) showing the craniofacial malformation scale that were used to quantify the number of malformations at each severity shown in (m). (n) Bar graph of frequency of malformations following ethanol exposure. Statistics = Fischer's exact test for each control‐treatment group comparison. Scale bar = 0.2 mm
Next, linear measurements were determined of several key craniofacial structures, including TL, neurocranium length (NL), ITW (ITW, a measure of midfacial width), and EPL, in addition to total BL (Figure 6a). Facial measurements were also normalized to BL (Figure S2). These structures were chosen because they are analogous to structures commonly malformed in human syndromes (Swartz, Sheehan‐Rooney, Dixon, & Eberhart, 2011) and their cellular origins (Schilling & Kimmel, 1994). Significant changes were observed for four structures: BL, TL, NL, and ITW (Figure 6b–e), consistent with the neural crest effects observed in Figure 3. For BL, only 2% ETOH caused a significant reduction compared to control (control = 3.298 ± 0.028 mm, 1% = 3.330 ± 0.018 mm, p = .90, 1.5% = 3.273 ± 0.042 mm, p = .96, and 2% 3.137 ± 0.043 mm, p = .0082). The lowest dose to cause significantly smaller neural crest‐derived trabeculae was 1.5% ethanol, with dose‐dependent reductions observed between other doses (control = 0.250 ± 0.003 mm, 1% ETOH = 0.243 ± 0.004 mm, p = .93, 1.5% ETOH = 0.215 ± 0.009 mm, p = .02, and 2% ETOH = 0.170 ± 0.012 mm, p < .0001). Dose‐dependent reduction of NL was also observed, though a significant reduction vs. control was only observed for 2% ethanol (control = 0.658 ± 0.010 mm, 1% = 0.678 ± 0.005 mm, p = .58, 1.5% = 0.628 ± 0.011 mm, p = .29, and 2% 0.555 ± 0.0165 mm, p < .0001). Finally, ITW was significantly reduced in 2% ethanol exposed embryos (control = 0.174 ± 0.005 mm, 1% = 0.178 ± 0.003 mm, p = .95, 1.5% = 0.171 ± 0.005 mm, p = .98, and 2% ethanol = 0.148 ± 0.007 mm, p = .0044). No significant changes were observed in ethmoid plate size (Figure 6f). Representative (based on average NL) paired dorsal (Figure 6g–j) and ventral (Figure 6k–n) images of bone‐ and cartilage‐stained embryos show the ethanol‐induced phenotypes quantified above, including reduced facial width (ITW) and length (NL and TL).
FIGURE 6.

Ethanol exposure causes dose‐dependent craniofacial defects. (a, top) Schematic showing lateral view of whole embryo for body length (BL) measurement. Scale bar = 1 mm (a, bottom) Schematic showing dorsal view of 5 dpf embryo showing neurocranium length (NL), Trabecula Length (TL), Inter‐trabuculae width (ITW), and ethmoid plate length (EPL). Scale bar = 0.2 mm. (b–f) Column graphs showing each embryo's morphological measurement for each endpoint. Black bars show mean measurement for each group ± SEM. Statistics: two‐tailed ANOVA with Tukey's multiple comparison's correction between all groups. * = p < .05, ** = p < .01, *** = p < .001, **** p < .0001. (g‐j) Representative (based on TL measurement) dorsal or (k‐n) ventral images of 5 dpf bone and cartilage stained embryos for control or the indicated concentration of ethanol show increasing severity of craniofacial malformations with ethanol dose. ETOH = ethanol
To further examine the relationship between fli1:EGFP fluorescence at 26 hpf and craniofacial morphometrics at 5 dpf (Figure 7a), we next plotted each embryo's fluorescence and morphometric measurement. A simple linear regression analysis was then conducted to calculate the R2 coefficient of determination for each plot. In addition, the Pearson's correlation coefficient (r) and p value were determined for each morphometric endpoint to directly test the significance and direction (i.e., positive or negative) of any correlation. Significant positive correlations were observed between 24 hpf fli1:EGFP fluorescence and 5 dpf BL (R 2 = 0.0668, r = 0.2607, p = .022), NL (R 2 = 0.1463, r = 0.3825, p = .0005), TL (R 2 = 0.2441, r = 0.4941, p < .0001), and ITW (R 2 = 0.0773, r = 0.2805, p = .0129) (Figure 7b–e). No correlation was observed for EPL (R 2 = 0.0055, r = 0.1129, p = .3284) (Figure 7f).
FIGURE 7.

Expression of fli1:EGFP correlates with craniofacial morphometrics. (a) Schematic showing comparison of fluorescence at 1 dpf to craniofacial morphometrics at 5 dpf in the same animal. (b–f) Scatter plots of pair‐wise comparisons for each embryo, where (x = Morphological Measurement at 5 dpf, y = Fluorescence at 1 dpf). Data points are color coded by treatment group (black = control, light gray = 1% ETOH, dark gray = 1.5% ETOH, black = 2% ETOH.) Linear regression analysis mean (solid line) ± standard error (dotted lines) is shown. R 2‐value (coefficient of determination), r‐value (Pearson's correlation coefficient), and correlation p values are shown. RFU = relative fluorescence units. ETOH = ethanol
The extent to which each structure is neural crest‐derived correlated with the level of significance. Fluorescence correlated most strongly with the length of the trabeculae, which are wholly fli1‐positive neural crest derived (Eberhart, Swartz, Crump, & Kimmel, 2006). The next strongest correlation was length of the neurocranium, which is derived from both neural crest cells and mesoderm (McCarthy, Sidik, Bertrand, & Eberhart, 2016). Weaker yet was the correlation of fli1 with midfacial width (inter‐trabecular width). This may be expected given the major driver of midfacial width is Shh‐signaling within the neuroepithelium (Varga et al., 2001) and not simply neural crest growth.
Correlation analyses for body‐normalized measurements are shown in Figure S3. Correlation coefficients remained approximately the same before and after body‐normalization. For example, NL r‐values went from 0.38 before to 0.35 after body‐normalizing; TL from 0.49 before to 0.46 after body‐normalizing. This demonstrates between‐group body size differences are only a small driver of the observed changes in fluorescence. This suggests our normalization approach that we designed to specifically target fluorescence from the embryo's head (Figure 2) was largely successful.
Since PBO and ethanol interact with the Shh pathway, we next examined the effect of a direct Shh pathway inhibitor on fluorescence and subsequent craniofacial morphology. We examined the concordance between the doses required to cause reduced fluorescence at 24 hpf and craniofacial malformations at 5 dpf using the Hedgehog pathway inhibitor standard BMS‐833923 (BMS). We observed dose‐dependent craniofacial defects, with moderate phenotypes only observed at BMS doses greater than or equal to 3.125 μM and severe phenotypes only at BMS doses greater than or equal to 6.25 μM (Figure 8a). A significantly higher incidence of malformations was observed for doses greater than or equal to 3.125 μM (Fischer's exact test p < .0001 compared to control) (Figure 8b). Interestingly, we found the lowest dose in which a significant reduction of fli1:EGFP fluorescence is observed is also 3.125 μM BMS (control = 8,277 ± 201.00 RFU, 3.125 μM BMS = 7,373 ± 255.07 RFU, p = .0128) (Figure 8c). Fluorescence was further reduced at higher doses 6.25 μM BMS (1,509 ± 164.64 RFU, p = .0004) and 12.5 μM (2,698 ± 147.44 RFU, p < .0001), consistent with these higher doses causing more frequent and severe malformations. Representative images of stained 5 dpf control or BMS‐exposed embryos show dose‐dependent losses of midfacial neurocranial tissues (Figure 8d).
FIGURE 8.

Hedgehog pathway disruption reduces fli1:EGFP expression at doses that cause craniofacial malformations. (a) Stacked bar graph showing severity scoring of embryos exposed the potent Hedgehog pathway inhibitor BMS‐833923. Embryos were exposed from 6–24 hpf and stained at 5 dpf. Number of embryos for each severity are shown (white = apparently normal, light gray = mild, dark gray = moderate, black = severe). (b) Collapsed data showing frequency of malformations for each treatment group. Bar graph of frequency of malformations following ethanol exposure. Statistics = Fischer's exact test for each control‐treatment group comparison. (c) Column graph showing fli1:EGFP fluorescence measurement for each embryo (open circles). Black bars show mean fluorescence for each group ± SEM. Sample sizes: control n = 24; 1.56 μM BMS n = 24; 3.125 μM BMS n = 24; 6.25 μM BMS n = 24; and 12.5 μM BMS n = 24. Statistic: two‐tailed ANOVA with Tukey's multiple comparison's correction between all groups. * = p < .05, *** = p < .001, **** p < .0001. (d) Images of 5 dpf embryos stained with alcian blue (cartilage) and alizarin red (bone) showing BMS‐induced craniofacial defects. RFU = relative fluorescence units. BMS = BMS‐833923, Hedgehog pathway inhibitor standard
3.3. Detection of cellular signaling perturbations
We next tested the ability of this high‐throughput assay to detect chemical disruptors of a developmental signaling pathway using a transgenic pathway readout (Figure 9). The hedgehog pathway was chosen for these initial studies for two reasons. First, the Hedgehog pathway is a well‐characterized regulator of craniofacial and neural crest development (Chiang et al., 1996; Cordero et al., 2004; Eberhart et al., 2006; Everson et al., 2017; Everson, Fink, Chung, Sun, & Lipinski, 2018; Hu et al., 2015; Hu & Marcucio, 2009; Hu, Marcucio, & Helms, 2003; Wada et al., 2005). Second, the transmembrane protein Smoothened (SMO) is highly susceptible to small molecule modulation (Chen, Taipale, Cooper, & Beachy, 2002; Chen, Taipale, Young, Maiti, & Beachy, 2002). This suggests the Hedgehog pathway could be a hotspot for gene–environment interactions, raising the importance of rapidly identifying environmental chemicals capable of perturbing the Hedgehog pathway in vivo. The fluorescent Hedgehog pathway reporter line we utilized 8xGliBS:mCherry contains eight GLI transcription factor binding site repeats upstream of mCherry (Mich et al., 2014). This means Hedgehog‐responding cells, in which the pathway is active, fluoresce red. Embryos were exposed to increasing concentrations of three chemicals previously linked to Hh pathway inhibition: BMS‐833923 (BMS), PBO, or alcohol. As mentioned, BMS and PBO are known SMO antagonists capable of blocking Hh pathway activity (Everson et al., 2019; Everson et al., 2020; Tang & Marghoob, 2011; Wang et al., 2012). These chemicals were, therefore, expected to result in reduced GLI binding activity, leading to reduced mCherry fluorescence. BMS exposure reduced GliBS:mCherry fluorescence at doses greater than or equal to 3.125 μM BMS (p < .0001) (Figure 9a). Fluorescence readings were Control = 40.83 ± 1.21 RFU, 1.56 μM = 35.92 ± 1.91 RFU, 3.125 μM = 26.17 ± 2.10 RFU, 6.25 μM = 16.43 ± 1.50 RFU, and 12.5 μM = 11.27 ± 1.20 RFU. BMS‐induced reduction of fluorescence was dose‐dependent, with 3.125 μM having significantly less fluorescence than 1.56 μM (p = .0003), and 6.25 μM having significantly less fluorescence than 3.125 μM (p < .0001). Interestingly, 12.5 μM did not result in significantly less fluorescence than 6.25 μM (p = .8921) suggesting a threshold/plateau effect. Consistent with this, fluorescence for a significant number of samples (Fischer's exact test of 2 × 2 contingency table) of the 6.25 (8 embryos, p = .0040 vs. control) and 12.5 μM (13 embryos, p < .0001 vs. control) groups were below threshold, resulting in cumulative well measurements of zero. These samples were omitted, resulting in a more conservative average measurement.
FIGURE 9.
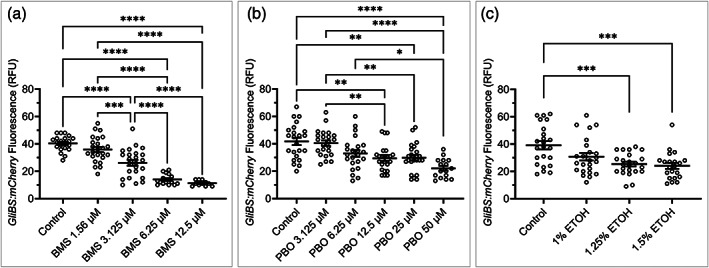
Monitoring Hedgehog pathway activity. (a) Column graph showing GliBS:mCherry fluorescence (a marker of Hedgehog pathway activity) for each embryo (open circles) exposed to the indicated concentration of the potent Hedgehog pathway inhibitor standard BMS‐833923 from 6–24 hpf. Black bars show mean fluorescence for each group ± SEM. Sample sizes: control n = 21; 1.56 μM BMS n = 24; 3.125 μM BMS n = 24; 6.25 μM BMS n = 16; 12.5 μM BMS n = 11. Many samples, n = 6 at 6.25 μM and n = 13 at 12.5 μM BMS were below fluorescence threshold and were omitted. Statistic: two‐tailed ANOVA with Tukey's multiple comparison's correction between all groups. (b) Column graph showing GliBS:mCherry fluorescence for embryos exposed to the environmental teratogen PBO from 6–24 hpf. Black bars show mean fluorescence for each group ± SEM. Sample sizes: control n = 23; PBO 3.125 μM n = 23; PBO 6.25 μM n = 23; PBO 12.5 μM n = 23; PBO 25 μM n = 23; PBO 50 μM n = 16. n = 7 samples exposed to 50 μM PBO were below the fluorescence threshold and were omitted. Statistic: two‐tailed ANOVA with Tukey's multiple comparison's correction between all groups. (c) Column graph showing GliBS:mCherry fluorescence for embryos exposed to ethanol from 6–24 hpf. Black bars show mean fluorescence for each group ± SEM. Sample sizes: Statistic: two‐tailed ANOVA with Tukey's multiple comparison's correction between all groups. * = p < .05, ** = p < .01, *** = p < .001, **** p < .0001. RFU = relative fluorescence units. BMS = BMS‐833923, Hedgehog pathway inhibitor standard. PBO = piperonyl butoxide, environmental Hedgehog pathway inhibitor
Next, the sensitivity of the assay to detect a less potent, environmental, Hh pathway inhibitor (Everson et al., 2019) was assessed. GliBS:mCherry embryos were exposed to doses of PBO ranging from 0–50 μM. Previously, we found 25 μM PBO did not cause craniofacial malformations on its own, but a low dose of ethanol (1%) + 25 μM PBO synergistically caused malformations (Everson et al., 2020). Here, reduced GliBS:mCherry fluorescence was observed at doses greater than or equal to 12.5 μM (p = .0015). Interestingly, this dose is lower than the low effect level for malformations measured at 5 dpf (Everson et al., 2020) or reduced fli1:EGFP fluorescence at 1 dpf, (Figure 3). This indicates that the fluorescent plate reader is exquisitely sensitive to pathway perturbations. Notably, fluorescence for a significant number of samples (Fischer's exact test of 2 × 2 contingency table) of the 50 μM PBO (7 embryos, p = .0092 vs. control) group were below threshold, resulting in cumulative well measurements of zero. These samples were omitted, resulting in a more conservative average measurement. Fluorescence readings were control = 40.13 ± 3.08 RFU, 1.56 μM = 35.73 ± 2.69 RFU, 3.125 μM = 40.54 ± 2.00 RFU, 6.25 μM = 32.80 ± 3.79 RFU, 12.5 μM = 30.92 ± 2.60 RFU, 25 μM = 31.53 ± 2.73 RFU, 50 μM = 20.84 ± 2.12 RFU.
Given the various known relationships between the Shh pathway and alcohol (Boschen, Fish, & Parnell, 2021; Everson et al., 2020; Fish et al., 2019; Hong & Krauss, 2012, 2017, 2018; Kietzman, Everson, Sulik, & Lipinski, 2014; Li et al., 2007), we next assessed the effect of ethanol exposure on Shh pathway activity. GliBS:mCherry embryos were exposed to doses of ethanol from 0–1.5%. Consistent with previous data and fli1:EGFP results herein, the typically sub‐teratogenic 1% ethanol caused a nonsignificant reduction of fluorescence (p = .08). However, significant reductions of GliBS:mCherry were observed at both 1.25% (p = .0009) and 1.5% ethanol (p = .0004). Fluorescence readings were control = 39.13 ± 3.01 RFU, 1% ETOH = 30.75 ± 2.74 RFU, 1.25% ETOH = 25.39 ± 1.67 RFU, 1.5% ETOH = 24.10 ± 2.20 RFU.
3.4. Detection of neurological defects
To determine if our plate reader technique was generally applicable for the detection of development defects, we next analyzed another sensitive cell type, neurons. Our laboratory has previously found that ethanol doses greater than or equal to 1% results in reduced elavl3 expression, a marker of mature neurons (Buckley, Sidik, Kar, & Eberhart, 2019). To determine the ability of the plate reader to detect neuronal disruptions, elavl3:eGFP embryos were exposed to 0.25%, 0.5%, 0.75%, 1%, and 1.25% ethanol and elavl3:eGFP expression was quantified at 26 hpf (Figure 10a–d). Consistent with previous results (Buckley et al., 2019), we found doses greater than or equal to 1.0% ethanol resulted in reduced elavl3:eGFP fluorescence (Figure 10e). Additionally, we found that doses as low 0.5% ethanol (not previously analyzed) caused reductions of elavl3:eGFP, suggesting these low and sub‐teratogenic doses (in terms of facial malformations) remain capable of disrupting neural development. This result supports the hypothesis that the brain is more sensitive than the face to ethanol‐induced malformations. Fluorescence readings and p value compared to control were control = 3,543.79 ± 254.91 RFU, 0.25% = 3,197.36 ± 159.02 RFU (p = .79), 0.5% ETOH = 2,210.78 ± 244.25 RFU (p = .0058), 0.75% ETOH = 1922.38 ± 214.60 RFU (p < .0001), 1% ETOH = 1,662.88 ± 145.49 RFU (p < .0001), and 1.25% ETOH = 1948.33 ± 147.54 RFU (p < .0001). In addition, significant reductions were observed between 0.25% ethanol and 0.75% (p = .0037), 1% ethanol (p = .0001), and 1.25% ethanol (p < .0001). Finally, a significant reduction was observed between 0.5% ethanol and 1.25% ethanol (p = .02).
FIGURE 10.
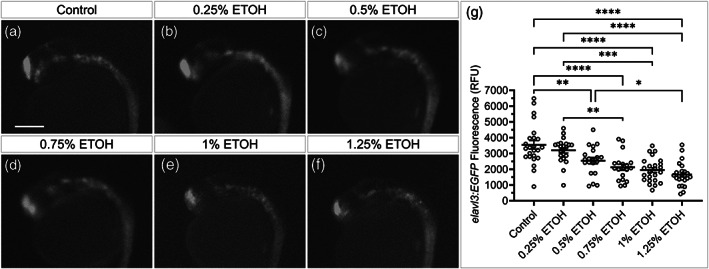
Subteratogenic doses of alcohol reduce neural progenitor (elavl3) expression. (a–f) Fluorescent images of 26 hpf elavl3:EGFP embryos exposed to control or the indicated concentration of ethanol from 6–24 hpf. (g) Column graph showing elavl3:EGFP fluorescent read for each embryo (open circles). Black bars show mean fluorescence for each group ± SEM. Sample sizes: control n = 24; 0.25% ETOH n = 22; 0.5% ETOH n = 20; 0.75% ETOH n = 19; 1.0% ETOH n = 24; and 1.25% ETOH n = 24. Statistic: two‐tailed ANOVA with Tukey's multiple comparison's correction between all groups. * = p < .05, ** = p < .01, *** = p < .001, **** p < .0001. Scale bar = 0.2 mm. RFU = relative fluorescence units. ETOH = ethanol
4. DISCUSSION
Here, we describe a novel method for the high‐throughput detection of neural crest cell defects as a predictor of craniofacial malformations. We show that the neural crest cell marker fli1:EGFP accurately captures ethanol‐ or Shh hedgehog pathway inhibitor‐induced disruptions to neural crest development at 1 dpf, which strongly correlate with morphological defects at 5 dpf. While our findings demonstrate correlations with a specific subset of craniofacial skeletal elements, disruptions that affect other elements should be equally readily identifiable. In addition, we demonstrate this method's utility for detecting inhibition of specific cellular signaling pathways, like Shh. Finally, we demonstrate that the technique is broadly useful in the analysis of developmental defects by detecting neuronal defects following a low dose of ethanol.
Previous studies have used high‐throughput screens of fluorescent zebrafish embryos to measure cellular or molecular changes, but this is the first to apply the assay to predict developmental defects. Most studies using fluorescent zebrafish for high‐throughput screening have focused on cell signaling. For example, fluorescent zebrafish have been used to examine fibroblast growth factor (FGF) signaling and to identify FGF pathway modulators in high‐throughput screens (Vogt, Codore, Day, Hukriede, & Tsang, 2010). In these studies, transgenic dusp6:EGFP zebrafish, which labels cells with active FGF signaling, were exposed to 10,000 chemicals to identify FGF activators. However, these studies notably utilized high‐content confocal imaging in 96‐well format followed by image processing using the Cognition Network Technology (CNT) algorithm in the proprietary Definiens Developer software to quantify changes in dusp6 expression. As such, the approach utilized here is a more accessible method in which high‐throughput screening of pathway inhibitors can be accomplished. In addition to FGF signaling, Notch pathway modulators have also been examined (Walker et al., 2012). These studies utilized methods more similar to those applied herein (i.e., low‐content plate imaging instead of high‐content confocal microscopy). In addition, the authors demonstrated feasibility for a diverse set of fluorophores and genetic constructs, including fluorescent reporters for reactive oxygen species (ROS), and photoreceptor rods. To our knowledge, these experiments on photoreceptor rods were the first to demonstrate plate reader analysis of cell‐type specific losses (Walker et al., 2012). In addition, the authors demonstrated feasibility for measuring sox10:EGFP (a neural crest cell marker) in unexposed embryos undergoing normal development. A second study screened FDA‐approved drugs to identify drugs that altered pancreatic beta cell development. Using high‐throughput screening of transgenic zebrafish with labeled beta‐cells (insulin:YFP), the authors identified 24 drugs that either increased the number of insulin‐producing beta‐cells (Wang et al., 2015). Together, these studies along with our work provide strong evidence for the utility of combining zebrafish with a fluorescent plate reader for detecting alterations to signaling pathways and cell populations that predict developmental defects.
There are several reasons neural crest cell (NCC) changes provide a biomarker/approximation for craniofacial defects. First, the NCCs give rise to the bones and cartilages of the face (Bronner & Simões‐Costa, 2016; Evans & Noden, 2006). These are the very tissues that are lost or malformed in craniofacial birth defects. Consistent with this, our findings demonstrate a significant correlation between reductions of fli1 fluorescence and morphological defects in cNCC derivatives later in development. Importantly, due to the intimate co‐development of the craniofacial tissues, NCC defects can be considered a hallmark of craniofacial defects, even in cases where the initial insult occurs on another tissue. For example, the brain malformation holoprosencephaly results in secondary defects of the NCC‐derived facial tissues, and these facial malformations positively correlate with the severity of the brain malformations (Everson et al., 2019; Heyne et al., 2016; Lipinski et al., 2012). The basis for this relationship is likely the brain's role as physical scaffold upon which the face forms, as well as the complex bi‐direction signaling between the developing face and brain (Eberhart et al., 2006; Hu & Marcucio, 2009; Marcucio, Cordero, Hu, & Helms, 2005; Marcucio, Hallgrimsson, & Young, 2015; Swartz, Nguyen, McCarthy, & Eberhart, 2012). As such, assay of the NCC provides a useful and generalized measure of either direct or indirect disruptions to craniofacial development. In our analyses, not all craniofacial elements were disrupted by alcohol exposure. As it relates to alcohol, that demonstrates that not all skeletal elements are equally sensitive. More importantly though, it demonstrates that the plate reader assay is sensitive enough to detect alterations in fluorescence that relate to specific tissues.
The origins of human birth defects are remarkably murky. Indeed, most birth defects do not have a known cause. Past estimates have suggested as low as 43% of birth defects have an unknown etiology, but larger, more recent studies put that number closer to 80% (Feldkamp et al., 2017) or even as high as 91% (Yang et al., 2022). Birth defects can result from many factors, but a major one is the environment (Beames & Lipinski, 2020; Brent, 2004; Krauss & Hong, 2016). The environment contains tens of thousands of environmental protection agency (EPA)‐registered chemicals (Jeong, Kim, & Choi, 2022; Richard et al., 2016). Most of these chemicals have not been thoroughly examined for developmental toxicity—specifically, only about 4,000 of the roughly 85,000 EPA‐registered chemicals have been tested (Krewski et al., 2010). Thus, newer, higher‐throughput methods are required to rapidly and accurately assess these chemicals. Owing to their high fecundity, external fertilization, optical clarity, and rapid development, zebrafish embryos are an ideal vertebrate model for high‐throughput screening. For instance, a zebrafish study examined the Environmental Protection Agency (EPA) ToxCast libraries (Phase 1 and 2) chemicals (1,040 chemicals total) to identify 178 novel craniofacial teratogens (Truong et al., 2014). These studies utilized robotic automation to carry out chemical exposure and bright field imaging of unstained zebrafish embryos to identify gross morphological defects. A more recent study used a combination of high‐content bright field and fluorescent imaging followed by artificial intelligence‐automated cell counting analysis to enumerate hematopoietic stem and progenitor cells in the tails of embryos, which comported with manual cell counts (Lubin et al., 2021). However, the analysis software is proprietary, reducing versatility, and accessibility of the assay. One can imagine combining robotic automation with high‐throughput, quantitative, fluorescent plate reader analysis to greatly speed our discovery of environmental toxicants and how that interact with one another and sensitizing genotypes.
The plate reader offers many advantages over slower‐throughput traditional staining and microscopy methods. First, plate reader measurements are quantitative. This is advantageous compared to categorical endpoints like severity scales, where statistical tests are more limited. Another major advantage is the ability to assess cellular phenotypes that precede observable tissue malformations. This speeds screening time, by allowing same day phenotyping, instead of the typical 5–6 day protocol required to grow, stain, and phenotype embryos. Moreover, the most time‐consuming steps of traditional staining and microscopy methods are embryo imaging and measurement. At minimum, imaging and measuring require several minutes per embryo. In comparison, the time required to quantify fluorescence for each embryo on the plate reader is on the order of mere seconds. A 96‐well plate can be 5 × 5 matrix scanned in about 20 min. Thus, even if one excludes the additional time required to grow up the embryos to 5 dpf and to perform the two‐day Alcian and Alizarin (cartilage and bone) staining protocol, the workflow for capturing final phenotypic measurements with the plate reader is more than 10X shorter than with staining (e.g., 20 min with plate reader vs 200 min or more with staining). In addition, a major strength of this assay is the wide availability and ease of transgenesis to generate lines with fluorescently tagged cell types of interest, making this approach broadly applicable for other disease systems.
This assay has several important considerations, including cell/tissue specificity and mechanisms of action. (1) An assay attempting to capture a cell‐specific effect is only as specific as the transgenic whose florescence is being measured. Many marker genes also label other cell types. For example, fli1 is also expressed in the craniofacial vasculature. Thus, it is possible that part of the change in fli1 fluorescence captures vasculature changes in addition to neural crest. This is why follow‐up analyses that directly characterize the cell population of interest are required, such as the linear measurements presented here. These measurements are more time consuming, but because many interactions can be ruled out using plate reader fluorescence screening throughput remains high. (2) Several cellular mechanisms that are critical in craniofacial morphogenesis could plausibly lead to reduced fluorescence. Additional follow‐up experiments would be required to identify these mechanisms, which include changes in cell death, proliferation, migration, or differentiation.
Our results also offer important insights into the roles of cell signaling in birth defect etiology and variability. Specifically, for the environmental Shh pathway inhibitor PBO, reductions in GliBS:mCherry fluorescence were observed at doses below the low effect level (LEL) for overt craniofacial malformations. While it is possible that these fish do have real but subtle malformations, our quantitative morphometrics strongly suggest that this is not the case. Thus, it is likely that the plate reader can detect alterations in pathway activity that are subteratogenic. Given the quantitative nature of the plate reader, this finding may shed light on how much Shh signaling is required for proper craniofacial morphogenesis. Or, put another way, how much Shh pathway disruption can an embryo tolerate before craniofacial malformations occur. This question is of utmost importance to environmental toxicologists and epidemiologists, since it informs what environmental doses we consider safe and tolerable versus hazardous.
Complicating this question, however, is the differential susceptibility of various embryonic tissues and cell types. For example, previous work has indicated that the developing brain is a more sensitive cell population than the developing face. Indeed, here, we found that ethanol doses which do not cause significant losses of fli1:EGFP neural crest fluorescence (e.g., 0.5%, 0.75%, and 1% ethanol) do reduce elavl3:EGFP neural precursor fluorescence. While we only imaged single transgenic embryos, the vast number of transgenics that are available with different fluorescent spectra allow for the simultaneous characterization of multiple cell types. Thus, relative sensitivity could be directly compared within and across individuals.
Determining the proper conditions in which one can analyze later timepoints is an area of ongoing investigation. This protocol has been optimized for pharyngula stages. This was chosen for several reasons. Prior to the inflation of the swim bladder, which includes the pharyngula state, zebrafish embryos will typically lie on the left or right side. This provides the relatively flat and thin region that the high‐throughput, low‐content scanning platform needs. We directly assessed whether slight differences in embryo angle could affect measured fluorescence, but found no significant differences (p = .86) between flat and angled control embryos (Figure S4). Thus, embryo angle does not significantly impact the overall variability within the data. In addition, the zebrafish embryo is not pigmented in stages up to and shortly after the pharyngula stage. Thus, additional chemicals or mutant genotypes are not required to prevent pigmentation which would obscure some of the fluorescence. Finally, the pharyngula stage is highly conserved across all vertebrate animals making cross‐species analyses straight forward.
The complex etiology of birth defects has slowed our discovery and understanding of the mechanisms underlying these defects (Khokha, Mitchell, & Wallingford, 2017). The goal of this study was to develop a new model with which to identify birth defects in higher throughput to characterize complex interactions. Our findings demonstrate that zebrafish transgenics coupled with plate reader analysis can accurately predict birth defects resulting from toxicant exposures and/or co‐exposures. This technique will enable faster identification of hazardous environmental chemicals and mixtures, ultimately facilitating birth defect prevention by improving our identification and communication of chemical risks.
AUTHOR CONTRIBUTIONS
Joshua L. Everson conceptualized; Joshua L. Everson and Johann K. Eberhart designed studies; Joshua L. Everson conducted experiments and acquired data; Yung‐Chia Tseng conducted imaging and measurements of five day old embryos; Joshua L. Everson analyzed all data; Joshua L. Everson and Johann K. Eberhart wrote the manuscript; all authors read and approved the final manuscript.
FUNDING INFORMATION
NIH FDE030349 and T32AA007471 to JLE and R01AA023426, R01DE020884, R35DE029086 and U01AA021651 to JKE.
CONFLICT OF INTEREST
The authors declare that they have no competing interests.
ETHICS STATEMENT
This study was conducted in strict accordance with the recommendations in The Zebrafish Book, fifth edition (Westerfield, 1993) and the Guide for the Care and Use of Laboratory Animals of the National Institutes of Health. The protocol was approved by the University of Texas at Austin Institutional Animal Care and Use Committee (protocol number AUP‐2018‐00002). All zebrafish were housed at the University of Texas at Austin under IACUC approved conditions.
Supporting information
Figure S1 Validation of neural crest defects with alternative fluorescent marker sox10:EGFP. (A–D) Fluorescent images of 26 hpf sox10:EGFP embryos exposed to control or the indicated concentration of ethanol from 6–24 hpf showing dose‐dependent reduction of fluorescence. (E) Column graph showing sox10:EGFP fluorescence reading for each embryo (open circles). Black bars show mean fluorescence in relative fluorescence units (RFU) for each group ± SEM. Sample sizes: control n = 14; 1% ETOH n = 14; 1.25% ETOH n = 14; 1.5% ETOH n = 13. Statistic: two‐tailed ANOVA with Tukey's multiple comparison's correction between all groups. ** = p < .01, *** p < .001. Scale bar = 0.2 mm. RFU = relative fluorescence units. ETOH = ethanol.
Figure S2 Body length(BL)‐normalized morphological measurements. (A–D) Column graphs showing each embryo's body length‐normalized morphological measurement for each endpoint. Black bars show mean measurement for each group ± SEM. Statistics: two‐tailed ANOVA with Tukey's multiple comparison's correction between all groups. * = p < .05, ** = p < .01, *** = p < .001, and **** p < .0001. ETOH = ethanol.
Figure S3 BL‐normalized morphological measurements versus fluorescence correlation. (A–D) Scatter plots of pair‐wise comparisons for each embryo, where (x = BL‐normalized morphological measurement at 5 dpf, y = fluorescence at 1 dpf). Data points are color coded by treatment group (black = control, light gray = 1% ETOH, dark gray = 1.5% ETOH, black = 2% ETOH.) Linear regression analysis mean (solid line) ± standard error (dotted lines). R 2 ‐value (coefficient of determination), r‐value (Pearson's correlation coefficient), and correlation p values are shown. RFU = relative fluorescence units. ETOH = ethanol.
Figure S4 Embryo angle does not significantly impact measured fluorescence. (A–B) Control embryos were manually sorted into flat or angled (i.e., slightly oblique) groups using their embryo images. (C) Column graph showing fli1:EGFP fluorescence for each embryo (open circles) comparing mean fluorescence in flat and angled embryos. Black bars show mean fluorescence for each group ± SEM. Sample sizes: flat n = 8, angled n = 7. Statistic: two‐tailed, unpaired student's t‐test. (D) Estimation plot showing the effect size (difference between the mean fluorescence of flat vs. angled embryos) marked by dashed lines. The effect size from embryo angle was small (distance between the dashed lines) compared to normal biological variability (error bars). RFU = relative fluorescence units.
ACKNOWLEDGEMENTS
The authors thank the members of the University of Texas Targeted Therapeutics Program (TTTP) for plate reader support, including Drs. Eun Jeong Cho and Kevin Dalby (principal investigators) and Dr. Rae Sammons (lab manager, troubleshooting). We also thank Drs. David J. Grunwald and Dana K. Shaw (University of Utah) for providing the 8xGliBS:mCherry fish line that was created by Dr. James K. Chen (Stanford University). We would also like to thank Mary Swartz (lab manager) and Kathryn Thompson and Nika Sarraf (fish facility technicians) for support of this research. Finally, we thank Mary Swartz, Scott Tucker, and Shuge Sun for editing the manuscript. Figures 1 and 7 schematics were made with BioRender.com.
Everson, J. L. , Tseng, Y.‐C. , & Eberhart, J. K. (2023). High‐throughput detection of craniofacial defects in fluorescent zebrafish. Birth Defects Research, 115(3), 371–389. 10.1002/bdr2.2127
Funding information National Institute of Dental and Craniofacial Research; National Institute on Alcohol Abuse and Alcoholism
DATA AVAILABILITY STATEMENT
The data that support the findings of this study are available from the corresponding author upon reasonable request.
REFERENCES
- Beames, T. G. , & Lipinski, R. J. (2020). Gene‐environment interactions: Aligning birth defects research with complex etiology. Development, 147(21), dev191064. 10.1242/dev.191064 [DOI] [PMC free article] [PubMed] [Google Scholar]
- Bilotta, J. , Barnett, J. A. , Hancock, L. , & Saszik, S. (2004). Ethanol exposure alters zebrafish development: A novel model of fetal alcohol syndrome. Neurotoxicology and Teratology, 26(6), 737–743. 10.1016/j.ntt.2004.06.011 [DOI] [PubMed] [Google Scholar]
- Boschen, K. E. , Fish, E. W. , & Parnell, S. E. (2021). Prenatal alcohol exposure disrupts sonic hedgehog pathway and primary cilia genes in the mouse neural tube. Reproductive Toxicology, 105, 136–147. 10.1016/j.reprotox.2021.09.002 [DOI] [PMC free article] [PubMed] [Google Scholar]
- Brent, R. L. (2004). Environmental causes of human congenital malformations: The pediatrician's role in dealing with these complex clinical problems caused by a multiplicity of environmental and genetic factors. Pediatrics, 113(4 Suppl), 957–968. [PubMed] [Google Scholar]
- Bronner, M. E. , & Simões‐Costa, M. (2016). The neural crest migrating into the twenty‐first century. Current Topics in Developmental Biology, 116, 115–134. 10.1016/bs.ctdb.2015.12.003 [DOI] [PMC free article] [PubMed] [Google Scholar]
- Buckley, D. M. , Sidik, A. , Kar, R. D. , & Eberhart, J. K. (2019). Differentially sensitive neuronal subpopulations in the central nervous system and the formation of hindbrain heterotopias in ethanol‐exposed zebrafish. Birth Defects Res, 111(12), 700–713. 10.1002/bdr2.1477 [DOI] [PMC free article] [PubMed] [Google Scholar]
- Chen, J. K. , Taipale, J. , Cooper, M. K. , & Beachy, P. A. (2002). Inhibition of hedgehog signaling by direct binding of cyclopamine to smoothened. Genes & Development, 16(21), 2743–2748. 10.1101/gad.1025302 [DOI] [PMC free article] [PubMed] [Google Scholar]
- Chen, J. K. , Taipale, J. , Young, K. E. , Maiti, T. , & Beachy, P. A. (2002). Small molecule modulation of smoothened activity. Proceedings of the National Academy of Sciences of the United States of America, 99(22), 14071–14076. 10.1073/pnas.182542899 [DOI] [PMC free article] [PubMed] [Google Scholar]
- Chiang, C. , Litingtung, Y. , Lee, E. , Young, K. E. , Corden, J. L. , Westphal, H. , & Beachy, P. A. (1996). Cyclopia and defective axial patterning in mice lacking sonic hedgehog gene function. Nature, 383(6599), 407–413. 10.1038/383407a0 [DOI] [PubMed] [Google Scholar]
- Cordero, D. , Marcucio, R. , Hu, D. , Gaffield, W. , Tapadia, M. , & Helms, J. A. (2004). Temporal perturbations in sonic hedgehog signaling elicit the spectrum of holoprosencephaly phenotypes. The Journal of Clinical Investigation, 114(4), 485–494. 10.1172/jci19596 [DOI] [PMC free article] [PubMed] [Google Scholar]
- Dupin, E. , Creuzet, S. , & Le Douarin, N. M. (2006). The contribution of the neural crest to the vertebrate body. Advances in Experimental Medicine and Biology, 589, 96–119. 10.1007/978-0-387-46954-6_6 [DOI] [PubMed] [Google Scholar]
- Eberhart, J. K. , Swartz, M. E. , Crump, J. G. , & Kimmel, C. B. (2006). Early hedgehog signaling from neural to oral epithelium organizes anterior craniofacial development. Development, 133(6), 1069–1077. 10.1242/dev.02281 [DOI] [PubMed] [Google Scholar]
- Evans, D. J. , & Noden, D. M. (2006). Spatial relations between avian craniofacial neural crest and paraxial mesoderm cells. Developmental Dynamics, 235(5), 1310–1325. 10.1002/dvdy.20663 [DOI] [PubMed] [Google Scholar]
- Everson, J. L. , Batchu, R. , & Eberhart, J. K. (2020). Multifactorial genetic and environmental hedgehog pathway disruption sensitizes embryos to alcohol‐induced craniofacial defects. Alcoholism, Clinical and Experimental Research, 44(10), 1988–1996. 10.1111/acer.14427 [DOI] [PMC free article] [PubMed] [Google Scholar]
- Everson, J. L. , Fink, D. M. , Chung, H. M. , Sun, M. R. , & Lipinski, R. J. (2018). Identification of sonic hedgehog‐regulated genes and biological processes in the cranial neural crest mesenchyme by comparative transcriptomics. BMC Genomics, 19(1), 497. 10.1186/s12864-018-4885-5 [DOI] [PMC free article] [PubMed] [Google Scholar]
- Everson, J. L. , Fink, D. M. , Yoon, J. W. , Leslie, E. J. , Kietzman, H. W. , Ansen‐Wilson, L. J. , … Lipinski, R. J. (2017). Sonic hedgehog regulation of Foxf2 promotes cranial neural crest mesenchyme proliferation and is disrupted in cleft lip morphogenesis. Development, 144(11), 2082–2091. 10.1242/dev.149930 [DOI] [PMC free article] [PubMed] [Google Scholar]
- Everson, J. L. , Sun, M. R. , Fink, D. M. , Heyne, G. W. , Melberg, C. G. , Nelson, K. F. , … Lipinski, R. J. (2019). Developmental toxicity assessment of Piperonyl Butoxide exposure targeting sonic hedgehog signaling and forebrain and face morphogenesis in the mouse: An in vitro and in vivo study. Environmental Health Perspectives, 127(10), 107006. 10.1289/EHP5260 [DOI] [PMC free article] [PubMed] [Google Scholar]
- Feldkamp, M. L. , Carey, J. C. , Byrne, J. L. B. , Krikov, S. , & Botto, L. D. (2017). Etiology and clinical presentation of birth defects: Population based study. BMJ, 357, j2249. 10.1136/bmj.j2249 [DOI] [PMC free article] [PubMed] [Google Scholar]
- Fish, E. W. , Murdaugh, L. B. , Zhang, C. , Boschen, K. E. , Boa‐Amponsem, O. , Mendoza‐Romero, H. N. , … Parnell, S. E. (2019). Cannabinoids exacerbate alcohol teratogenesis by a CB1‐hedgehog interaction. Scientific Reports, 9(1), 16057. 10.1038/s41598-019-52336-w [DOI] [PMC free article] [PubMed] [Google Scholar]
- Fish, E. W. , Tucker, S. K. , Peterson, R. L. , Eberhart, J. K. , & Parnell, S. E. (2021). Loss of tumor protein 53 protects against alcohol‐induced facial malformations in mice and zebrafish. Alcoholism, Clinical and Experimental Research, 45(10), 1965–1979. 10.1111/acer.14688 [DOI] [PMC free article] [PubMed] [Google Scholar]
- Flentke, G. R. , Klingler, R. H. , Tanguay, R. L. , Carvan, M. J. , & Smith, S. M. (2014). An evolutionarily conserved mechanism of calcium‐dependent neurotoxicity in a zebrafish model of fetal alcohol spectrum disorders. Alcoholism, Clinical and Experimental Research, 38(5), 1255–1265. 10.1111/acer.12360 [DOI] [PMC free article] [PubMed] [Google Scholar]
- Harris, B. S. , Bishop, K. C. , Kemeny, H. R. , Walker, J. S. , Rhee, E. , & Kuller, J. A. (2017). Risk factors for birth defects. Obstetrical & Gynecological Survey, 72(2), 123–135. 10.1097/OGX.0000000000000405 [DOI] [PubMed] [Google Scholar]
- Heyne, G. W. , Everson, J. L. , Ansen‐Wilson, L. J. , Melberg, C. G. , Fink, D. M. , Parins, K. F. , … Lipinski, R. J. (2016). Gli2 gene‐environment interactions contribute to the etiological complexity of holoprosencephaly: Evidence from a mouse model. Disease Models & Mechanisms, 9(11), 1307–1315. 10.1242/dmm.026328 [DOI] [PMC free article] [PubMed] [Google Scholar]
- Hong, M. , & Krauss, R. S. (2012). Cdon mutation and fetal ethanol exposure synergize to produce midline signaling defects and holoprosencephaly spectrum disorders in mice. PLoS Genetics, 8(10), e1002999. 10.1371/journal.pgen.1002999 [DOI] [PMC free article] [PubMed] [Google Scholar]
- Hong, M. , & Krauss, R. S. (2017). Ethanol itself is a holoprosencephaly‐inducing teratogen. PLoS One, 12(4), e0176440. 10.1371/journal.pone.0176440 [DOI] [PMC free article] [PubMed] [Google Scholar]
- Hong, M. , & Krauss, R. S. (2018). Modeling the complex etiology of holoprosencephaly in mice. American Journal of Medical Genetics. Part C, Seminars in Medical Genetics, 178(2), 140–150. 10.1002/ajmg.c.31611 [DOI] [PMC free article] [PubMed] [Google Scholar]
- Hu, D. , & Marcucio, R. S. (2009). A SHH‐responsive signaling center in the forebrain regulates craniofacial morphogenesis via the facial ectoderm. Development, 136(1), 107–116. 10.1242/dev.026583 [DOI] [PMC free article] [PubMed] [Google Scholar]
- Hu, D. , Marcucio, R. S. , & Helms, J. A. (2003). A zone of frontonasal ectoderm regulates patterning and growth in the face. Development, 130(9), 1749–1758. 10.1242/dev.00397 [DOI] [PubMed] [Google Scholar]
- Hu, D. , Young, N. M. , Li, X. , Xu, Y. , Hallgrímsson, B. , & Marcucio, R. S. (2015). A dynamic Shh expression pattern, regulated by SHH and BMP signaling, coordinates fusion of primordia in the amniote face. Development, 142(3), 567–574. 10.1242/dev.114835 [DOI] [PMC free article] [PubMed] [Google Scholar]
- Jeong, J. , Kim, D. , & Choi, J. (2022). Application of ToxCast/Tox21 data for toxicity mechanism‐based evaluation and prioritization of environmental chemicals: Perspective and limitations. Toxicology In Vitro, 84, 105451. 10.1016/j.tiv.2022.105451 [DOI] [PubMed] [Google Scholar]
- Khokha, M. K. , Mitchell, L. E. , & Wallingford, J. B. (2017). White paper on the study of birth defects. Birth Defects Res, 109(2), 180–185. 10.1002/bdra.23590 [DOI] [PubMed] [Google Scholar]
- Kietzman, H. W. , Everson, J. L. , Sulik, K. K. , & Lipinski, R. J. (2014). The teratogenic effects of prenatal ethanol exposure are exacerbated by sonic hedgehog or GLI2 haploinsufficiency in the mouse. PLoS One, 9(2), e89448. 10.1371/journal.pone.0089448 [DOI] [PMC free article] [PubMed] [Google Scholar]
- Kimmel, C. B. , Ballard, W. W. , Kimmel, S. R. , Ullmann, B. , & Schilling, T. F. (1995). Stages of embryonic development of the zebrafish. Developmental Dynamics, 203(3), 253–310. 10.1002/aja.1002030302 [DOI] [PubMed] [Google Scholar]
- Krauss, R. S. , & Hong, M. (2016). Gene–environment interactions and the etiology of birth defects. Current Topics in Developmental Biology, 116, 569–580. 10.1016/bs.ctdb.2015.12.010 [DOI] [PubMed] [Google Scholar]
- Krewski, D. , Acosta, D. , Andersen, M. , Anderson, H. , Bailar, J. C. , Boekelheide, K. , … Zeise, L. (2010). Toxicity testing in the 21st century: A vision and a strategy. Journal of Toxicology and Environmental Health. Part B, Critical Reviews, 13(2–4), 51–138. 10.1080/10937404.2010.483176 [DOI] [PMC free article] [PubMed] [Google Scholar]
- Li, Y. X. , Yang, H. T. , Zdanowicz, M. , Sicklick, J. K. , Qi, Y. , Camp, T. J. , & Diehl, A. M. (2007). Fetal alcohol exposure impairs hedgehog cholesterol modification and signaling. Laboratory Investigation, 87(3), 231–240. 3700516 [pii]. 10.1038/labinvest.3700516 [DOI] [PubMed] [Google Scholar]
- Lipinski, R. J. , Hammond, P. , O'Leary‐Moore, S. K. , Ament, J. J. , Pecevich, S. J. , Jiang, Y. , … Sulik, K. K. (2012). Ethanol‐induced face‐brain Dysmorphology patterns are correlative and exposure‐stage dependent. PLoS One, 7(8), e43067. 10.1371/journal.pone.0043067 [DOI] [PMC free article] [PubMed] [Google Scholar]
- Lovely, C. B. , Nobles, R. D. , & Eberhart, J. K. (2014). Developmental age strengthens barriers to ethanol accumulation in zebrafish. Alcohol, 48(6), 595–602. 10.1016/j.alcohol.2014.06.003 [DOI] [PMC free article] [PubMed] [Google Scholar]
- Lubin, A. , Otterstrom, J. , Hoade, Y. , Bjedov, I. , Stead, E. , Whelan, M. , … Payne, E. (2021). A versatile, automated and high‐throughput drug screening platform for zebrafish embryos. Biology Open, 10(9), bio058513. 10.1242/bio.058513 [DOI] [PMC free article] [PubMed] [Google Scholar]
- Mai, C. T. , Isenburg, J. L. , Canfield, M. A. , Meyer, R. E. , Correa, A. , Alverson, C. J. , … Network, N. B. D. P. (2019). National population‐based estimates for major birth defects, 2010‐2014. Birth Defects Research, 111(18), 1420–1435. 10.1002/bdr2.1589 [DOI] [PMC free article] [PubMed] [Google Scholar]
- Marcucio, R. , Hallgrimsson, B. , & Young, N. M. (2015). Facial morphogenesis: Physical and molecular interactions between the brain and the face. Current Topics in Developmental Biology, 115, 299–320. 10.1016/bs.ctdb.2015.09.001 [DOI] [PMC free article] [PubMed] [Google Scholar]
- Marcucio, R. S. , Cordero, D. R. , Hu, D. , & Helms, J. A. (2005). Molecular interactions coordinating the development of the forebrain and face. Developmental Biology, 284(1), 48–61. 10.1016/j.ydbio.2005.04.030 [DOI] [PubMed] [Google Scholar]
- Matthews, T. J. , MacDorman, M. F. , & Thoma, M. E. (2015). Infant mortality statistics from the 2013 period linked birth/infant death data set. National Vital Statistics Reports, 64(9), 1–30. [PubMed] [Google Scholar]
- McCarthy, N. , Sidik, A. , Bertrand, J. Y. , & Eberhart, J. K. (2016). An Fgf‐Shh signaling hierarchy regulates early specification of the zebrafish skull. Developmental Biology, 415(2), 261–277. 10.1016/j.ydbio.2016.04.005 [DOI] [PMC free article] [PubMed] [Google Scholar]
- McCarthy, N. , Wetherill, L. , Lovely, C. B. , Swartz, M. E. , Foroud, T. M. , & Eberhart, J. K. (2013). Pdgfra protects against ethanol‐induced craniofacial defects in a zebrafish model of FASD. Development, 140(15), 3254–3265. 10.1242/dev.094938 [DOI] [PMC free article] [PubMed] [Google Scholar]
- Mich, J. K. , Payumo, A. Y. , Rack, P. G. , & Chen, J. K. (2014). In vivo imaging of hedgehog pathway activation with a nuclear fluorescent reporter. PLoS One, 9(7), e103661. 10.1371/journal.pone.0103661 [DOI] [PMC free article] [PubMed] [Google Scholar]
- Minoux, M. , & Rijli, F. M. (2010). Molecular mechanisms of cranial neural crest cell migration and patterning in craniofacial development. Development, 137(16), 2605–2621. 10.1242/dev.040048 [DOI] [PubMed] [Google Scholar]
- Nelson, K., & Holmes, L. B. (1989). Malformations Due to Presumed Spontaneous Mutations in Newborn Infants. New England Journal of Medicine, 320(1), 19–23. https://doi.org/10.1056/nejm198901053200104 [DOI] [PubMed]
- Park, H. C. , Kim, C. H. , Bae, Y. K. , Yeo, S. Y. , Kim, S. H. , Hong, S. K. , … Huh, T. L. (2000). Analysis of upstream elements in the HuC promoter leads to the establishment of transgenic zebrafish with fluorescent neurons. Developmental Biology, 227(2), 279–293. 10.1006/dbio.2000.9898 [DOI] [PubMed] [Google Scholar]
- Parker, S. E. , Mai, C. T. , Canfield, M. A. , Rickard, R. , Wang, Y. , Meyer, R. E. , … Network, N. B. D. P. (2010). Updated National Birth Prevalence estimates for selected birth defects in the United States, 2004‐2006. Birth Defects Research. Part A, Clinical and Molecular Teratology, 88(12), 1008–1016. 10.1002/bdra.20735 [DOI] [PubMed] [Google Scholar]
- Richard, A. M. , Judson, R. S. , Houck, K. A. , Grulke, C. M. , Volarath, P. , Thillainadarajah, I. , … Thomas, R. S. (2016). ToxCast chemical landscape: Paving the road to 21st century toxicology. Chemical Research in Toxicology, 29(8), 1225–1251. 10.1021/acs.chemrestox.6b00135 [DOI] [PubMed] [Google Scholar]
- Roman, B. L. , Pham, V. N. , Lawson, N. D. , Kulik, M. , Childs, S. , Lekven, A. C. , … Weinstein, B. M. (2002). Disruption of acvrl1 increases endothelial cell number in zebrafish cranial vessels. Development, 129(12), 3009–3019. 10.1242/dev.129.12.3009 [DOI] [PubMed] [Google Scholar]
- Roth, D. M. , Bayona, F. , Baddam, P. , & Graf, D. (2021). Craniofacial development: Neural crest in molecular embryology. Head and Neck Pathology, 15(1), 1–15. 10.1007/s12105-021-01301-z [DOI] [PMC free article] [PubMed] [Google Scholar]
- Schilling, T. F. , & Kimmel, C. B. (1994). Segment and cell type lineage restrictions during pharyngeal arch development in the zebrafish embryo. Development, 120(3), 483–494. 10.1242/dev.120.3.483 [DOI] [PubMed] [Google Scholar]
- Swartz, M. E. , Lovely, C. B. , McCarthy, N. , Kuka, T. , & Eberhart, J. K. (2020). Novel ethanol‐sensitive mutants identified in an F3 forward genetic screen. Alcoholism, Clinical and Experimental Research, 44(1), 56–65. 10.1111/acer.14240 [DOI] [PMC free article] [PubMed] [Google Scholar]
- Swartz, M. E. , Nguyen, V. , McCarthy, N. Q. , & Eberhart, J. K. (2012). Hh signaling regulates patterning and morphogenesis of the pharyngeal arch‐derived skeleton. Developmental Biology, 369(1), 65–75. 10.1016/j.ydbio.2012.05.032 [DOI] [PMC free article] [PubMed] [Google Scholar]
- Swartz, M. E. , Sheehan‐Rooney, K. , Dixon, M. J. , & Eberhart, J. K. (2011). Examination of a palatogenic gene program in zebrafish. Developmental Dynamics, 240(9), 2204–2220. 10.1002/dvdy.22713 [DOI] [PMC free article] [PubMed] [Google Scholar]
- Swartz, M. E. , Wells, M. B. , Griffin, M. , McCarthy, N. , Lovely, C. B. , McGurk, P. , … Eberhart, J. K. (2014). A screen of zebrafish mutants identifies ethanol‐sensitive genetic loci. Alcoholism, Clinical and Experimental Research, 38(3), 694–703. 10.1111/acer.12286 [DOI] [PMC free article] [PubMed] [Google Scholar]
- Tang, J. Y. , & Marghoob, A. A. (2011). Emerging treatments and signaling pathway inhibitors. Seminars in Cutaneous Medicine and Surgery, 30(4 Suppl), S14–S18. 10.1016/j.sder.2011.11.002 [DOI] [PubMed] [Google Scholar]
- Truong, L. , Reif, D. M. , St Mary, L. , Geier, M. C. , Truong, H. D. , & Tanguay, R. L. (2014). Multidimensional in vivo hazard assessment using zebrafish. Toxicological Sciences, 137(1), 212–233. 10.1093/toxsci/kft235 [DOI] [PMC free article] [PubMed] [Google Scholar]
- Varga, Z. M. , Amores, A. , Lewis, K. E. , Yan, Y. L. , Postlethwait, J. H. , Eisen, J. S. , & Westerfield, M. (2001). Zebrafish smoothened functions in ventral neural tube specification and axon tract formation. Development, 128(18), 3497–3509. 10.1242/dev.128.18.3497 [DOI] [PubMed] [Google Scholar]
- Vogt, A. , Codore, H. , Day, B. W. , Hukriede, N. A. , & Tsang, M. (2010). Development of automated imaging and analysis for zebrafish chemical screens. Journal of Visualized Experiments, (40), 1900. 10.3791/1900 [DOI] [PMC free article] [PubMed] [Google Scholar]
- Wada, N. , Javidan, Y. , Nelson, S. , Carney, T. J. , Kelsh, R. N. , & Schilling, T. F. (2005). Hedgehog signaling is required for cranial neural crest morphogenesis and chondrogenesis at the midline in the zebrafish skull. Development, 132(17), 3977–3988. 10.1242/dev.01943 [DOI] [PubMed] [Google Scholar]
- Walker, M. B. , & Kimmel, C. B. (2007). A two‐color acid‐free cartilage and bone stain for zebrafish larvae. Biotechnic & Histochemistry, 82(1), 23–28. 10.1080/10520290701333558 [DOI] [PubMed] [Google Scholar]
- Walker, S. L. , Ariga, J. , Mathias, J. R. , Coothankandaswamy, V. , Xie, X. , Distel, M. , … Mumm, J. S. (2012). Automated reporter quantification in vivo: High‐throughput screening method for reporter‐based assays in zebrafish. PLoS One, 7(1), e29916. 10.1371/journal.pone.0029916 [DOI] [PMC free article] [PubMed] [Google Scholar]
- Wang, G. , Rajpurohit, S. K. , Delaspre, F. , Walker, S. L. , White, D. T. , Ceasrine, A. , … Mumm, J. S. (2015). First quantitative high‐throughput screen in zebrafish identifies novel pathways for increasing pancreatic β‐cell mass. eLife, 4, e08261. 10.7554/eLife.08261 [DOI] [PMC free article] [PubMed] [Google Scholar]
- Wang, J. , Lu, J. , Mook, R. A. , Zhang, M. , Zhao, S. , Barak, L. S. , … Chen, W. (2012). The insecticide synergist piperonyl butoxide inhibits hedgehog signaling: Assessing chemical risks. Toxicological Sciences, 128(2), 517–523. 10.1093/toxsci/kfs165 [DOI] [PMC free article] [PubMed] [Google Scholar]
- Westerfield, M. (1993). The zebrafish book: a guide for the laboratory use of zebrafish (Brachydanio rerio). M. Westerfield.
- Whitlock, K. E. , Smith, K. M. , Kim, H. , & Harden, M. V. (2005). A role for foxd3 and sox10 in the differentiation of gonadotropin‐releasing hormone (GnRH) cells in the zebrafish Danio rerio. Development, 132(24), 5491–5502. 10.1242/dev.02158 [DOI] [PubMed] [Google Scholar]
- Yang, X. , Zeng, J. , Gu, Y. , Fang, Y. , Wei, C. , Tan, S. , & Zhang, X. (2022). Birth defects data from hospital‐based birth defect surveillance in Guilin, China, 2018‐2020. Frontiers in Public Health, 10, 961613. 10.3389/fpubh.2022.961613 [DOI] [PMC free article] [PubMed] [Google Scholar]
- Zhang, C. , Frazier, J. M. , Chen, H. , Liu, Y. , Lee, J. A. , & Cole, G. J. (2014). Molecular and morphological changes in zebrafish following transient ethanol exposure during defined developmental stages. Neurotoxicology and Teratology, 44, 70–80. 10.1016/j.ntt.2014.06.001 [DOI] [PMC free article] [PubMed] [Google Scholar]
- Zhang, C. , Ojiaku, P. , & Cole, G. J. (2013). Forebrain and hindbrain development in zebrafish is sensitive to ethanol exposure involving agrin, Fgf, and sonic hedgehog function. Birth Defects Research. Part A, Clinical and Molecular Teratology, 97(1), 8–27. 10.1002/bdra.23099 [DOI] [PMC free article] [PubMed] [Google Scholar]
Associated Data
This section collects any data citations, data availability statements, or supplementary materials included in this article.
Supplementary Materials
Figure S1 Validation of neural crest defects with alternative fluorescent marker sox10:EGFP. (A–D) Fluorescent images of 26 hpf sox10:EGFP embryos exposed to control or the indicated concentration of ethanol from 6–24 hpf showing dose‐dependent reduction of fluorescence. (E) Column graph showing sox10:EGFP fluorescence reading for each embryo (open circles). Black bars show mean fluorescence in relative fluorescence units (RFU) for each group ± SEM. Sample sizes: control n = 14; 1% ETOH n = 14; 1.25% ETOH n = 14; 1.5% ETOH n = 13. Statistic: two‐tailed ANOVA with Tukey's multiple comparison's correction between all groups. ** = p < .01, *** p < .001. Scale bar = 0.2 mm. RFU = relative fluorescence units. ETOH = ethanol.
Figure S2 Body length(BL)‐normalized morphological measurements. (A–D) Column graphs showing each embryo's body length‐normalized morphological measurement for each endpoint. Black bars show mean measurement for each group ± SEM. Statistics: two‐tailed ANOVA with Tukey's multiple comparison's correction between all groups. * = p < .05, ** = p < .01, *** = p < .001, and **** p < .0001. ETOH = ethanol.
Figure S3 BL‐normalized morphological measurements versus fluorescence correlation. (A–D) Scatter plots of pair‐wise comparisons for each embryo, where (x = BL‐normalized morphological measurement at 5 dpf, y = fluorescence at 1 dpf). Data points are color coded by treatment group (black = control, light gray = 1% ETOH, dark gray = 1.5% ETOH, black = 2% ETOH.) Linear regression analysis mean (solid line) ± standard error (dotted lines). R 2 ‐value (coefficient of determination), r‐value (Pearson's correlation coefficient), and correlation p values are shown. RFU = relative fluorescence units. ETOH = ethanol.
Figure S4 Embryo angle does not significantly impact measured fluorescence. (A–B) Control embryos were manually sorted into flat or angled (i.e., slightly oblique) groups using their embryo images. (C) Column graph showing fli1:EGFP fluorescence for each embryo (open circles) comparing mean fluorescence in flat and angled embryos. Black bars show mean fluorescence for each group ± SEM. Sample sizes: flat n = 8, angled n = 7. Statistic: two‐tailed, unpaired student's t‐test. (D) Estimation plot showing the effect size (difference between the mean fluorescence of flat vs. angled embryos) marked by dashed lines. The effect size from embryo angle was small (distance between the dashed lines) compared to normal biological variability (error bars). RFU = relative fluorescence units.
Data Availability Statement
The data that support the findings of this study are available from the corresponding author upon reasonable request.