

Abstract
Background:
Postoperative mortality for oropharynx squamous cell carcinoma (OPSCC) with transoral robotic surgery (TORS) varies from 0.2% to 6.5% on trials; the real-world rate is unknown.
Methods:
NCDB study from 2010 to 2017 for patients with cT1–2N0–2M0 OPSCC with Charleson–Deyo score 0–1. Ninety-day mortality assessed from start and end of treatment at Commission on Cancer-accredited facilities.
Results:
3639 patients were treated with TORS and 1937 with radiotherapy. TORS cohort had more women and higher income, was younger, more often treated at academic centers, and more likely to have private insurance (all p < 0.05). Ninety-day mortality was 1.3% with TORS and 0.7% or 1.4% from start or end of radiotherapy, respectively. From end of therapy, there was no significant difference on MVA between treatment modality.
Conclusions:
There is minimal difference between 90-day mortality in patients treated with TORS or radiotherapy for early-stage OPSCC. While overall rates are low, for patients with expectation of cure, work is needed to identify optimal treatment.
Keywords: 90-day mortality, organ preservation, oropharynx cancer, postoperative mortality, radiotherapy, transoral robotic surgery
1 |. INTRODUCTION
Traditionally, curative management of oropharynx squamous cell carcinoma (OPSCC) involved definitive radiotherapy (RT) with or without chemotherapy.1 After FDA approval of transoral robotic surgery (TORS) in 2009 for patients with T classification 1–2 disease, upfront surgery rates for OPSCC increased.2 ECOG-ACRIN 3311 (EA3311) has established the safety of TORS among rigorously credentialed surgeons, with a 0.2% rate of postoperative mortality.3,4 This study also established the curative potential of TORS. The only randomized trials directly comparing TORS to RT are the ORATOR trials. The first ORATOR trial showed a statistically, though not clinically, significant detriment in swallowing function with TORS and reported a 2.9% rate of postoperative mortality.5 ORATOR-2 closed early due to excess morbidity of TORS with 6.5% of patients having surgery-related deaths.6,7 The national rate, outside of a clinical trial setting, of postoperative mortality for OPSCC is unknown, yet of critical importance given that modern treatments may confer >90% cure rates for patients with early-stage disease.3,5,6 We assessed 90-day mortality for patients with OPSCC treated at centers credentialed with the American College of Surgeons and the American Cancer Society in the United States.
2 |. MATERIALS AND METHODS
2.1 |. Cohort derivation
The National Cancer Database (NCDB) provides deidentified data from over 1500 hospitals representing approximately 70% of new cancer diagnoses in the United States.8 Since identifiable patient information was not used, this study was exempt from institutional approval and informed consent. We queried the NCDB for patients treated from 2010 to 2017 with AJCC 7th Edition Stage clinical T-classification 1–2, N classification 0–2, M classification 0 OPSCC, and Charlson–Deyo composite comorbidity score 0–1. We excluded patients with missing vital status, and patients with systemic therapy delivered prior to surgery. TORS cohort included patients with definitive intent robotic surgery to the primary site. We only included patients with known neck dissection status. Patient selection criteria as well as NCDB codes are detailed in Table S1, Supporting Information. RT cohort included patients receiving at least 45 Gy cumulative dose without surgery (Table S2). RT cohort was evaluated both using treatment start and treatment end as time zero for separate analyses.
2.2 |. Covariates
We evaluated patient factors (age, sex, race, insurance, median income, Charlson–Deyo score) as well as tumor factors (lymphovascular space invasion [LVSI], HPV status, extracapsular extension [ECE], and number of lymph nodes involved [0, 1–4, vs. 5+]), and treatment factors (facility type, surgical margins, number of lymph nodes examined [0, 1–6, 7–15, 16–25, vs. 25+], and year of treatment). Concurrent chemotherapy use was defined as chemotherapy start within 2 weeks of radiation start. Facility treatment volume was evaluated based upon patients included in this study.
2.3 |. Outcomes
Ninety-day mortality was assessed using vital status 90-days from TORS or from first day of radiation as a binary variable. We evaluated the associations of covariates on 90-day mortality following TORS. We then compared differences in distribution of covariates between TORS and RT cohorts. Finally, we evaluated associations between covariates (including TORS vs. RT) on 90-day mortality for the combined TORS and RT cohort as well as between the highest and lowest quartile of facility treatment volume stratified by treatment modality.
2.4 |. Statistical methods
Data analyses were done in SAS® 9.4 (Cary, NC) by SAS® macros developed by the Biostatistics Shared Resource at the Winship Cancer Institute as well as R (R Core Team, 2020), RStudio (Rstudio Team, 2020).9 The significance level was set a priori at p ≤ 0.05. Associations with 90-day mortality were evaluated in univariate and multivariable (MVA) logistic regression models using backward elimination with an alpha level of removal of 0.2. Balance of distributions of factors between the cohorts was assessed with chi-square or ANOVA as appropriate. Cumulative incidence plots were created for 0–90-day survival for TORS and radiotherapy cohorts using the R package “survimer” with comparison of groups using Fine-Gray p-value.
3 |. RESULTS
There were 3639 patients in the TORS cohort and the 90-day mortality rate was 1.3% (n = 49). Table 1 shows baseline demographic features and covariates associated with 90-day mortality. On multivariable analysis (MVA), 90-day mortality was significantly higher with older age (OR 1.07, 95%CI: 1.04–1.11, p < 0.001), higher Charlson–Deyo comorbidity score (OR for 0 vs. 1+: 0.49, 95%CI: 0.27–0.90, p = 0.021), LVSI present (OR 2.09, 95%CI: 1.10–3.97, p = 0.025), and positive surgical margins (OR 2.35, 95%CI: 1.26–4.38, p = 0.007). There was no significant difference in odds of 90-day mortality between tonsil and base of tongue primary (OR 1.19, 95%CI: 0.64– 2.21, p = 0.590), but on univariate analysis there was significantly higher odds of 90-day mortality with posterior pharyngeal wall primary compared to tonsil (OR 3.71, 95%CI: 1.64–8.40, p = 0.002).
TABLE 1.
Univariate and multivariable associations with 90-day mortality for TORS cohort
| 90-day mortality |
||||||
|---|---|---|---|---|---|---|
| Covariate | Level | No. (%) | UVA OR (95%CI) | UVA p-value | MVA OR (95%CI) | MVA p-value |
| Age (continuous) | Mean (SD) | 59.6 (9.4) | 1.08 (1.05–1.12) | <0.001 | 1.07 (1.04–1.11) | <0.001 |
| Sex | Male | 3039 (83.5%) | 0.88 (0.42–1.81) | 0.721 | ||
| Female | 600 (16.5%) | |||||
| Race | White | 3369 (92.6%) | 0.90 (0.32–2.52) | 0.842 | ||
| Nonwhite | 270 (7.4%) | |||||
| Charlson–Deyo score | 0 | 3012 (82.8%) | 0.39 (0.21–0.70) | 0.002 | 0.49 (0.27–0.90) | 0.021 |
| 1+ | 627 (17.2%) | |||||
| Insurance | Medicare | 1046 (28.7%) | 1.78 (0.68–4.68) | 0.239 | ||
| Private | 2238 (61.5%) | 0.57 (0.21–1.54) | 0.266 | |||
| None or Medicaid | 355 (9.8%) | |||||
| Median income | <$40227 | 405 (13.0%) | 1.79 (0.76–4.22) | 0.182 | ||
| $40227–$50353 | 564 (18.2%) | 1.12 (0.46–2.73) | 0.807 | |||
| $50354–$63332 | 696 (22.4%) | 2.09 (1.04–4.21) | 0.038 | |||
| ≥$63333 | 1439 (46.4%) | |||||
| Year of diagnosis | After 2013 | 1988 (54.6%) | 1.02 (0.58–1.80) | 0.947 | ||
| Before 2013 | 1651 (45.4%) | |||||
| Treatment facility | Academic | 2996 (82.3%) | 0.59 (0.31–1.12) | 0.105 | ||
| Nonacademic | 643 (17.7%) | |||||
| Oropharynx subsite | Tonsil | 2070 (56.9%) | ||||
| Base of tongue | 1369 (37.6%) | 1.19 (0.64–2.21) | 0.590 | |||
| Posterior pharynx | 200 (5.5%) | 3.71 (1.64–8.40) | 0.002 | |||
| HPV status | Positive | 2371 (82.9%) | 0.45 (0.21–0.95) | 0.037 | ||
| Negative | 489 (17.1%) | |||||
| Extracapsular extension | Present | 927 (29.8%) | 1.30 (0.62–2.73) | 0.485 | ||
| Not present | 2188 (70.2%) | |||||
| Lymphovascular invasion | Present | 2322 (74.0%) | 1.91 (1.05–3.50) | 0.034 | 2.09 (1.10–3.97) | 0.025 |
| Not present | 817 (26.0%) | |||||
| Surgical margins | Positive | 523 (14.7%) | 2.97 (1.62–5.45) | <0.001 | 2.35 (1.26–4.38) | 0.007 |
| Negative | 3044 (85.3%) | |||||
| Pathologic T-stage | T1-T2 | 3323 (94.1%) | ||||
| T3-T4 | 207 (5.9%) | 2.39 (1.00–5.69) | 0.049 | |||
| Number of lymph nodes positive | 5+ | 347 (9.5%) | 0.96 (0.42–2.13) | 0.915 | 0.78 (0.33–1.82) | 0.558 |
| 1–4 | 2211 (60.8%) | 0.28 (0.15–0.53) | <0.001 | 0.32 (0.17–0.62) | <0.001 | |
| 0 | 1081 (29.7%) | |||||
| Regional lymph nodes examined | ≥26 | 2075 (58.9%) | 0.18 (0.08–0.38) | <0.001 | ||
| 16–25 | 726 (20.6%) | 0.40 (0.18–0.90) | 0.027 | |||
| 7–15 | 273 (7.7%) | 0.58 (0.22–1.55) | 0.280 | |||
| 1–6 | 101 (2.9%) | 0.52 (0.12–2.36) | 0.400 | |||
| 0 | 350 (9.9%) | |||||
Note: With backward selection, Charlson–Deyo score, income, facility, HPV status, and nodes examined or involved were removed from the model. Bold values were those considered statistically significant based on cutoff of p < 0.05.
Abbreviations: anyAT, any adjuvant therapy; CI, confidence interval; HPV, human papillomavirus; MVA, multivariable analysis; noAT, no adjuvant therapy; OR, odds ratio; UVA, univariate analysis.
There were 1937 patients in the RT cohort and the 90-day mortality rate was 0.7% (n = 14) when assessed from start of treatment and 1.4% (n = 26) when assessed from end of treatment (Fine-Gray p = 0.035). Figure 1 shows cumulative incidence of death in first 90 days for TORS and RT cohorts both from start and completion of therapy. Table 2 compares baseline demographic features between the TORS and RT cohorts. The TORS cohort was significantly younger (p = 0.015) and had significantly higher proportion of women (p < 0.001). Notably, while patients treated at academic centers were more than three times as likely to be treated with TORS, patients treated at nonacademic centers were more likely to be treated with definitive radiotherapy (p < 0.001). Of the 1527 patients treated with RT with available data on concurrent systemic therapy use, 1373 received concurrent chemotherapy (89.9%), 154 did not receive chemotherapy (10.1%). Of the 1937 patients treated with RT, 410 had missing data about concurrent systemic therapy use.
FIGURE 1.
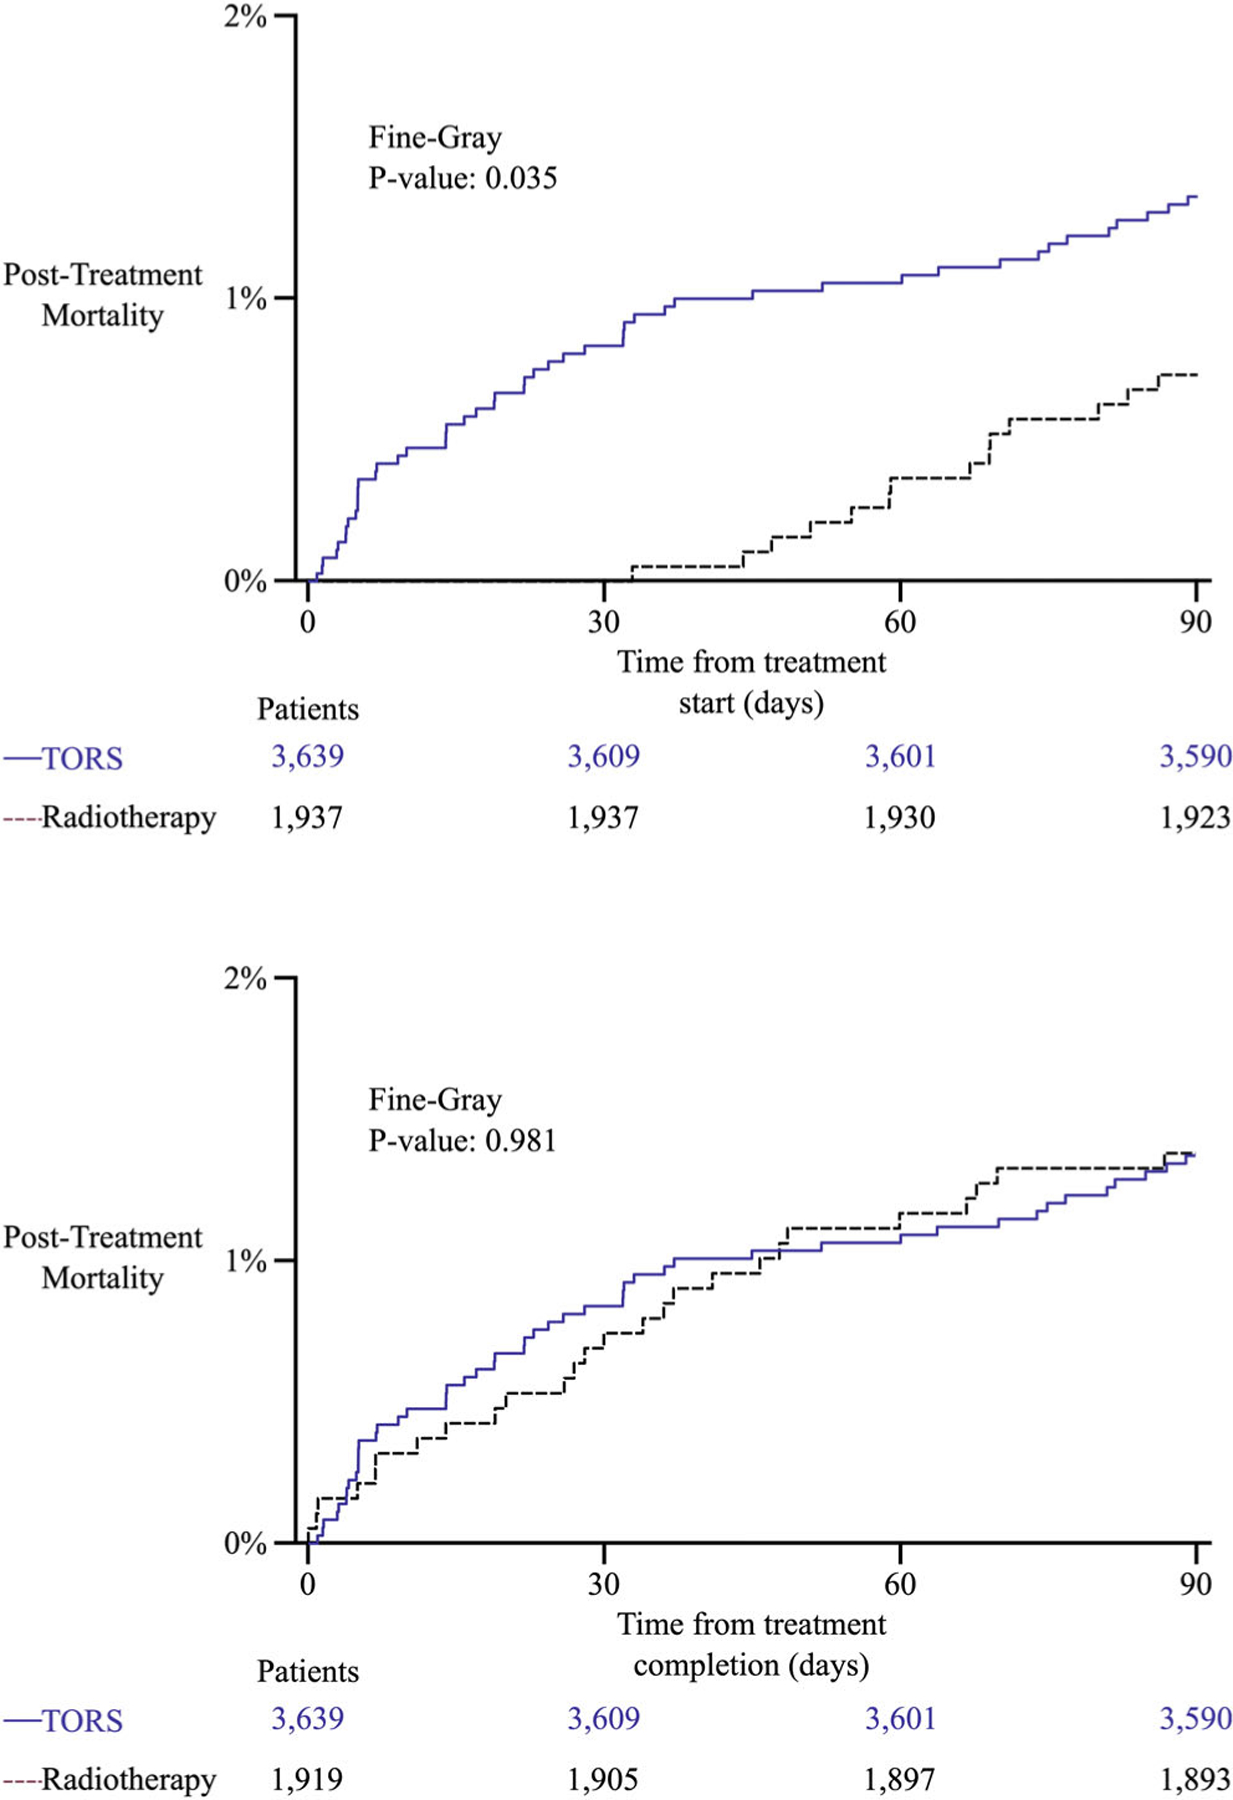
Cumulative incidence function curves for mortality during first 90-days from start and completion of treatment for transoral robotic surgery (TORS) and radiotherapy cohorts
TABLE 2.
Differences between TORS and radiotherapy cohorts
| Cohort |
||||
|---|---|---|---|---|
| Covariate | Level | TORS (n = 3794) | RT (n = 1937) | Parametric p-value |
| Age | Mean (SD) | 59.6 (9.4) | 60.3 (9.3) | 0.015 |
| Sex | Male | 3039 (83.5%) | 1684 (86.9%) | <0.001 |
| Female | 600 (16.5%) | 253 (13.1%) | ||
| Race | White | 3369 (92.6%) | 1799 (92.9%) | 0.687 |
| Nonwhite | 270 (7.4%) | 138 (7.1%) | ||
| Charlson–Deyo score | 0 | 3012 (82.8%) | 1644 (84.9%) | 0.044 |
| 1 | 627 (17.2%) | 293 (15.1%) | ||
| Insurance | Medicare | 1046 (28.7%) | 528 (27.3%) | <0.001 |
| Private | 2238 (61.5%) | 1141 (58.9%) | ||
| None or Medicaid | 355 (9.8%) | 268 (13.8%) | ||
| Median income | <$40227 | 405 (13.0%) | 269 (15.0%) | 0.034 |
| $40227–$50353 | 564 (18.2%) | 352 (19.6%) | ||
| $50354–$63332 | 696 (22.4%) | 414 (23.1%) | ||
| ≥$63333 | 1439 (46.4%) | 760 (42.3%) | ||
| Treatment facility | Academic | 2996 (82.3%) | 996 (51.4%) | <0.001 |
| Nonacademic | 643 (17.7%) | 941 (48.6%) | ||
| HPV status | Positive | 2371 (82.9%) | 1151 (83.8%) | 0.449 |
| Negative | 489 (17.1%) | 222 (16.2%) | ||
Note: Bold values were those considered statistically significant based on cutoff of p < 0.05.
Abbreviations: HPV, human papillomavirus; RT, definitive radiotherapy; TORS, transoral robotic surgery; SD, standard deviation.
When assessed from treatment start, higher 90-day mortality was significantly associated on MVA with TORS compared to RT (OR 1.98; 95%CI: 1.09–3.60, p = 0.026) and age (OR 1.09; 95%CI: 1.06–1.11, p < 0.001). When assessed from treatment end, higher 90-day mortality was significantly associated on MVA with age (OR 1.08; 95%CI: 1.05–1.11, p < 0.001) and lower 90-day mortality was associated with HPV-positive disease compared to HPV-negative (OR 0.50; 95%CI: 0.27–0.93, p = 0.028), Medicare insurance compared to uninsured or Medicaid (OR 0.46; 95%CI: 0.22–0.94, p = 0.033), and Private insurance compared to uninsured or Medicaid (OR 0.42; 95%CI: 0.21–0.83, p = 0.013). Table S3 describes both univariate and multivariable analyses for 90-day mortality in the combined cohort of TORS and RT patients for both time from treatment start and treatment end.
By institutional treatment volume, the 90-day mortality rate after TORS was 1.1% (n = 10 of 872) and 2.0% (n = 19 of 940) at institutions in the highest and lowest quartile of treatment volume, respectively. The 90-day mortality rate from start of RT was 0.3% (n = 1 of 397) and 1.6% (n = 8 of 488) at institutions in the highest and lowest quartile of treatment volume, respectively. There was no significant difference in 90-day mortality after TORS based on treatment at high compared to low volume institution (2-tailed p = 0.138), but there was significantly higher 90-day mortality after RT when patients were treated at a low volume institution (2-tailed p = 0.041).
4 |. DISCUSSION
Ninety-day mortality for patients with OPSCC treated with TORS or RT in the United States is 1%–2% likely without clinically meaningful difference between modality. Controversy over the different rates of Grade 5 toxicity on ORATOR2 (6.5%) and EA3311 (0.2%) centers on surgical technique.3 Critics of ORATOR argue that 1 cm margins and routine tracheostomy use led to worse outcomes.10 Additionally, the small study size meant that one or two events explained the 2.9% and 6.5% Grade 5 toxicity rates on ORATOR and ORATOR2, respectively.5–7
Surgeons on EA3311 underwent far more rigorous credentialing beyond AHNS certification requirements.11 Surgeons were required to have ≥20 documented cases, ≥1 mm margins in >90% of prior cases, and meet secondary criteria based on adjuvant therapies, lymph nodes dissected, and postoperative bleeding rates.4 Among 359 eligible patients, only 1 Grade 5 toxicity was attributed to TORS (0.2%).3 However, not all patients have access to such highly specialized surgeons. Notably though, we observed no statistically significant difference between 90-day mortality at high- and low-volume institutions (1.1% vs. 2.0%, p = 0.14). Our observations more accurately convey the risks and outcomes for patients treated by a broader spectrum of surgeons at hospitals credentialed with the American College of Surgeons including a 1.3% postoperative mortality rate and 14.7% rate of positive margins. We can only speculate that outcomes at non-credentialed centers are unlikely to be superior.
In the modern era of HPV and TORS for OPSCC, Dr Blake Cady’s wisdom remains true: “Biology is King, selection of cases is Queen.”12 High cure rates and potential for high burden of treatment toxicity have motivated deescalation approaches. As such, patient selection for upfront management remains a source of vigorous debate. Retrospective data initially suggested superiority of TORS,13 but in light of ORATOR, those results could have been confounded by eligibility criteria. Furthermore, for patients treated with definitive radiotherapy, favorable candidates for TORS have better outcomes than similarly staged patients who are unfavorable TORS candidates.14 Whereas prospective trials are limited by highly controlled clinical environments, the NCDB provides real world evidence highlighting the experience of a more generalized population.
Study limitations include missing data and biases. Notably, cause of death or disease-specific survival are not coded in the NCDB. As such we cannot report details about whether or not deaths were related to treatment. While radiotherapy is a noninvasive treatment, possible early causes of death for patients could include failure to thrive secondary to mucositis or complications for urgent parenteral feeding tube placement, infection from high-grade skin desquamation, or unrelated causes. While this study only analyzed patients with Charleson–Deyo scores of 0–1, that could include patients with prior myocardial infarction or stroke, congestive heart failure, or COPD. Additionally, poor recovery after surgery confounds associations with pathologic features (e.g., a patient planned for staged neck dissection that dies peri-operatively will be coded as 0 lymph nodes dissected). Assessing institutional practice patterns such as upfront management preferences, adjuvant therapy use, and time to adjuvant therapy initiation are subject to multiple confounding variables, and are beyond the scope of this analysis. Our assessment of treatment volume does not capture the full breadth of surgical expertise such as non-TORS operative volume or individual provider metrics such as rate of negative margins, adequacy of lymph node dissections, and postoperative bleeding rates that were assessed for surgeons credentialed on EA3311.
Using the NCDB, which captures 70% of all cancer diagnoses in the United States, we showed that the rate of 90-day mortality following TORS is 1.3% for patients with OPSCC and 0.7%–1.4% for RT. Cure rates for early-stage patients exceed 90% underscoring importance of patient selection and informed consent about nontrivial risks of surgical mortality, even with TORS.
Supplementary Material
ACKNOWLEDGMENT
Research reported in this publication was supported in part by the Biostatistics Shared Resource of Winship Cancer Institute of Emory University and NIH/NCI under award number P30CA138292. The content is solely the responsibility of the authors and does not necessarily represent the official views of the National Institutes of Health.
Funding information
NIH/NCI, Grant/Award Number: P30CA138292
Footnotes
CONFLICT OF INTEREST
The authors declare that there is no conflict of interest that could be perceived as prejudicing the impartiality of the research reported.
SUPPORTING INFORMATION
Additional supporting information can be found online in the Supporting Information section at the end of this article.
DATA AVAILABILITY STATEMENT
The primary dataset (National Cancer Database) is available publicly through the American College of Surgeons (https://www.facs.org/quality-programs/cancer/ncdb).
REFERENCES
- 1.Gillison ML, Trotti AM, Harris J, et al. Radiotherapy plus cetuximab or cisplatin in human papillomavirus-positive oropharyngeal cancer (NRG Oncology RTOG 1016): a randomised, multicentre, non-inferiority trial. Lancet 2019;393(10166):40–50. doi: 10.1016/S0140-6736(18)32779-X [DOI] [PMC free article] [PubMed] [Google Scholar]
- 2.Cracchiolo JR, Baxi SS, Morris LG, et al. Increase in primary surgical treatment of T1 and T2 oropharyngeal squamous cell carcinoma and rates of adverse pathologic features: National Cancer Data Base. Cancer 2016;122(10):1523–1532. doi: 10.1002/cncr.29938 [DOI] [PMC free article] [PubMed] [Google Scholar]
- 3.Ferris RL, Flamand Y, Weinstein GS, et al. Phase II randomized trial of transoral surgery and low-dose intensity modulated radiation therapy in resectable p16+ locally advanced oropharynx cancer: an ECOG-ACRIN cancer research group trial (E3311). J Clin Oncol 2021;40:138–149. doi: 10.1200/JCO.21.01752 [DOI] [PMC free article] [PubMed] [Google Scholar]
- 4.Ferris RL, Flamand Y, Holsinger FC, et al. A novel surgeon credentialing and quality assurance process using transoral surgery for oropharyngeal cancer in ECOG-ACRIN Cancer Research Group Trial E3311. Oral Oncol 2020;110:104797. doi: 10.1016/j.oraloncology.2020.104797 [DOI] [PMC free article] [PubMed] [Google Scholar]
- 5.Nichols AC, Theurer J, Prisman E, et al. Radiotherapy versus transoral robotic surgery and neck dissection for oropharyngeal squamous cell carcinoma (ORATOR): an open-label, phase 2, randomised trial. Lancet Oncol 2019;20(10):1349–1359. doi: 10.1016/S1470-2045(19)30410-3 [DOI] [PubMed] [Google Scholar]
- 6.Palma D, Nichols A. A phase II randomized trial of treatment de-escalation for HPV associated oropharyngeal squamous cell carcinoma: radiotherapy vs. trans-oral surgery (ORATOR 2) 2021. [DOI] [PMC free article] [PubMed]
- 7.Palma DA, Prisman E, Berthelet E, et al. Assessment of toxic effects and survival in treatment deescalation with radiotherapy vs transoral surgery for HPV-associated oropharyngeal squamous cell carcinoma: the ORATOR2 phase 2 randomized clinical trial. JAMA Oncol 2022;8:1–7. doi: 10.1001/jamaoncol.2022.0615 [DOI] [PMC free article] [PubMed] [Google Scholar]
- 8.Boffa DJ, Rosen JE, Mallin K, et al. Using the national cancer database for outcomes research a review. JAMA Oncol 2017; 3(12):1722–1728. doi: 10.1001/jamaoncol.2016.6905 [DOI] [PubMed] [Google Scholar]
- 9.Liu Y, Nickleach DC, Zhang C, Switchenko JM, Kowalski J. Carrying out streamlined routine data analyses with reports for observational studies: introduction to a series of generic SAS®macros. F1000Research 2019;7:1955. doi: 10.12688/f1000research.16866.2 [DOI] [PMC free article] [PubMed] [Google Scholar]
- 10.Grégoire V, Nicolai P. Choosing surgery or radiotherapy for oropharyngeal squamous cell carcinoma: is the issue definitely settled? Lancet Oncol 2019;20(10):1328–1329. doi: 10.1016/S1470-2045(19)30495-4 [DOI] [PubMed] [Google Scholar]
- 11.AHNS. Transoral robotic training curriculum for fellows; American Head & Neck Society.
- 12.Cady B Basic principles in surgical oncology. Arch Surg 1997; 132(4):338–346. doi: 10.1001/ARCHSURG.1997.01430280012001 [DOI] [PubMed] [Google Scholar]
- 13.Yeh DH, Tam S, Fung K, et al. Transoral robotic surgery vs. radiotherapy for management of oropharyngeal squamous cell carcinoma—a systematic review of the literature. Eur J Surg Oncol 2015;41(12):1603–1614. doi: 10.1016/j.ejso.2015.09.007 [DOI] [PubMed] [Google Scholar]
- 14.Fnais N, Laxague F, Alzahrani F, et al. The impact of surgical resectability on outcomes for patients undergoing primary radiation treatment for human papillomavirus-related oropharygeal cancer. Int J Radiat Oncol Biol Phys. 2022;113:521–529. doi: 10.1016/J.IJROBP.2022.02.025 [DOI] [PubMed] [Google Scholar]
Associated Data
This section collects any data citations, data availability statements, or supplementary materials included in this article.
Supplementary Materials
Data Availability Statement
The primary dataset (National Cancer Database) is available publicly through the American College of Surgeons (https://www.facs.org/quality-programs/cancer/ncdb).