

Abstract
Background:
Early life environmental exposures may affect bone mass accrual in childhood, but only one study has assessed the role of environmental phenols on child bone health.
Methods:
We used data from 223 mother-child dyads enrolled in the Health Outcomes and Measures of the Environment (HOME) Study (Cincinnati, OH; 2003–2006). We quantified benzophenone-3, bisphenol A (BPA), 2,5-dichlorophenol, and triclosan in maternal urine collected at 16- and 26-weeks gestation and calculated the average of creatinine-adjusted concentrations. We performed dual x-ray absorptiometry at age 12 years and calculated Z-scores for whole body (less head), total hip, femoral neck, and 1/3rd distal radius bone mineral content (BMC) and areal bone mineral density (aBMD) as well as ultra-distal radius aBMD and spine BMC and bone mineral apparent density (BMAD). We estimated covariate-adjusted associations per doubling of maternal urinary environmental phenol concentrations in linear regression models. We also examined effect measure modification by child’s sex and estimated associations of the environmental phenol mixture with BMC and aBMD using quantile g-computation.
Results:
We observed generally null associations for all analytes and bone measures. Yet, in adjusted models, higher urinary 2,5-dichlorophenol concentrations were associated with higher 1/3rd distal radius BMC (β: 0.09; 95% CI: 0.02, 0.17) and aBMD (β: 0.09; 95% CI: 0.02, 0.17) Z-scores in the overall sample. In sex-stratified analyses, the magnitude of the BMC association was positive for females (β: 0.16; 95% CI: 0.06, 0.26) and null for males (β: 0.02; 95% CI: −0.08, 0.13). The environmental phenol mixture was associated with greater 1/3rd distal radius BMC and aBMD Z-scores in both sexes, which was mostly driven by benzophenone-3 in males and 2,5-dichlorophenol in females.
Conclusion:
In this prospective cohort study, we observed generally null associations for environmental phenols with BMC and aBMD at age 12 years. While there was a positive association of 2,5-dichlorophenol concentrations during fetal development with distal radius BMC and aBMD at age 12 years, future studies utilizing methods capable of differentiating cortical and trabecular bone are needed to elucidate potential mechanisms and implications for bone strength and microarchitecture.
Keywords: Bisphenol A; bone mineral density; children; environmental phenols; 2,5-dichlorophenol
Introduction
Bone mass accrual during early childhood is critical for lifelong bone health (Weaver et al., 2016). Bone mass accretion begins during fetal growth, increases slowly during childhood, and bone mass accretion velocity peaks during puberty (Bailey et al., 1999; Weaver et al., 2016). Although bone accrual continues after puberty, 95% of adult bone mass is achieved within four years following the peak velocity (Baxter-Jones et al., 2011). Low bone mineral density (BMD) during childhood is linked with lower peak bone mass in young adulthood (Wren et al., 2014), with low peak bone mass being a major factor in the development of bone fractures and osteoporosis in older adults (Bonjour et al., 1994). Osteoporosis, characterized by low BMD (T-score < −2), affects more than 10 million adults over age 50 years (10.3%) in the USA (Wright et al., 2014). Thus, determining whether environmental exposures affect optimal bone accrual in early life has long-lasting implications for reducing risk of fractures and osteoporosis later in life.
Environmental phenols (including bactericides, benzophenones, and bisphenols) are ubiquitous endocrine-disrupting chemicals found in personal care products, plastics, and cleaning supplies (Diamanti-Kandarakis et al., 2009). Although environmental phenols are non-persistent chemicals excreted within 24 hours (Völkel et al., 2002; Weatherly and Gosse, 2017), the ubiquity of exposure sources leads to ongoing exposures that may have a profound health effect (Jeon et al., 2008). Environmental phenols have been shown to affect skeletal formation and remodeling (Agas et al., 2018; Agas et al., 2013; Chin et al., 2018; Smith et al., 2017; Thent et al., 2018; Turan, 2021; Vitku et al., 2018). While the exact mechanisms are not known, environmental phenols may disrupt bone metabolism through binding with estrogen receptors α and β, or by inducing inflammation and oxidative stress (Chin et al., 2018; Yang et al., 2009).
Most human epidemiologic studies of environmental phenols and bone health have been cross-sectional and among adult populations, and they have reported inconsistent associations (Cai et al., 2019; Vitku et al., 2018; Wang et al., 2020). One cross-sectional study of postmenopausal women using 2005–2010 National Health and Nutrition Examination Survey (NHANES) data found a positive association of urinary 2,5-dicholorophenol concentrations with greater femoral neck areal BMD (aBMD) as well as an association of urinary triclosan concentrations with lower femoral neck aBMD (Wang et al., 2020). Similarly, Cai et al. (2019) reported an association of higher urinary triclosan concentrations with lower total femur, intertrochanteric region (i.e., where the thigh and hip muscles attach to the femur), and lumbar spine aBMD among women aged ≥20 years in 2005–2010 NHANES. Additionally, women in the highest tertile of triclosan concentration had elevated prevalence of osteoporosis compared with women in the lowest tertile (Cai et al., 2019).
The developing fetus may be particularly susceptible to endocrine-disrupting chemicals because many of them, including environmental phenols, cross the placenta (Balakrishnan et al., 2010; Schönfelder et al., 2002). Further, given their abilities to disrupt key hormones involved in ossification (i.e., bone formation) and remodeling/mineralization, such as estrogen and thyroid stimulating hormone (Aker et al., 2019; Delitala et al., 2020; Versonnen et al., 2003; Völkel et al., 2002), fetal exposure to environmental phenols may impact skeletal health in later life. Despite this, we are aware of only one epidemiologic study focused on gestational exposures to environmental phenols and bone health in children (van Zwol-Janssens et al., 2020). Among 1,362 offspring enrolled in the Generation R cohort, no associations were observed between maternal urinary bisphenol A (BPA) concentrations in the first, second, or third trimester and children’s whole body aBMD at age 6 or 10 years (van Zwol-Janssens et al., 2020). However, no population-based studies of children have assessed relations of other phenolic compounds such as benzophenone-3, triclosan, and 2,5-dichlorophenol with bone health in children, nor has any study examined phenol mixtures, and no studies have evaluated other skeletal sites.
Our goal was to examine associations of maternal urinary concentrations of four phenolic compounds (benzophenone-3, BPA, 2,5-dichlorophenol, triclosan) during pregnancy with bone mineral content (BMC) and aBMD at six skeletal sites among adolescents in the Health Outcomes and Measures of the Environment (HOME) Study. We also evaluated effect measure modification by child’s sex and estimated effects of the environmental phenol mixture on bone health outcomes.
Material and methods
Study population
We used data from the HOME Study, a prospective pregnancy and birth cohort study conducted in greater Cincinnati, Ohio from March 2003–January 2006. Detailed information regarding this cohort has been described previously (Braun et al., 2020; Braun et al., 2017). Pregnant women were eligible if they were aged 18 years or older; HIV negative; not receiving seizure, thyroid or chemotherapy/radiation medications; and living in a home built prior to 1978. Of the 1263 eligible participants, 468 were initially enrolled and 398 delivered live-born singleton infants (389 remained enrolled until delivery, 9 dropped out prior to delivery but re-enrolled at a later visit). In this study, we include 223 singleton children with at least one maternal urinary environmental phenol measure during pregnancy and bone outcome measurements at age 12 years.
The institutional review boards (IRBs) of Cincinnati Children’s Hospital Medical Center (CCHMC), and the participating hospitals, reviewed the study. The Centers for Disease Control and Prevention (CDC) deferred to CCHMC IRB as the IRB of record. Participants provided written informed consent. At the 12-year follow-up visit, children also provided informed assent.
Urinary biomarker quantification
Urine samples were collected in polyethylene containers and stored at −20 °C before shipping them overnight on dry ice to the CDC Division of Laboratory Sciences. We quantified concentrations of benzophenone-3, BPA, 2,5-dichlorophenol, and triclosan (hereafter referred to collectively as “environmental phenols”) in maternal urine samples collected at 16 weeks gestation (range: 11.3–21.4) and 26 weeks gestation (range: 21.6–34.6) using high-performance liquid chromatography–isotope-dilution tandem mass spectrometry (Ye et al., 2005a). We quantified at least one environmental phenol biomarker for 222 women at the 16-week visit and 207 women at the 26-week visit. One urine sample collected at the 16-week visit did not have a quantifiable creatinine concentration and was excluded from further analyses. Creatinine was measured by an enzyme reaction using a Roche Hitachi 912 chemistry analyzer (Roche Hitachi, Basel, Switzerland). Additional methodological details regarding the quantification of environmental phenols have been published previously (Ye et al., 2005a, b).
Outcome assessment
During the 12-year follow-up visit, trained research staff measured children’s standing height to the nearest 0.1 cm, in triplicate, with an Ayrton Stadiometer Model S100 (Prior Lake, MN). Technicians performed dual energy x-ray absorptiometry (DXA) scans of the whole-body, lumbar spine, hip, and radius with a Hologic Horizon densitometer (Marlborough, MA). We assessed the long-term calibration stability of our DXA scanner by daily scanning of the Hologic anthropomorphic spine phantom. Scans were analyzed using Apex 5.5 software to estimate BMC (g) and areal BMD (aBMD; g/cm2) = BMC (g) / projected area (cm2) for the whole body (less head), total hip, femoral neck, 1/3rd distal radius, ultra-distal radius, and lumbar spine. We excluded the head from whole body measures since the proportion of BMC contained in the skull varies relative to a child’s body size in an inconsistent manner (Taylor et al., 1997). Whereas BMC is a measure of bone mass, BMD is a measure of bone density, and is less affected by bone size (Zemel et al., 2010). We also calculated spine bone mineral apparent density (BMAD = BMC/bone area1.5) as an estimated measure of spine volumetric BMD (g/cm3) not affected by height (Kindler et al., 2019). For all skeletal sites, we calculated Z-scores using reference ranges from the Bone Mineral Density in Childhood Study (Kindler et al., 2020a; Kindler et al., 2019; Zemel et al., 2011). We calculated height-for-age adjusted age-, sex-, and race-specific whole body (excluding head), total hip, femoral neck, and 1/3rd distal radius BMC and aBMD Z-scores as well as lumbar spine BMC Z-scores. Because DXA provides 2-dimensional scans of bone, it does not account for bone depth, and therefore resulting BMC and BMD Z-scores may be confounded due to short or tall stature. We used height-for-age Z-scores to account for this artifact (Zemel et al., 2010). We also calculated age-, sex-, and race-specific ultra-distal radius aBMD and spine BMAD Z-scores, which were not height-for-age adjusted as these outcomes are weakly correlated with height-for-age (Kindler et al., 2020b; Kindler et al., 2019).
Covariates
We identified and selected covariates for our adjusted regression models based on a directed acyclic graph (DAG) (Supplemental Material Figure S1). Maternal characteristics included race and ethnicity, mid-pregnancy body mass index (BMI), height, household income level, age at delivery, prenatal vitamin use, average maternal blood lead concentrations during pregnancy, average serum cotinine concentrations during pregnancy, and self-reported frequency of fruit and vegetable consumption during pregnancy (≥ 4 days per week vs. < 4 days per week). We also adjusted for child’s age in months at follow-up and sex assigned at birth. We collected sociodemographic characteristics using standardized, computer-assisted interviews and medical chart reviews by trained research assistants. Lead was measured via inductively coupled plasma mass spectrometry (Jones et al., 2017) in whole blood samples collected at up to three time points (16 weeks gestation, 26 weeks gestation, and delivery) and stored at −80°C until shipment on dry ice to the CDC for analysis. We adjusted for lead exposure using the average of maternal blood lead concentrations as a measure of gestational lead exposure because the HOME Study was initially designed as a randomized trial of lead and injury hazard controls to reduce children’s blood lead levels (Braun et al., 2017).
Statistical methods
We singly-imputed biomarker concentrations below the limit of detection (LOD) using (Hornung and Reed, 1990). We calculated Spearman’s rank correlations between environmental phenol biomarkers using average biomarker concentrations during pregnancy, and also using concentrations from individual timepoints during pregnancy. After visually examining distributions, we log2-transformed concentration to reduce the influence of outliers and because of positive-skewness of their distributions. We applied covariate-adjusted creatinine standardization to adjust for the influence of urine dilution on environmental phenol concentrations (O’Brien et al., 2016) as described in detail previously (Kuiper et al., 2022). Briefly, we fitted a linear model of urinary creatinine values (at 16 weeks or 26 weeks) based on maternal age, maternal mid-pregnancy BMI, maternal height, maternal race/ethnicity, household income, hypertension status, and gestational diabetes status; then, we multiplied each biomarker concentration by the ratio of fitted to observed creatinine values, resulting in covariate-adjusted creatinine-standardized biomarker concentrations.
We assessed associations between creatinine-standardized urinary environmental phenol biomarker concentrations with bone outcome Z-scores by constructing linear regression models with and without covariates. Adjusted models included midpoint of reported household income range category (continuous), age at delivery (continuous), prenatal vitamin use (dichotomous: ever, never), average maternal lead concentration (continuous), self-reported frequency of fruit and vegetable consumption during pregnancy (dichotomous: ≥ 4 days per week, < 4 days per week), self-reported maternal race and/or ethnicity (dichotomous: non-Hispanic White; non-Hispanic Black or any other race or ethnicity), maternal mid-pregnancy BMI (continuous), maternal height (cm; continuous), child’s sex assigned at birth (dichotomous: male, female), and child age at follow-up (continuous). Our primary models used the average of available log2-transformed concentrations from 16- and 26-weeks gestation because repeated measures can reduce exposure measurement error for non-persistent chemicals (Calafat et al., 2015). For this averaged variable, we used a single concentration if only one time point was available (n = 16 with only 16-week and n = 1 with only 26-week concentrations). As an exploratory analysis, we evaluated potential periods of heightened susceptibility to exposure by estimating associations for each timepoint (16- or 26-weeks of gestation) in separate linear regression models. We used an alpha level of 0.05 for hypothesis testing and full information maximum likelihood to account for missing covariate information.
Environmental phenols, which are endocrine disrupting chemicals, might have sexually-dimorphic relations with bone mineral accrual and strength. Thus, we evaluated sex as an effect measure modifier by stratifying models by child’s sex and calculating p-values for the difference in sex-specific estimates via two-sample Z-tests (Buckley et al., 2017). For analyses of effect measure modification, we used an alpha level of 0.1 as indication of effect measure modification by child’s sex. While there is no standard alpha threshold for evaluation of effect measure modification, we chose a less conservative value since we were likely underpowered to detect underlying sex-differences in associations.
We used quantile-based g-computation to estimate the overall effect of the environmental phenol mixture and individual contributions of each biomarker in the mixture to the overall effect. This method categorizes the continuous biomarker concentrations into quantiles to estimate the overall effect of increasing all biomarkers by one quantile and defines weights for each biomarker as a measure of their contributions to the overall associations with bone outcomes (Keil et al., 2020). With this model, we estimated 1) differences (95% confidence interval, CI) in outcome Z-score per quartile increase in all environmental phenols (ψ), 2) differences in bone outcome Z-score per quartile increase in environmental phenols with estimated effects in either the positive direction or the negative direction (i.e., directional scaled effects), and 3) weights for the percent contribution of each environmental phenol to the overall mixture effect. We also assessed the potential for effect measure modification of the overall mixture effect by child’s sex via inclusion of a product term between ψ and child’s sex. For these mixture models, we restricted analysis to participants with all biomarkers quantified (n = 212), and we accounted for missing covariate data using a single stochastic imputation to address potential bias due to missing covariate data. We fit overall models using the R package qgcomp and obtained sex-specific estimates using qgcompint.
We conducted all single-biomarker analyses using Stata (version 15.1, College Station, TX: StataCorp LP) and all mixtures analyses using R (version 4.0.2, R Core Team 2020).
Results
Study Sample Characteristics
Most mothers were between 25 and 35 years of age (60%), more than half were non-Hispanic White (57%), and 59% had an annual household income more than $40,000 at baseline (Table 1). We observed no systematic differences in sociodemographics between the study sample (n = 223) and full sample of mothers with singleton pregnancies (n = 398) (Table 1). The average child age at follow-up was 12.4 (0.7) years (Table 2). Geometric mean maternal urinary concentrations were 23.0 ng/mL for benzophenone-3, 2.1 ng/mL for BPA, 8.0 ng/mL for 2,5-dichlorophenol, and 19 ng/mL for triclosan (Table 3). Spearman’s rank correlations between environmental phenols were low for most pairwise combinations, except for 2,5-dichlorophenol and BPA (ρ = 0.42) (Supplemental Material Figure S2). Correlations between concentrations of the same biomarker measured at 16- and 26-weeks of gestation ranged from 0.27 for BPA to 0.71 for 2,5-dichlorophenol (Supplemental Material Figure S3).
Table 1.
Baseline characteristics of HOME Study participants included in the study sample and full sample. All statistics are n (%) unless otherwise stated.
| Variables | Study sample, n = 223a |
Full sample, n = 398 |
|---|---|---|
| Maternal age | ||
| < 25 years | 59 (26) | 100 (25) |
| 25 – 35 years | 133 (60) | 236 (59) |
| > 35 years | 31 (14) | 62 (16) |
| Maternal mid-pregnancy BMI (kg/m2) | ||
| < 18.5 (underweight) | 3 (1) | 3 (1) |
| 18.5 to < 25 (normal weight) | 85 (41) | 153 (41) |
| 25 to < 30 (overweight) | 69 (33) | 125 (34) |
| ≥ 30 (obese) | 51 (25) | 88 (24) |
| Missing | 15 | 29 |
| Maternal height (cm) | ||
| < 152.4 (< 5 feet) | 7 (3) | 15 (4) |
| 152.4 to < 167.6 (≥ 5 feet < 5.5 feet) | 133 (64) | 230 (62) |
| 167.6 to < 182.9 (≥ 5.5 feet < 6 feet) | 64 (31) | 120 (33) |
| ≥ 182.9 (≥ 6 feet) | 4 (2) | 4 (1) |
| Missing | 15 | 29 |
| Maternal race/ethnicity | ||
| Non-Hispanic White | 127 (57) | 241 (61) |
| Non-Hispanic Black | 84 (38) | 129 (33) |
| Other | 12 (5) | 25 (6) |
| Missing | 0 | 3 |
| Household income | ||
| < $20,000 | 57 (26) | 88 (22) |
| $20,000 – < $40,000 | 35 (16) | 67 (17) |
| $40,000 – < $80,000 | 77 (35) | 140 (35) |
| ≥ $80,000 | 54 (24) | 103 (26) |
| Parity | ||
| Nulliparous | 90 (42) | 171 (44) |
| Primiparous | 72 (33) | 124 (32) |
| Multiparous | 54 (25) | 92 (24) |
| Missing | 7 | 11 |
| Prenatal vitamin use | ||
| Never used | 27 (13) | 46 (12) |
| Ever used | 188 (87) | 340 (88) |
| Missing | 8 | 12 |
| Fruit and vegetable consumption during pregnancy | ||
| < 4 days per week | 50 (23) | 81 (21) |
| ≥ 4 days per week | 165 (77) | 305 (79) |
| Missing | 8 | 12 |
| Maternal blood lead concentration during pregnancy (μg/dL)b | 3 | |
| < 0.50 | 39 (18) | 59 (15) |
| ≥ 0.50 – < 1.00 | 154 (69) | 283 (71) |
| ≥ 1.00 | 30 (13) | 56 (14) |
Abbreviations: BMI = body mass index; cm = centimeter; dL = deciliter; mL = milliliter; ng = nanogram; μg = microgram
Participants with at least one urinary environmental phenol biomarker quantified during gestation
Average of up to three timepoints: 16 weeks gestation, 26 weeks gestation, and delivery
Table 2.
Characteristics of HOME Study participants in the study sample at follow-up. Statistics are mean (SD) unless otherwise stated.
| Variable | Overall (n=223) |
Males (n=99) |
Females (n=124) |
|---|---|---|---|
| Age at visit (years) | 12.4 (0.70) | 12.4 (0.74) | 12.4 (0.67) |
| Pubertal stagea (n, %) | |||
| 1 | 23 (10) | 17 (17) | 6 (5) |
| 2 | 56 (25) | 31 (31) | 25 (20) |
| 3 | 65 (29) | 26 (26) | 39 (32) |
| 4 | 45 (20) | 16 (16) | 29 (24) |
| 5 | 33 (15) | 9 (9) | 24 (20) |
| Missing | 1 | 0 | 1 |
| BMC measures (g) | |||
| Whole body (excluding head) | 1228 (325) | 1174 (328) | 1272 (318) |
| Total hip | 25.2 (6.69) | 25.6 (7.62) | 24.8 (5.86) |
| Femoral neck | 3.69 (0.78) | 3.68 (0.77) | 3.70 (0.80) |
| 1/3rd Distal radius | 1.45 (0.28) | 1.42 (0.27) | 1.47 (0.28) |
| Spine | 38.9 (11.8) | 35.7 (11.1) | 41.5 (11.8) |
| BMC Z-scoreb | |||
| Whole body (excluding head) | −0.05 (0.82) | −0.16 (0.78) | 0.04 (0.85) |
| Total hip | −0.08 (0.92) | −0.12 (0.94) | −0.06 (0.90) |
| Femoral neck | 0.23 (0.97) | 0.13 (0.93) | 0.31 (0.99) |
| 1/3rd Distal radius | 0.10 (0.98) | −0.02 (0.93) | 0.19 (1.01) |
| Spine | 0.09 (0.86) | 0.06 (0.87) | 0.12 (0.85) |
| aBMD measures (g/cm2) | |||
| Whole body (excluding head) | 0.826 (0.094) | 0.809 (0.092) | 0.841 (0.093) |
| Total hip | 0.853 (0.137) | 0.838 (0.130) | 0.866 (0.142) |
| Femoral neck | 0.798 (0.136) | 0.782 (0.122) | 0.810 (0.145) |
| 1/3rd Distal radius | 0.603 (0.064) | 0.592 (0.062) | 0.612 (0.063) |
| Ultra-distal radius | 0.350 (0.056) | 0.347 (0.047) | 0.352 (0.063) |
| Spine (BMAD, g/cm3) | 0.228 (0.036) | 0.209 (0.026) | 0.244 (0.036) |
| aBMD Z-scoreb | |||
| Whole body (excluding head) | −0.38 (0.90) | −0.43 (0.89) | −0.34 (0.92) |
| Total hip | −0.02 (1.07) | −0.06 (1.10) | 0.02 (1.05) |
| Femoral neck | −0.02 (1.07) | −0.10 (1.10) | 0.05 (1.04) |
| 1/3rd Distal radius | 0.23 (0.96) | 0.22 (0.91) | 0.23 (1.00) |
| Ultra-distal radiusc | 0.28 (1.17) | 0.18 (1.00) | 0.36 (1.29) |
| Spine (BMAD)c | 0.33 (1.02) | 0.32 (1.02) | 0.34 (1.02) |
Abbreviations: cm = centimeter; g = grams; kg = kilograms; aBMD = areal bone mineral density; BMAD = bone mineral apparent density; BMC = bone mineral content
Tanner stage self-assessment
Height-for-age adjusted age-, sex-, and population ancestry-specific Z-scores
Age-, sex-, and population ancestry-specific Z-score
Table 3.
Covariate-adjusted, creatinine-standardizeda maternal gestational urinary environmental phenol concentrations (ng/mL), 2003–2006.
| Visit | Sample size | LOD | N (%) > LODb | GM (GSD) | 25th Percentile | 50th Percentile | 75th percentile | 95th percentile | |
|---|---|---|---|---|---|---|---|---|---|
| Benzophenone-3 | 16 Weeks | 190 | 0.4 | 188 (99) | 22.4 (6.3) | 5.63 | 16.9 | 72.5 | 703 |
| 26 Weeks | 197 | 0.4 | 196 (99) | 23.1 (6.1) | 5.90 | 15.7 | 76.4 | 646 | |
| Averagec | 215 | NA | NA | 23.0 (5.3) | 5.95 | 18.2 | 70.3 | 569 | |
| BPA | 16 Weeks | 221 | 0.4 | 203 (92) | 2.14 (2.7) | 1.06 | 1.91 | 3.79 | 15.5 |
| 26 Weeks | 207 | 0.4 | 189 (91) | 1.98 (2.7) | 1.01 | 1.68 | 3.08 | 9.13 | |
| Averagec | 223 | NA | NA | 2.10 (2.2) | 1.15 | 1.92 | 3.34 | 7.15 | |
| 2,5-Dichlorophenol | 16 Weeks | 217 | 0.2 | 216 (99) | 9.03 (4.5) | 3.12 | 6.41 | 22.0 | 193 |
| 26 Weeks | 177 | 0.2 | 176 (99) | 5.84 (4.7) | 2.01 | 4.16 | 14.0 | 135 | |
| Averagec | 219 | NA | NA | 7.99 (4.2) | 2.71 | 5.71 | 20.3 | 136 | |
| Triclosan | 16 Weeks | 218 | 2.3 | 206 (95) | 21.8 (4.8) | 6.26 | 17.7 | 57.6 | 459 |
| 26 Weeks | 204 | 2.3 | 178 (87) | 15.8 (4.7) | 5.10 | 12.5 | 38.3 | 447 | |
| Averagec | 222 | NA | NA | 18.7 (3.8) | 6.79 | 16.9 | 42.1 | 237 |
Abbreviations: BPA = bisphenol A; GM = geometric mean; GSD = geometric standard deviation; LOD = limit of detection; NA = not applicable; ng/mL = nanogram per milliliter
Raw analyte concentrations were multiplied by the ratio of fitted to observed creatinine concentration. Fitted creatinine was estimated from a linear regression model that included maternal age, maternal mid-pregnancy BMI, maternal height, maternal race/ethnicity, household income, hypertension status, and gestational diabetes status.
Concentrations < LOD replaced by LOD/√2.
Average of 16- and 26-week measures or a single measure if only one is available.
Multivariable Linear Regression
In unadjusted (Supplemental Material Table S1) and adjusted (Supplemental Material Table S3) analyses of the overall study sample, a doubling in average 2,5-dichlorophenol concentration was associated with greater BMC and aBMD Z-scores for most bone sites. Associations were greatest in magnitude for 2,5-dichlorophenol with aBMD (β = 0.09; 95% CI: 0.02, 0.17) and BMC (β = 0.09; 95% CI: 0.02, 0.17) at the 1/3rd distal radius (Figure 1; Supplemental Material Table S3). Associations with other environmental phenols were generally null, though associations for BPA and triclosan were often positively associated with BMC and aBMD Z-scores but with wide confidence intervals (Supplemental Material Table S3). In our exploratory analysis of periods of susceptibility, all associations were comparable for concentrations measured during 16- and 26-weeks of gestation (Supplemental Material Table S4).
Figure 1.
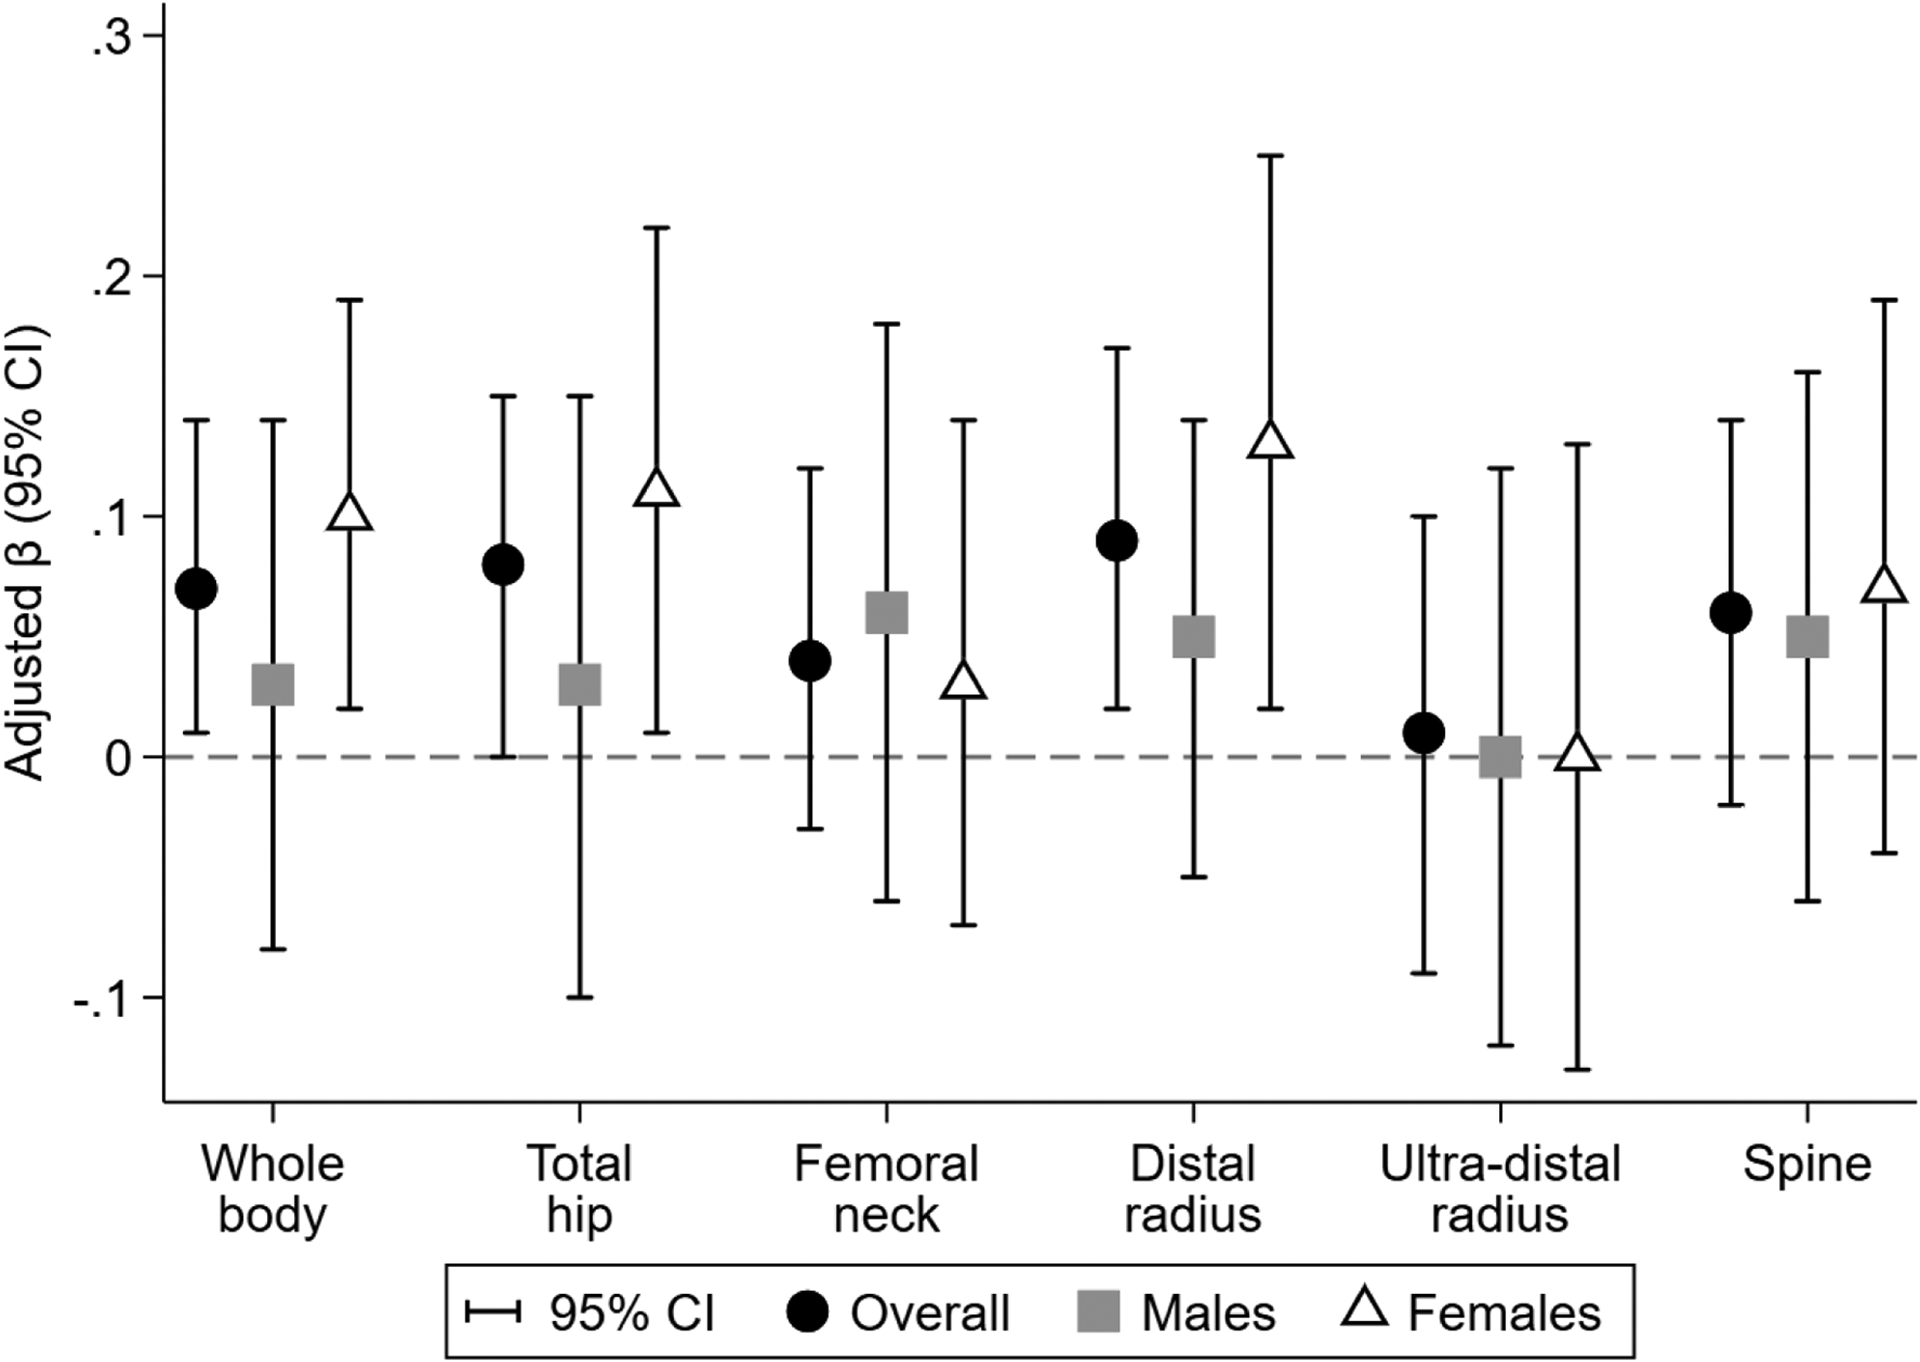
Adjusted associations of average covariate-adjusted, creatinine-standardizeda maternal gestational urinary 2,5-dichlorophenol concentration (ng/mL) with BMD Z-scores. Difference (95% confidence interval) in outcome Z-score per doubling in environmental phenol concentration estimated in separate linear regression models adjusted for maternal age at delivery, mid-gestation BMI, height, race/ethnicity, household income, prenatal vitamin use, average blood lead concentration during pregnancy, average serum cotinine concentration during pregnancy, fruit and vegetable consumption during pregnancy, and age at follow-up. Overall models additionally adjusted for child’s sex. All outcomes are aBMD Z-scores, except spine which is BMAD Z-score. aBMD, areal bone mineral density; BMAD, bone mineral apparent density. a Urinary dilution was accounted for using covariate-adjusted, creatinine-standardization. Raw analyte concentrations were multiplied by the ratio of fitted to observed creatinine concentration. Fitted creatinine was estimated from a linear regression model that included maternal age, maternal mid-pregnancy BMI, maternal height, maternal race/ethnicity, household income, hypertension status, and gestational diabetes status.
We found limited evidence of effect measure modification by child’s sex in unadjusted (Supplemental Material Tables S1 and S2) and adjusted (Supplemental Material Table S5) analyses. Only 2,5-dichlorophenol and triclosan showed evidence of differential associations between sexes, and only at the 1/3rd distal radius and total hip, respectively. A doubling of average 2,5-dichlorophenol concentration was associated with higher 1/3rd distal radius BMC Z-scores among females (β = 0.16; 95% CI: 0.06, 0.26), but not males (β = 0.02, 95% CI = −0.08, 0.13) (Supplemental Material Table S5). Conversely, a doubling in average triclosan concentration was associated with lower total hip aBMD (β = −0.05; 95% CI: −0.13, 0.03) and BMC (β = −0.06; 95% CI: −0.13, 0.02) Z-scores among females, whereas among males triclosan was associated with higher aBMD (β = 0.07; 95% CI: −0.02, 0.16) Z-scores (Supplemental Material Table S5).
Quantile g-computation
Similar to the single-biomarker models, we observed the strongest association of the environmental phenol mixture with aBMD and BMC at the 1/3rd distal radius. For the overall mixture effect (ψ), a quartile increase in the mixture was associated with a 0.16 (95% CI: −0.04, 0.37) greater aBMD and 0.23 (95% CI: 0.02, 0.44) greater BMC Z-score at the 1/3rd distal radius (Table 4). Associations of the environmental phenol mixture with aBMD and BMC were weaker and not statistically significant for other skeletal sites (Table 4). While associations with BMC and aBMD were generally comparable between males and females, the contributions of individual biomarkers to the overall mixture effect often differed by sex (Supplemental Material Table S6 and Table S7). For example, among males, the overall positive association for the mixture with 1/3rd distal radius aBMD was driven primarily by benzophenone-3 (positive weight = 56.2%); whereas among females, the overall positive mixture effect was driven by 2,5-dichlorophenol (positive weight = 100%) (Supplemental Material Table S6).
Table 4.
Adjusted associations of the maternal urinary environmental phenol mixture with bone outcome Z-scores at age 12 years estimated using quantile g-computation, overall and by child sex.
| Outcome | Overall (n = 212) |
Males (n = 93) |
Females (n = 119) |
|---|---|---|---|
| BMD Z-score | |||
| Whole-body aBMD | 0.11 (−0.06, 0.29) | 0.07 (−0.21, 0.35) | 0.14 (−0.08, 0.36) |
| Total hip aBMD | 0.07 (−0.13, 0.28) | 0.12 (−0.23, 0.47) | 0.05 (−0.20, 0.30) |
| Femoral neck aBMD | 0.05 (−0.15, 0.25) | 0.09 (−0.23, 0.40) | 0.04 (−0.20, 0.28) |
| 1/3rd Distal radius aBMD | 0.16 (−0.04, 0.37) | 0.21 (−0.11, 0.52) | 0.13 (−0.11, 0.37) |
| Ultra-distal radius aBMD | 0.03 (−0.22, 0.25) | 0.02 (−0.33, 0.37) | 0.06 (−0.23, 0.36) |
| Spine BMAD | −0.03 (−0.24, 0.18) | −0.13 (−0.42, 0.17) | 0.03 (−0.25, 0.31) |
| BMC Z-score | |||
| Whole-body | 0.08 (−0.08, 0.23) | 0.09 (−0.16, 0.34) | 0.07 (−0.12, 0.26) |
| Total hip | 0.06 (−0.12, 0.24) | 0.16 (−0.12, 0.44) | −0.01 (−0.23, 0.22) |
| Femoral neck | 0.12 (−0.07, 0.31) | 0.13 (−0.16, 0.42) | 0.11 (−0.13, 0.35) |
| 1/3rd Distal radius | 0.23 (0.02, 0.44) | 0.24 (−0.10, 0.58) | 0.22 (−0.04, 0.47) |
| Spine | 0.07 (−0.10, 0.24) | −0.08 (−0.36, 0.20) | 0.16 (−0.05, 0.38) |
Note: Difference (95% confidence interval) in outcome Z-score per quartile increase in all average covariate-adjusted, creatinine-standardizeda maternal gestational urinary environmental phenols estimated using quantile g-computation. Adjusted for maternal age at delivery, mid-gestation BMI, height, race/ethnicity, household income, prenatal vitamin use, average blood lead concentration during pregnancy, average serum cotinine concentration during pregnancy, fruit and vegetable consumption during pregnancy, and child’s age at follow-up. Overall models were additionally adjusted for child’s sex. Missing covariate information accounted for using single stochastic imputation by chained equations. BMC, bone mineral content; aBMD, areal bone mineral density; BMAD, bone mineral apparent density.
Raw analyte concentrations were multiplied by the ratio of fitted to observed creatinine concentration. Fitted creatinine was estimated from a linear regression model that included maternal age, maternal mid-pregnancy BMI, maternal height, maternal race/ethnicity, household income, hypertension status, and gestational diabetes status.
Discussion
In this prospective cohort, we observed mostly null associations of urinary environmental phenol concentrations during fetal development with BMC and aBMD Z-scores at six skeletal sites at age 12 years. However, we did find that higher concentrations of 2,5-dichlorophenol and the environmental phenol mixture were associated with higher BMC and aBMD Z-scores, particularly at the 1/3rd distal radius and among females. The mixture effect was primarily driven by benzophenone-3 among males and 2,5-dichlorophenol among females. Magnitudes of the mixture associations were as high as 0.24 standard deviation per quartile increase in all environmental phenols. To place this into context, vigorous physical activity (each additional hour per day) was associated with a 0.05 greater whole body (less head) BMC and total hip aBMD Z-score in the Bone Mineral Density in Childhood Study (Mitchell et al., 2016). Additionally, a standard deviation decrease in either BMC or aBMD has been associated with a 30–40% increase in odds of forearm fracture in children (Kalkwarf et al., 2011).
Compared with other studies of gestational environmental phenols exposures during the same general time-period, median uncorrected (i.e., not adjusted for urinary dilution) average pregnancy concentrations in our study were similar for BPA (1.90 ng/mL) and triclosan (15.1 ng/mL) (Berger et al., 2021; Buckley et al., 2018; van Zwol-Janssens et al., 2020; Wolff et al., 2008). The median concentration of 2,5-dichlorophenol (6.15 ng/mL) was comparable to those reported in a French cohort of mother-child dyads (EDEN cohort) (Philippat et al., 2014) but also lower than those reported in the Center for the Health Assessment of Mothers and Children of Salinas (CHAMACOS) study- (Berger et al., 2021) and the Children’s Environmental Health Study (Wolff et al., 2008). The median concentration of benzophenone-3 (22.4 ng/mL) was both lower (Wolff et al., 2008) and higher (Berger et al., 2021; Philippat et al., 2014) compared to these other studies.
To date, only one epidemiologic study assessed the associations between fetal exposure to environmental phenols and child bone health (van Zwol-Janssens et al., 2020). Among 1,362 participants of the Generation R Study, maternal urinary BPA concentrations in pregnant women were not associated with their children’s BMD or area-adjusted BMC at age 6 and 10 years, similar to null findings observed in our study. Importantly, van Zwol-Janssens et al. only examined exposure to bisphenols, and no previous studies have explored associations of maternal urinary 2,5-dichlorophenol, triclosan, and benzophenone-3 concentrations or their mixture with child bone health.
2,5-dichlorophenol has been used as an intermediate in dye production, pharmaceuticals, and agricultural products (Ye et al., 2005b) and is also a metabolite of paradichlorobenzene (also known as 1,4-dichlorobenzene), a disinfectant chemical used in products such as mothballs and deodorizing agents and with demonstrated clastogenic activity in vitro (Mohtashamipur et al., 1987). In our study, we observed a positive association between 2,5-dichlorophenol and 1/3rd distal radius bone mineral content and density among females, but not males, at age 12 years. We are not aware of any other studies evaluating associations with gestational urinary 2,5-dichlorophenol concentrations. This sex-difference might be due to sexually-dimorphic endocrine-disrupting actions of 2,5-dichlorophenol (Brouwer et al., 1999; Völkel et al., 2002), potentially by affecting pubertal timing and development (Bigambo et al., 2020). A previous systematic review and meta-analysis of four environmental phenols in 4,737 children from nine studies, showed that 2,5-dichlorophenol was the only chemical associated with the risk of early puberty (OR: 1.13; 95% CI: 1.06, 1.20) (Bigambo et al., 2020). Relatedly, three prior studies have found that greater urinary childhood 2,5-dichlorophenol concentrations were associated with earlier menarche among girls (Binder et al., 2018; Buttke Danielle et al., 2012; Wolff et al., 2017). Mechanisms of 2,5-dichlorophenol may also be independent of puberty; 2,5-dichlorophenol exhibits estrogenic activity in vitro (Versonnen et al., 2003), and estrogen regulates bone formation and inhibit bone resorption (Khosla et al., 2012). Moreover, short-term exposure to estrogen during fetal development is positively associated with peak bone mass in animal models (Migliaccio et al., 1996; Migliaccio et al., 2000).
Experimental studies have shown that gestational exposures to BPA may adversely affect bone development (Huang et al., 2021; Hwang et al., 2013; Kanno et al., 2004; Lejonklou et al., 2016; Lind et al., 2019; Pelch et al., 2012; Toda et al., 2002). However, our study and van Zwol Janssen et al. (2020) did not find evidence to support an association. Similarly, four prior epidemiologic studies have investigated associations of BPA exposure on BMD among adult populations, with mostly null findings (Gu et al., 2022; Kim et al., 2012; Wang et al., 2020; Zhao et al., 2012).
In a study investigating the effect of triclosan on sea urchin embryos, exposure to triclosan (1 μM) decreased the expression of several genes related to skeletal development, including bone morphogenic proteins, a group of growth factors that are critical to chondrogenesis and osteogenesis (Hwang et al., 2017). In our study, though associations were imprecise, we observed sex differences in associations of triclosan with total hip bone mineral content and density. Specifically, higher triclosan concentrations were associated with lower total hip aBMD and BMC Z-scores among females but lower Z-scores among males. We are not aware of other epidemiologic studies evaluating gestational exposures to triclosan with offspring skeletal development, though two cross-sectional studies of adults observed that greater triclosan exposure was associated with lower BMD in the total femur, intertrochanteric region of the femur, femoral neck, and lumbar spine as well as greater odds of osteoporosis, among females (Cai et al., 2019; Wang et al., 2020).
As with 2,5-dichlorophenol and triclosan, no studies have evaluated the impact of gestational exposure to benzophenone-3, an ultraviolet filter used in sunscreen and other products, on offspring bone outcomes. We are aware of only one experimental study of benzophenone-3 and bone relevant outcomes, an in vitro study that evaluated the effects of benzophenone-3 exposure (0.1 nM to 10μM) on rat calvarial osteoblast-like cells (Ziolkowska et al., 2006). This study found significantly reduced proliferative activity among cells treated with the highest dose of benzophenone-3; though, this was suspected to be from cytotoxicity independent from endocrine-disrupting mechanisms (Ziolkowska et al., 2006).
Since fractures in children and adolescents most frequently occur at the forearm (containing two long bones, the ulna and the radius), our findings suggests that fetal exposure to certain environmental phenols could affect fracture risk (Jones et al., 2002; Kalkwarf et al., 2011; Korup et al., 2022). Still, greater bone content and density does not necessarily equate to greater bone strength. Additionally, any deviations from normal-for-age bone development may be considered as potentially adverse for health.
Lack of consistent associations across skeletal sites in our study may reflect differences in microarchitecture, composition of bone (i.e., dense cortical vs. spongy trabecular bone), and distribution of mineral within the bone at these sites. As such, environmental chemical exposures may not necessarily be expected to exert effects equally on all skeletal sites. In our study, 2,5-dichlorophenol was almost universally associated with higher bone mineral content and density at all skeletal sites. This suggests that perhaps its parent compound, paradichlorobenzene, is able to affect both cortical and trabecular bone. However, DXA is not able to differentiate bone composition and would instead require the use of peripheral quantitative computed tomography. Taken together, we found little evidence that gestational exposure to environmental phenols affected skeletal development in offspring.
This study contributes to the few studies of environmental phenols and bone health in early adolescence. Our study has several strengths, including the measurement of BMC and BMD at multiple skeletal sites, adjustment for many potential confounders, and consideration of chemical mixtures. We quantified phenols concentrations in two spot urine samples (16 weeks and 26 weeks gestation). Environmental phenols have short biological half-lives (e.g., < 24 hours) (Völkel et al., 2002; Weatherly and Gosse, 2017) and reliance on only two urinary measurements during pregnancy may result in bias from exposure misclassification (Perrier et al., 2016). However, using the average of available concentrations during pregnancy may better approximate of usual exposure to these compounds (or their parent compounds) during gestation. Additionally, while our study focused on frequently detected environmental phenols (or their metabolites), other compounds may impact bone development. Future studies should consider a wider array of phenolic compounds, especially increasingly utilized replacements for legacy compounds, e.g., bisphenol F and bisphenol S (Lehmler et al., 2018; van Zwol-Janssens et al., 2020). Our relatively modest sample size of 223 mother-and-child pairs limited our statistical power, especially for sex-specific associations. Additionally, we conducted multiple hypothesis tests given the array of exposures and outcomes evaluated. As such, our findings could be due to chance, though we have focused on patterns of associations, broadly, as opposed to individual statistical tests. While there was loss to follow-up in our cohort, baseline characteristics of sample participants were similar to the full cohort. Lastly, childhood exposures and other postnatal factors may also be important for early adolescent bone health. Future studies should assess exposures occurring across childhood and possible modification by postnatal factors, e.g., physical activity, diet, and breastfeeding.
Conclusions
In this prospective study, gestational environmental phenol exposures were not consistently associated with measures of early adolescent bone health. 1,4-paradichlorobenzene (the precursor of 2,5-dichlorophenol) and the environmental phenol mixture were associated with greater distal radius bone mineral content and density at age 12 years, especially among females. Yet, further studies on exposures and bone outcomes, particularly those utilizing methods capable of differentiating cortical and trabecular bone, are needed to confirm these findings and further determine effects of 1,4-paradichlorobenzene on cortical and trabecular bone strength and microarchitecture.
Supplementary Material
Highlights.
Gestational urinary 2,5-dichlorophenol concentrations were positively associated with distal radius bone mineral density at age 12 years, especially among females.
Gestational urinary benzophenone-3, bisphenol A, and triclosan were not significantly associated with bone mineral measurements.
The environmental phenol mixture was positively associated with distal radius bone mineral content in quantile g-computation models.
Acknowledgments
This work was supported by grants from the National Institutes of Health Center for Advancing Translational Sciences Clinical Translational Science Award program (UL1TR001425), National Institute of Environmental Health Sciences of the National Institutes of Health (R01ES033252, R01ES030078, R01ES025214, R01ES020349, R01 ES024381, R01ES027224, R01ES028277, P01ES011261) and U.S. Environmental Protection Agency (P01R829389). The content is solely the responsibility of the authors and does not necessarily represent the official views of the NIH. We are grateful to the participants for the time they have given to the HOME Study.
Declaration of competing financial interests
Dr. Braun and his institution were financially compensated for his services as an expert witness for plaintiffs in litigation related to PFAS-contaminated drinking water. Dr. Lanphear served as an expert witness in cases related to childhood lead poisoning, but he was not personally compensated. The other authors declare they have no actual or potential competing financial interests.
Abbreviations
- BPA
bisphenol A
- BMD
Bone mineral density
- BMI
Bone Mass Index
- CDC
The Centers for Disease Control and Prevention
- DAG
Directed acyclic graph
- DXA
Dual-energy X-ray absorptiometry
- GM
Geometric Mean
- HOME
Health Outcomes and Measures of the Environment
- NHANES
National Health and Nutrition Examination Survey
Footnotes
Publisher's Disclaimer: This is a PDF file of an unedited manuscript that has been accepted for publication. As a service to our customers we are providing this early version of the manuscript. The manuscript will undergo copyediting, typesetting, and review of the resulting proof before it is published in its final form. Please note that during the production process errors may be discovered which could affect the content, and all legal disclaimers that apply to the journal pertain.
Disclaimer: The findings and conclusions in this report are those of the authors and do not necessarily represent the official position of the Centers for Disease Control and Prevention. Use of trade names is for identification only and does not imply endorsement by the CDC, the Public Health Service, or the US Department of Health and Human Services.
Data sharing
Data from the HOME Study is available upon request. The HOME Study principal investigators have actively engaged in collaborative data-sharing projects. We welcome new collaborations with other investigators. Investigators interested in HOME Study data can explore options at the following location: https://homestudy.research.cchmc.org/ and use the available link to contact the investigators to discuss collaborative opportunities. The Data Sharing Committee meets regularly to review proposed research projects and ensure they do not overlap with extant projects and are an efficient use of scarce resources (e.g., biological samples). Funds to support staff efforts in the assembly of data sets are required.
References
- Agas D, Lacava G, Sabbieti MG, 2018. Bone and bone marrow disruption by endocrine-active substances. J Cell Physiol 234, 192–213. [DOI] [PubMed] [Google Scholar]
- Agas D, Sabbieti MG, Marchetti L, 2013. Endocrine disruptors and bone metabolism. Arch Toxicol 87, 735–751. [DOI] [PubMed] [Google Scholar]
- Aker AM, Ferguson KK, Rosario ZY, Mukherjee B, Alshawabkeh AN, Calafat AM, Cordero JF, Meeker JD, 2019. A repeated measures study of phenol, paraben and Triclocarban urinary biomarkers and circulating maternal hormones during gestation in the Puerto Rico PROTECT cohort. Environmental Health 18, 28. [DOI] [PMC free article] [PubMed] [Google Scholar]
- Bailey DA, McKay HA, Mirwald RL, Crocker PR, Faulkner RA, 1999. A six-year longitudinal study of the relationship of physical activity to bone mineral accrual in growing children: the university of Saskatchewan bone mineral accrual study. J Bone Miner Res 14, 1672–1679. [DOI] [PubMed] [Google Scholar]
- Balakrishnan B, Henare K, Thorstensen EB, Ponnampalam AP, Mitchell MD, 2010. Transfer of bisphenol A across the human placenta. Am J Obstet Gynecol 202, 393.e391–397. [DOI] [PubMed] [Google Scholar]
- Baxter-Jones AD, Faulkner RA, Forwood MR, Mirwald RL, Bailey DA, 2011. Bone mineral accrual from 8 to 30 years of age: an estimation of peak bone mass. J Bone Miner Res 26, 1729–1739. [DOI] [PubMed] [Google Scholar]
- Berger K, Hyland C, Ames JL, Mora AM, Huen K, Eskenazi B, Holland N, Harley KG, 2021. Prenatal Exposure to Mixtures of Phthalates, Parabens, and Other Phenols and Obesity in Five-Year-Olds in the CHAMACOS Cohort. International Journal of Environmental Research and Public Health 18, 1796. [DOI] [PMC free article] [PubMed] [Google Scholar]
- Bigambo FM, Sun H, Yan W, Wu D, Xia Y, Wang X, Wang X, 2020. Association between phenols exposure and earlier puberty in children: A systematic review and meta-analysis. Environ Res 190, 110056. [DOI] [PubMed] [Google Scholar]
- Binder AM, Corvalan C, Calafat AM, Ye X, Mericq V, Pereira A, Michels KB, 2018. Childhood and adolescent phenol and phthalate exposure and the age of menarche in Latina girls. Environmental Health 17, 32. [DOI] [PMC free article] [PubMed] [Google Scholar]
- Bonjour JP, Theintz G, Law F, Slosman D, Rizzoli R, 1994. Peak bone mass. Osteoporos Int 4 Suppl 1, 7–13. [DOI] [PubMed] [Google Scholar]
- Braun JM, Buckley JP, Cecil KM, Chen A, Kalkwarf HJ, Lanphear BP, Xu Y, Woeste A, Yolton K, 2020. Adolescent follow-up in the Health Outcomes and Measures of the Environment (HOME) Study: cohort profile. BMJ Open 10, e034838. [DOI] [PMC free article] [PubMed] [Google Scholar]
- Braun JM, Kalloo G, Chen A, Dietrich KN, Liddy-Hicks S, Morgan S, Xu Y, Yolton K, Lanphear BP, 2017. Cohort Profile: The Health Outcomes and Measures of the Environment (HOME) study. Int J Epidemiol 46, 24. [DOI] [PMC free article] [PubMed] [Google Scholar]
- Brouwer A, Longnecker MP, Birnbaum LS, Cogliano J, Kostyniak P, Moore J, Schantz S, Winneke G, 1999. Characterization of potential endocrine-related health effects at low-dose levels of exposure to PCBs. Environ Health Perspect 107 Suppl 4, 639–649. [DOI] [PMC free article] [PubMed] [Google Scholar]
- Buckley JP, Doherty BT, Keil AP, Engel SM, 2017. Statistical Approaches for Estimating Sex-Specific Effects in Endocrine Disruptors Research. Environ Health Perspect 125, 067013. [DOI] [PMC free article] [PubMed] [Google Scholar]
- Buckley JP, Quirós-Alcalá L, Teitelbaum SL, Calafat AM, Wolff MS, Engel SM, 2018. Associations of prenatal environmental phenol and phthalate biomarkers with respiratory and allergic diseases among children aged 6 and 7 years. Environ Int 115, 79–88. [DOI] [PMC free article] [PubMed] [Google Scholar]
- Buttke Danielle E, Sircar K, Martin C, 2012. Exposures to Endocrine-Disrupting Chemicals and Age of Menarche in Adolescent Girls in NHANES (2003–2008). Environmental Health Perspectives 120, 1613–1618. [DOI] [PMC free article] [PubMed] [Google Scholar]
- Cai S, Zhu J, Sun L, Fan C, Zhong Y, Shen Q, Li Y, 2019. Association Between Urinary Triclosan With Bone Mass Density and Osteoporosis in US Adult Women, 2005‒2010. J Clin Endocrinol Metab 104, 4531–4538. [DOI] [PubMed] [Google Scholar]
- Calafat AM, Longnecker MP, Koch HM, Swan SH, Hauser R, Goldman LR, Lanphear BP, Rudel RA, Engel SM, Teitelbaum SL, Whyatt RM, Wolff MS, 2015. Optimal Exposure Biomarkers for Nonpersistent Chemicals in Environmental Epidemiology. Environ Health Perspect 123, A166–168. [DOI] [PMC free article] [PubMed] [Google Scholar]
- Chin KY, Pang KL, Mark-Lee WF, 2018. A Review on the Effects of Bisphenol A and Its Derivatives on Skeletal Health. Int J Med Sci 15, 1043–1050. [DOI] [PMC free article] [PubMed] [Google Scholar]
- Delitala AP, Scuteri A, Doria C, 2020. Thyroid Hormone Diseases and Osteoporosis. J Clin Med 9. [DOI] [PMC free article] [PubMed] [Google Scholar]
- Diamanti-Kandarakis E, Bourguignon JP, Giudice LC, Hauser R, Prins GS, Soto AM, Zoeller RT, Gore AC, 2009. Endocrine-disrupting chemicals: an Endocrine Society scientific statement. Endocr Rev 30, 293–342. [DOI] [PMC free article] [PubMed] [Google Scholar]
- Gilsanz V, Chalfant J, Kalkwarf H, Zemel B, Lappe J, Oberfield S, Shepherd J, Wren T, Winer K, 2011. Age at onset of puberty predicts bone mass in young adulthood. The Journal of pediatrics 158, 100–105. e102. [DOI] [PMC free article] [PubMed] [Google Scholar]
- Golub MS, Collman GW, Foster PM, Kimmel CA, Rajpert-De Meyts E, Reiter EO, Sharpe RM, Skakkebaek NE, Toppari J, 2008. Public health implications of altered puberty timing. Pediatrics 121 Suppl 3, S218–230. [DOI] [PubMed] [Google Scholar]
- Gu L, Wang Z, Pan Y, Wang H, Sun L, Liu L, Zhong WJ, Zhang WB, 2022. Associations between mixed urinary phenols and parabens metabolites and bone mineral density: Four statistical models. Chemosphere, 137065. [DOI] [PubMed] [Google Scholar]
- Hornung RW, Reed LD, 1990. Estimation of Average Concentration in the Presence of Nondetectable Values. Applied Occupational and Environmental Hygiene 5, 46–51. [Google Scholar]
- Huang W, Wang X, Zheng S, Wu R, Liu C, Wu K, 2021. Effect of bisphenol A on craniofacial cartilage development in zebrafish (Danio rerio) embryos: A morphological study. Ecotoxicol Environ Saf 212, 111991. [DOI] [PubMed] [Google Scholar]
- Hwang J, Suh SS, Park M, Park SY, Lee S, Lee TK, 2017. Differential gene expression patterns during embryonic development of sea urchin exposed to triclosan. Environ Toxicol 32, 426–433. [DOI] [PubMed] [Google Scholar]
- Hwang JK, Min KH, Choi KH, Hwang YC, Jeong IK, Ahn KJ, Chung HY, Chang JS, 2013. Bisphenol A reduces differentiation and stimulates apoptosis of osteoclasts and osteoblasts. Life Sci 93, 367–372. [DOI] [PubMed] [Google Scholar]
- Jeon HK, Sarma SN, Kim YJ, Ryu JC, 2008. Toxicokinetics and metabolisms of benzophenone-type UV filters in rats. Toxicology 248, 89–95. [DOI] [PubMed] [Google Scholar]
- Jones DR, Jarrett JM, Tevis DS, Franklin M, Mullinix NJ, Wallon KL, Derrick Quarles C Jr., Caldwell KL, Jones RL, 2017. Analysis of whole human blood for Pb, Cd, Hg, Se, and Mn by ICP-DRC-MS for biomonitoring and acute exposures. Talanta 162, 114–122. [DOI] [PMC free article] [PubMed] [Google Scholar]
- Jones IE, Williams SM, Dow N, Goulding A, 2002. How many children remain fracture-free during growth? a longitudinal study of children and adolescents participating in the Dunedin Multidisciplinary Health and Development Study. Osteoporos Int 13, 990–995. [DOI] [PubMed] [Google Scholar]
- Kalkwarf HJ, Laor T, Bean JA, 2011. Fracture risk in children with a forearm injury is associated with volumetric bone density and cortical area (by peripheral QCT) and areal bone density (by DXA). Osteoporos Int 22, 607–616. [DOI] [PMC free article] [PubMed] [Google Scholar]
- Kanno S, Hirano S, Kayama F, 2004. Effects of phytoestrogens and environmental estrogens on osteoblastic differentiation in MC3T3-E1 cells. Toxicology 196, 137–145. [DOI] [PubMed] [Google Scholar]
- Keil AP, Buckley JP, O’Brien KM, Ferguson KK, Zhao S, White AJ, 2020. A Quantile-Based g-Computation Approach to Addressing the Effects of Exposure Mixtures. Environ Health Perspect 128, 47004. [DOI] [PMC free article] [PubMed] [Google Scholar]
- Khosla S, Oursler MJ, Monroe DG, 2012. Estrogen and the skeleton. Trends Endocrinol Metab 23, 576–581. [DOI] [PMC free article] [PubMed] [Google Scholar]
- Kim DH, Oh CH, Hwang YC, Jeong IK, Ahn KJ, Chung HY, Chang JS, 2012. Serum bisphenol a concentration in postmenopausal women with osteoporosis. J Bone Metab 19, 87–93. [DOI] [PMC free article] [PubMed] [Google Scholar]
- Kindler JM, Kalkwarf HJ, Lappe JM, Gilsanz V, Oberfield S, Shepherd JA, Kelly A, Winer KK, Zemel BS, 2020a. Pediatric Reference Ranges for Ultradistal Radius Bone Density: Results from the Bone Mineral Density in Childhood Study. J Clin Endocrinol Metab 105. [DOI] [PMC free article] [PubMed] [Google Scholar]
- Kindler JM, Kalkwarf HJ, Lappe JM, Gilsanz V, Oberfield S, Shepherd JA, Kelly A, Winer KK, Zemel BS, 2020b. Pediatric Reference Ranges for Ultradistal Radius Bone Density: Results from the Bone Mineral Density in Childhood Study. J Clin Endocrinol Metab 105, e3529–3539. [DOI] [PMC free article] [PubMed] [Google Scholar]
- Kindler JM, Lappe JM, Gilsanz V, Oberfield S, Shepherd JA, Kelly A, Winer KK, Kalkwarf HJ, Zemel BS, 2019. Lumbar Spine Bone Mineral Apparent Density in Children: Results From the Bone Mineral Density in Childhood Study. J Clin Endocrinol Metab 104, 1283–1292. [DOI] [PMC free article] [PubMed] [Google Scholar]
- Korup LR, Larsen P, Nanthan KR, Arildsen M, Warming N, Sørensen S, Rahbek O, Elsoe R, 2022. Children’s distal forearm fractures: a population-based epidemiology study of 4,316 fractures. Bone Jt Open 3, 448–454. [DOI] [PMC free article] [PubMed] [Google Scholar]
- Kuiper JR, Braun JM, Calafat AM, Lanphear BP, Cecil KM, Chen A, Xu Y, Yolton K, Kalkwarf HJ, Buckley JP, 2022. Associations of pregnancy phthalate concentrations and their mixture with early adolescent bone mineral content and density: The Health Outcomes and Measures of the Environment (HOME) study. Bone 154, 116251. [DOI] [PMC free article] [PubMed] [Google Scholar]
- Lehmler HJ, Liu B, Gadogbe M, Bao W, 2018. Exposure to Bisphenol A, Bisphenol F, and Bisphenol S in U.S. Adults and Children: The National Health and Nutrition Examination Survey 2013–2014. ACS Omega 3, 6523–6532. [DOI] [PMC free article] [PubMed] [Google Scholar]
- Lejonklou MH, Christiansen S, Örberg J, Shen L, Larsson S, Boberg J, Hass U, Lind PM, 2016. Low-dose developmental exposure to bisphenol A alters the femoral bone geometry in wistar rats. Chemosphere 164, 339–346. [DOI] [PubMed] [Google Scholar]
- Lind T, Lejonklou MH, Dunder L, Kushnir MM, Öhman-Mägi C, Larsson S, Melhus H, Lind PM, 2019. Developmental low-dose exposure to bisphenol A induces chronic inflammation, bone marrow fibrosis and reduces bone stiffness in female rat offspring only. Environ Res 177, 108584. [DOI] [PubMed] [Google Scholar]
- Migliaccio S, Newbold RR, Bullock BC, Jefferson WJ, Sutton FG Jr., McLachlan JA, Korach KS, 1996. Alterations of maternal estrogen levels during gestation affect the skeleton of female offspring. Endocrinology 137, 2118–2125. [DOI] [PubMed] [Google Scholar]
- Migliaccio S, Newbold RR, Teti A, Jefferson WJ, Toverud SU, Taranta A, Bullock BC, Suggs CA, Spera G, Korach KS, 2000. Transient estrogen exposure of female mice during early development permanently affects osteoclastogenesis in adulthood. Bone 27, 47–52. [DOI] [PubMed] [Google Scholar]
- Mitchell JA, Chesi A, Elci O, McCormack SE, Roy SM, Kalkwarf HJ, Lappe JM, Gilsanz V, Oberfield SE, Shepherd JA, 2016. Physical activity benefits the skeleton of children genetically predisposed to lower bone density in adulthood. Journal of Bone and Mineral Research 31, 1504–1512. [DOI] [PMC free article] [PubMed] [Google Scholar]
- Mohtashamipur E, Triebel R, Straeter H, Norpoth K, 1987. The bone marrow clastogenicity of eight halogenated benzenes in male NMRI mice. Mutagenesis 2, 111–113. [DOI] [PubMed] [Google Scholar]
- O’Brien KM, Upson K, Cook NR, Weinberg CR, 2016. Environmental Chemicals in Urine and Blood: Improving Methods for Creatinine and Lipid Adjustment. Environ Health Perspect 124, 220–227. [DOI] [PMC free article] [PubMed] [Google Scholar]
- Pelch KE, Carleton SM, Phillips CL, Nagel SC, 2012. Developmental exposure to xenoestrogens at low doses alters femur length and tensile strength in adult mice. Biol Reprod 86, 69. [DOI] [PMC free article] [PubMed] [Google Scholar]
- Perrier F, Giorgis-Allemand L, Slama R, Philippat C, 2016. Within-subject Pooling of Biological Samples to Reduce Exposure Misclassification in Biomarker-based Studies. Epidemiology 27, 378–388. [DOI] [PMC free article] [PubMed] [Google Scholar]
- Philippat C, Botton J, Calafat AM, Ye X, Charles MA, Slama R, 2014. Prenatal exposure to phenols and growth in boys. Epidemiology 25, 625–635. [DOI] [PMC free article] [PubMed] [Google Scholar]
- Schönfelder G, Wittfoht W, Hopp H, Talsness CE, Paul M, Chahoud I, 2002. Parent bisphenol A accumulation in the human maternal-fetal-placental unit. Environ Health Perspect 110, A703–707. [DOI] [PMC free article] [PubMed] [Google Scholar]
- Smith JT, Schneider AD, Katchko KM, Yun C, Hsu EL, 2017. Environmental Factors Impacting Bone-Relevant Chemokines. Front Endocrinol (Lausanne) 8, 22. [DOI] [PMC free article] [PubMed] [Google Scholar]
- Taylor A, Konrad PT, Norman ME, Harcke HT, 1997. Total body bone mineral density in young children: influence of head bone mineral density. J Bone Miner Res 12, 652–655. [DOI] [PubMed] [Google Scholar]
- Thent ZC, Froemming GRA, Muid S, 2018. Bisphenol A exposure disturbs the bone metabolism: An evolving interest towards an old culprit. Life Sci 198, 1–7. [DOI] [PubMed] [Google Scholar]
- Toda K, Miyaura C, Okada T, Shizuta Y, 2002. Dietary bisphenol A prevents ovarian degeneration and bone loss in female mice lacking the aromatase gene (Cyp19). Eur J Biochem 269, 2214–2222. [DOI] [PubMed] [Google Scholar]
- Turan S, 2021. Endocrine disrupting chemicals and bone. Best Pract Res Clin Endocrinol Metab 35, 101495. [DOI] [PubMed] [Google Scholar]
- van Zwol-Janssens C, Trasande L, Asimakopoulos AG, Martinez-Moral MP, Kannan K, Philips EM, Rivadeneira F, Jaddoe VWV, Santos S, 2020. Fetal exposure to bisphenols and phthalates and childhood bone mass: a population-based prospective cohort study. Environ Res 186, 109602. [DOI] [PMC free article] [PubMed] [Google Scholar]
- Versonnen BJ, Arijs K, Verslycke T, Lema W, Janssen CR, 2003. In vitro and in vivo estrogenicity and toxicity of o-, m-, and p-dichlorobenzene. Environmental Toxicology and Chemistry 22, 329–335. [PubMed] [Google Scholar]
- Vitku J, Kolatorova L, Franekova L, Blahos J, Simkova M, Duskova M, Skodova T, Starka L, 2018. Endocrine disruptors of the bisphenol and paraben families and bone metabolism. Physiol Res 67, S455–s464. [DOI] [PubMed] [Google Scholar]
- Völkel W, Colnot T, Csanády GA, Filser JG, Dekant W, 2002. Metabolism and kinetics of bisphenol a in humans at low doses following oral administration. Chem Res Toxicol 15, 1281–1287. [DOI] [PubMed] [Google Scholar]
- Wang N, Wang Y, Zhang H, Guo Y, Chen C, Zhang W, Wan H, Han J, Lu Y, 2020. Association of bone mineral density with nine urinary personal care and consumer product chemicals and metabolites: A national-representative, population-based study. Environ Int 142, 105865. [DOI] [PubMed] [Google Scholar]
- Weatherly LM, Gosse JA, 2017. Triclosan exposure, transformation, and human health effects. J Toxicol Environ Health B Crit Rev 20, 447–469. [DOI] [PMC free article] [PubMed] [Google Scholar]
- Weaver CM, Gordon CM, Janz KF, Kalkwarf HJ, Lappe JM, Lewis R, O’Karma M, Wallace TC, Zemel BS, 2016. The National Osteoporosis Foundation’s position statement on peak bone mass development and lifestyle factors: a systematic review and implementation recommendations. Osteoporos Int 27, 1281–1386. [DOI] [PMC free article] [PubMed] [Google Scholar]
- Wolff MS, Engel SM, Berkowitz GS, Ye X, Silva MJ, Zhu C, Wetmur J, Calafat AM, 2008. Prenatal phenol and phthalate exposures and birth outcomes. Environ Health Perspect 116, 1092–1097. [DOI] [PMC free article] [PubMed] [Google Scholar]
- Wolff MS, Pajak A, Pinney SM, Windham GC, Galvez M, Rybak M, Silva MJ, Ye X, Calafat AM, Kushi LH, Biro FM, Teitelbaum SL, 2017. Associations of urinary phthalate and phenol biomarkers with menarche in a multiethnic cohort of young girls. Reproductive Toxicology 67, 56–64. [DOI] [PMC free article] [PubMed] [Google Scholar]
- Wren TA, Kalkwarf HJ, Zemel BS, Lappe JM, Oberfield S, Shepherd JA, Winer KK, Gilsanz V, 2014. Longitudinal tracking of dual-energy X-ray absorptiometry bone measures over 6 years in children and adolescents: persistence of low bone mass to maturity. J Pediatr 164, 1280–1285.e1282. [DOI] [PMC free article] [PubMed] [Google Scholar]
- Wright NC, Looker AC, Saag KG, Curtis JR, Delzell ES, Randall S, Dawson-Hughes B, 2014. The recent prevalence of osteoporosis and low bone mass in the United States based on bone mineral density at the femoral neck or lumbar spine. J Bone Miner Res 29, 2520–2526. [DOI] [PMC free article] [PubMed] [Google Scholar]
- Yang YJ, Hong YC, Oh SY, Park MS, Kim H, Leem JH, Ha EH, 2009. Bisphenol A exposure is associated with oxidative stress and inflammation in postmenopausal women. Environ Res 109, 797–801. [DOI] [PubMed] [Google Scholar]
- Ye X, Kuklenyik Z, Needham LL, Calafat AM, 2005a. Automated on-line column-switching HPLC-MS/MS method with peak focusing for the determination of nine environmental phenols in urine. Anal Chem 77, 5407–5413. [DOI] [PubMed] [Google Scholar]
- Ye X, Kuklenyik Z, Needham LL, Calafat AM, 2005b. Quantification of urinary conjugates of bisphenol A, 2,5-dichlorophenol, and 2-hydroxy-4-methoxybenzophenone in humans by online solid phase extraction-high performance liquid chromatography-tandem mass spectrometry. Anal Bioanal Chem 383, 638–644. [DOI] [PubMed] [Google Scholar]
- Zemel BS, Kalkwarf HJ, Gilsanz V, Lappe JM, Oberfield S, Shepherd JA, Frederick MM, Huang X, Lu M, Mahboubi S, Hangartner T, Winer KK, 2011. Revised reference curves for bone mineral content and areal bone mineral density according to age and sex for black and non-black children: results of the bone mineral density in childhood study. J Clin Endocrinol Metab 96, 3160–3169. [DOI] [PMC free article] [PubMed] [Google Scholar]
- Zemel BS, Leonard MB, Kelly A, Lappe JM, Gilsanz V, Oberfield S, Mahboubi S, Shepherd JA, Hangartner TN, Frederick MM, Winer KK, Kalkwarf HJ, 2010. Height adjustment in assessing dual energy x-ray absorptiometry measurements of bone mass and density in children. J Clin Endocrinol Metab 95, 1265–1273. [DOI] [PMC free article] [PubMed] [Google Scholar]
- Zhao HY, Bi YF, Ma LY, Zhao L, Wang TG, Zhang LZ, Tao B, Sun LH, Zhao YJ, Wang WQ, Li XY, Xu MY, Chen JL, Ning G, Liu JM, 2012. The effects of bisphenol A (BPA) exposure on fat mass and serum leptin concentrations have no impact on bone mineral densities in non-obese premenopausal women. Clin Biochem 45, 1602–1606. [DOI] [PubMed] [Google Scholar]
- Ziolkowska A, Rucinski M, Pucher A, Tortorella C, Nussdorfer GG, Malendowicz LK, 2006. Expression of osteoblast marker genes in rat calvarial osteoblast-like cells, and effects of the endocrine disrupters diphenylolpropane, benzophenone-3, resveratrol and silymarin. Chem Biol Interact 164, 147–156. [DOI] [PubMed] [Google Scholar]
Associated Data
This section collects any data citations, data availability statements, or supplementary materials included in this article.
Supplementary Materials
Data Availability Statement
Data from the HOME Study is available upon request. The HOME Study principal investigators have actively engaged in collaborative data-sharing projects. We welcome new collaborations with other investigators. Investigators interested in HOME Study data can explore options at the following location: https://homestudy.research.cchmc.org/ and use the available link to contact the investigators to discuss collaborative opportunities. The Data Sharing Committee meets regularly to review proposed research projects and ensure they do not overlap with extant projects and are an efficient use of scarce resources (e.g., biological samples). Funds to support staff efforts in the assembly of data sets are required.