

Abstract
Background:
Ambient temperatures are projected to increase in the future due to climate change. Alzheimer’s disease (AD) and Alzheimer’s disease-related dementia (ADRD) affect millions of individuals and represent substantial health burdens in the US. High temperature may be a risk factor for AD/ADRD outcomes with several recent studies reporting associations between temperature and AD mortality. However, the link between heat and AD morbidity is poorly understood.
Methods:
We examined short-term associations between warm-season daily ambient temperature and AD/ADRD emergency department (ED) visits for individuals aged 45 years or above during the warm season (May to October) for up to 14 years (2005 – 2018) in five US states: California, Missouri, North Carolina, New Jersey, and New York. Daily ZIP code-level maximum, average and minimum temperature exposures were derived from 1km gridded Daymet products. Associations are assessed using a time-stratified case-crossover design using conditional logistic regression.
Results:
We found consistent positive short-term effects of ambient temperature among 3.4 million AD/ADRD ED visits across five states. An increase of the 3-day cumulative temperature exposure of daily average temperature from the 50th to the 95th percentile was associated with a pooled odds ratio of 1.042 (95% CI: 1.034, 1.051) for AD/ADRD ED visits. We observed evidence of the association being stronger for patients 65-74 years of age and for ED visits that led to hospital admissions. Temperature associations were also stronger among AD/ADRD ED visits compared to ED visits for other reasons, particularly among patients aged 65-74 years.
Conclusion:
People with AD/ADRD may represent a vulnerable population affected by short-term exposure to high temperature. Our results support the development of targeted strategies to reduce heat-related AD/ADRD morbidity in the context of global warming.
Keywords: Alzheimer’s disease, Alzheimer’s disease-related dementia, Emergency department visits, Heat, Temperature
1. INTRODUCTION
Climate change attributed to greenhouse gas emissions from human activities has contributed to multiple heat-related public health challenges [1–4]. As a consequence of climate change, ambient temperature is projected to increase in the future [5–7]. For the US, climate models have projected that the population exposed to high temperature will increases four- to six-fold by 2070 [8]. From previous epidemiologic studies, short-term exposure to high temperatures has been identified as a risk factor for various adverse health outcomes, including fluid and electrolyte imbalance, acute renal injury, circulatory disease, respiratory disease, heat stroke, septicemia, and gastrointestinal infections [9–13].
Dementia is a leading public health issue with a substantial financial and emotional burden, and nearly 50 million individuals are affected worldwide [14]. By 2050, this number is projected to triple to 152 million [15]. Dementia has many causes including Alzheimer’s disease (AD), cerebrovascular disease, Lewy body disease, frontotemporal lobar degeneration, Parkinson’s disease, hippocampal sclerosis, and of mixed pathologies [16]. Alzheimer’s disease (AD) contributes to the majority of dementia cases (60-80%) and is the sixth leading cause of death in the US; more than 6 million people in the US presently suffer from AD and this number is projected to reach approximately 12.7 million by 2050 in people aged 65 years and older [16, 17]. In addition to AD, frontotemporal, Lewy body, vascular, and mixed dementias are considered AD-related dementias (ADRD) which contribute to millions of dementia cases in the US [18, 19]. Various studies have showed that the prevalence of AD/ADRD differs by race in the US, with a higher prevalence observed for Blacks and Hispanics than for Whites [16, 18]. The substantial demands of medical care for people with AD/ADRD result in high economic burden for patients, caregivers, and society. In 2021, the medical expenditures directly associated with AD/ADRD was estimated to be $355 billion in the US among populations aged over 65 years [16]. With the growth of the elderly population, the direct cost is estimated to be $1 trillion by 2050 [20–22].
People with dementia suffer from reduced or lost cognitive function, which greatly influences their daily lives [22]. There is biological evidence indicating that thermoregulation is altered for people with dementia [23]. Several studies have reported that the core body temperature is increased in AD patients [24–26], which is hypothesized to be caused by the increased expression of cytokines in the brain and neuroinflammation [26]. Furthermore, due to their cognitive issues, some people with dementia have more difficulty interacting with their environmental conditions and communicating with their caregivers to reduce heat exposure [27]. These different hypothesized mechanisms related to patient physiology, behavior, and the social and built environments may potentially lead to heterogeneity in the effect of extreme temperature.
Recently, an increasing number of epidemiological studies have reported that exposure to heat waves or extreme temperature events increased mortality and morbidity associated with AD or dementia [28–32]. However, morbidity studies have predominantly focused on hospital admissions, have typically only examined AD, or have been restricted to the elderly population (≥65 years of age). Using hospital admissions as the measure of morbidity may only capture AD/ADRD cases resulting in severe health conditions, while missing a considerable portion of the disease burden and health care costs associated with emergency department (ED) visits that do not lead to hospitalization. Hence, there remains a need to more comprehensively examine associations between short-term exposure to high ambient temperature and dementia-related morbidity. This knowledge could play an important role in allocating healthcare resources and designing effective preventive strategies to reduce AD/ADRD morbidity due to heat.
In this work, we conducted time-stratified case-crossover analyses to estimate short-term health effects of high ambient temperature on both AD and ADRD ED visits in five US states during warm seasons: California, Missouri, North Carolina, New Jersey, and New York. We included both ED visits with AD/ADRD as a primary and secondary diagnosis, both ED outpatient visits and ED visits that resulted in inpatient admission, and included patients over a broad age range (≥45 years of age). To our best knowledge, this is the largest study to date on ambient temperature and AD/ADRD ED visits in the US.
2. METHODS
2.1. Emergency department visit and meteorological data
We obtained patient-level ED visit records from hospital associations or state health departments in five US states: California (2005 - 2016), Missouri (2005 - 2018), North Carolina (2011 - 2017), New Jersey (2005 - 2016), and New York (2005 - 2016). These five states were selected due to data availability and that they represent different climatic regions. The definition of an ED visit included patients seen in the ED and admitted to hospital, as well as patients discharged direct from the ED. Visit records included admission date, age in years, self-reported patient’s ZIP code of residence, and International Classification of Diseases (ICD) diagnosis codes. We applied the condition algorithm from the Centers for Medicare and Medicaid Services to identify AD/ADRD ED visits, using both primary and secondary diagnosis codes (Supplementary Table S1) [33]. Additional information about data sources are given in Acknowledgements.
To examine the association between high ambient temperature and AD/ADRD ED visits, the analysis was restricted to the warmest six months of the year, May to October. Daily maximum and minimum temperature in degrees Celsius, and water vapor pressure in pascals at 1 km × 1 km spatial resolution were acquired from Daymet [34]. Daymet model outputs 1 km gridded daily estimates of minimum temperature, maximum temperature, precipitation, shortwave radiation, vapor pressure, snow water equivalent, and day length using inputs from ground-based metrological stations over large regions including Canada, Mexico, the US, and Puerto Rico [34, 35]. Daily average temperature was calculated by taking the average of daily maximum and minimum temperature as a common practice. The daily 1km gridded Daymet data were then aggregated to the 2010 ZIP code tabulation areas (ZCTA) by spatial averaging. ED records with ZIP codes outside of the study states or that could not be assigned to a ZCTA were excluded (1.10%).
2.2. Statistical analyses
To estimate state-specific and overall short-term effects of various temperature metrics on AD/ADRD-related ED visits, we implemented a two-stage approach. In the first stage, state-specific associations were estimated using a conditional logistic regression model with a time-stratified case-crossover design, run separately for each state. In the case-crossover design, each AD/ADRD-related ED visit case was matched to multiple control days based on the patient’s residential ZCTA, visit year, month, and day of week. This case-only design automatically controls for individual-level time-invariant confounders. We assessed associations between AD/ADRD-related ED visits and daily minimum, average, and maximum temperatures at different lags (0-3) using distributed lag models. We examined these three temperature metrics because they are proxies of temperature exposures during different time period of a given day. For example, the daily minimum temperature could be a good proxy of nighttime exposure, and daily maximum temperature may reflect the exposure when people perform outdoors activities since it usually occurs in the afternoon. The daily average temperature is the average of the daily minimum and maximum temperatures. For our primary analysis, we reported cumulative 3-day effect obtained from the distributed lag model which permits effects of temperature at different lags to be different. This model was also selected because it was favored by the Akaike information criterion (AIC) [36]. In all models, the included temperature metric were modeled non-linearly using natural cubic splines with 4 degrees of freedom. All models included several time-varying confounders not accounted for in the case-crossover design. First, residual temporal trends were modeled using natural cubic splines on day of year (4 degrees of freedom) with interaction terms between spline coefficients and indicators of year. Temporal trends are needed to potentially control for within-month trends that are often present in ED visits, in contrast to mortality. Second, we controlled for dew-point (DP) temperature using natural cubic splines with 4 degrees of freedom. Because Daymet derived vapor pressure which is used for computing DP from night-time minimum temperature and precipitation variables, we did not control for DP when examining minimum temperature effects [37]. Finally, indicators representing days of federal holidays were included. To summarize the overall effects of temperature on AD/ADRD-related ED visits across states, in the second stage, state-specific spline coefficients of the exposure-response function were combined under a multivariate fixed-effect meta-analysis framework using weighted least squares.
Stratified analyses were conducted by patient age (45-64 years, 65-74 years, ≥75 years), restricting to AD/ADRD ascertained by primary diagnosis only, and by whether the ED visit resulted in hospitalization. These three age groups were chosen based on the cut points used to distinguish young-onset, early-onset, and late-onset dementia [38–40]. To explore whether the AD/ADRD patient population is more vulnerable to temperature compared to the general population utilizing the ED, we assessed and compared temperature associations among all ED visits that were not identified as AD/ADRD. Because of the large counts of non-AD/ADRD ED visits, a conditional Poisson model [41] was used following the same case-crossover design and confounder adjustment.
We implemented several sensitivity analyses to assess the robustness of our results, including exploring the association between ED visits and the 3-day moving average (same day and 2 preceding days) for all three temperature metrics, and examining cumulative 2-day effects of different temperature metrics using distributed lag models. Compared to the individual lag models containing 3-day moving average, the distributed lag models considering temperatures at lags 0-2 allow more flexible non-linearly associations between ED visits and temperature metrics at different lags. All data analyses were performed in R 4.0.2 [42]; the function clogit in R package survival were used to fit conditional logistic regression models, and the gnm function in R package gnm were used to fit conditional Poisson regression models.
3. RESULTS
3.1. Summary statistics
Table 1 presents the number of ED visits for AD/ADRD during the warm season (May - October) within each state by three age groups (45-64 years, 65-74 years, and ≥75 years). Additional stratifications are given in Supplementary Table S2. Overall, the study included 3,479,420 AD/ADRD ED visits. The majority of ED visits were among patients ≥75 years of age (83.24%), resulted in a hospital admission (63.04%), were coded as ADRD (74.63%), and were coded in the secondary diagnosis fields (94.50%). Descriptive statistics for daily minimum, average, and maximum temperature at lags 0, 1, and 2 are presented in Table 2. Differences in the means and variabilities of the temperature metrics across states reflect the different climatic regions that each state represents: West (California), upper Midwest (Missouri), Southeast (North Carolina) and North East (New Jersey and New York).
Table 1.
Total number of AD/ADRD ED visits stratified by age groups during May to October in five US states: California (2005 - 2016), Missouri (2005 - 2018), North Carolina (2011 - 2017), New Jersey (2005 - 2016), and New York (2005 - 2016).
| State | Age Group | AD | ADRD | AD/ADRD |
|---|---|---|---|---|
| California | Ages 45-64 | 8,257 | 48,068 | 56,325 |
| Ages 65-74 | 34,340 | 121,841 | 156,181 | |
| Ages 75+ | 298,334 | 862,546 | 1,160,880 | |
| Overall | 340,931 | 1,032,455 | 1,373,386 | |
| Missouri | Ages 45-64 | 2,657 | 13,652 | 16,309 |
| Ages 65-74 | 10,389 | 29,305 | 39,694 | |
| Ages 75+ | 69,738 | 158,267 | 228,005 | |
| Overall | 82,784 | 201,224 | 284,008 | |
| North Carolina | Ages 45-64 | 3,478 | 25,001 | 28,479 |
| Ages 65-74 | 15,211 | 62,123 | 77,334 | |
| Ages 75+ | 94,232 | 296,840 | 391,072 | |
| Overall | 112,921 | 383,964 | 496,885 | |
| New Jersey | Ages 45-64 | 3,844 | 15,014 | 18,858 |
| Ages 65-74 | 13,547 | 33,271 | 46,818 | |
| Ages 75+ | 115,562 | 243,502 | 359,064 | |
| Overall | 132,953 | 291,787 | 424,740 | |
| New York | Ages 45-64 | 6,514 | 32,056 | 38,570 |
| Ages 65-74 | 23,203 | 81,067 | 104,270 | |
| Ages 75+ | 183,366 | 574,195 | 757,561 | |
| Overall | 213,083 | 687,318 | 900,401 | |
| Total | Ages 45-64 | 24,750 | 133,791 | 158,541 |
| Ages 65-74 | 96,690 | 327,607 | 424,297 | |
| Ages 75+ | 761,232 | 2,135,350 | 2,896,582 | |
| Overall | 882,672 | 2,596,748 | 3,479,420 |
Table 2.
ZCTA-level mean, standard deviation (SD), interquartile range (IQR), median, and 95th percentile of daily minimum, average, and maximum temperature at lags 0, 1, and 2 in °C during the warm season (May-October).
| State | Temperature metrics | Mean (SD) | IQR | Median | 95th percentile | ||||||||
|---|---|---|---|---|---|---|---|---|---|---|---|---|---|
| Lag 0 | Lag 1 | Lag 2 | Lag 0 | Lag 1 | Lag 2 | Lag 0 | Lag 1 | Lag 2 | Lag 0 | Lag 1 | Lag 2 | ||
| California | Daily minimum | 13.60 (4.49) | 13.60 (4.49) | 13.60 (4.50) | 5.62 | 5.62 | 5.61 | 13.68 | 13.68 | 13.68 | 20.55 | 20.55 | 20.55 |
| Daily average | 20.64 (4.97) | 20.65 (4.98) | 20.65 (4.98) | 6.53 | 6.53 | 6.52 | 20.53 | 20.54 | 20.54 | 28.80 | 28.80 | 28.80 | |
| Daily maximum | 27.69 (6.24) | 27.70 (6.24) | 27.71 (6.24) | 8.96 | 8.96 | 8.96 | 27.49 | 27.50 | 27.51 | 37.92 | 37.92 | 37.92 | |
| Missouri | Daily minimum | 15.19 (5.83) | 15.22 (5.79) | 15.24 (5.75) | 8.12 | 8.08 | 8.08 | 16.42 | 16.42 | 16.43 | 22.75 | 22.75 | 22.75 |
| Daily average | 21.22 (5.60) | 21.25 (5.56) | 21.26 (5.53) | 7.33 | 7.30 | 7.28 | 22.25 | 22.26 | 22.26 | 28.71 | 28.71 | 28.71 | |
| Daily maximum | 27.24 (5.93) | 27.27 (5.87) | 27.29 (5.87) | 7.39 | 7.36 | 7.32 | 28.23 | 28.23 | 28.24 | 35.21 | 35.21 | 35.21 | |
| North Carolina | Daily minimum | 16.33 (5.22) | 16.37 (5.17) | 16.41 (5.12) | 7.20 | 7.15 | 7.11 | 17.37 | 17.38 | 17.39 | 22.91 | 22.91 | 22.91 |
| Daily average | 22.07 (4.74) | 22.10 (4.68) | 22.13 (4.63) | 6.59 | 6.55 | 6.52 | 22.98 | 22.98 | 22.99 | 28.29 | 28.29 | 28.29 | |
| Daily maximum | 27.80 (4.83) | 27.83 (4.79) | 27.86 (4.74) | 6.45 | 6.41 | 6.39 | 28.62 | 28.62 | 28.63 | 34.42 | 34.42 | 34.42 | |
| New Jersey | Daily minimum | 14.48 (5.44) | 14.49 (5.41) | 14.51 (5.39) | 7.95 | 7.95 | 7.95 | 15.21 | 15.21 | 15.21 | 22.12 | 22.12 | 22.12 |
| Daily average | 20.02 (5.24) | 20.03 (5.21) | 20.04 (5.19) | 7.58 | 7.58 | 7.57 | 20.89 | 20.89 | 20.89 | 27.36 | 27.36 | 27.36 | |
| Daily maximum | 25.56 (5.58) | 25.57 (5.56) | 25.58 (5.54) | 7.82 | 7.81 | 7.81 | 26.51 | 26.52 | 26.52 | 33.34 | 33.34 | 33.34 | |
| New York | Daily minimum | 11.84 (5.79) | 11.85 (5.77) | 11.85 (5.76) | 8.19 | 8.18 | 8.18 | 12.31 | 12.31 | 12.31 | 20.62 | 20.62 | 20.62 |
| Daily average | 17.49 (5.54) | 17.50 (5.52) | 17.51 (5.50) | 7.77 | 7.76 | 7.76 | 18.13 | 18.14 | 18.14 | 25.48 | 25.48 | 25.48 | |
| Daily maximum | 23.13 (5.93) | 23.15 (5.91) | 23.16 (5.89) | 8.11 | 8.08 | 8.07 | 24.02 | 24.03 | 24.03 | 31.38 | 31.38 | 31.38 | |
| Overall | Daily minimum | 13.69 (5.55) | 13.71 (5.53) | 13.72 (5.52) | 7.59 | 7.58 | 7.57 | 14.15 | 14.15 | 14.16 | 21.88 | 21.88 | 21.88 |
| Daily average | 19.84 (5.54) | 19.86 (5.52) | 19.87 (5.51) | 7.46 | 7.44 | 7.43 | 20.36 | 20.36 | 20.37 | 27.91 | 27.91 | 27.91 | |
| Daily maximum | 25.99 (6.24) | 26.00 (6.22) | 26.02 (6.20) | 8.18 | 8.16 | 8.15 | 26.55 | 26.56 | 26.56 | 35.34 | 35.34 | 35.34 | |
3.2. Temperature effects
Figure 1 shows the estimated odds ratios for AD/ADRD ED visits associated with change in 3-day temperature exposure (lags 0-2) from their 50th to the 95th percentiles (numeric values are given in Supplementary Table S3). This exposure contrast was selected to represent the state-specific extreme heat effects on AD/ADRD ED visits. For all temperature metrics, temperature was consistently positively associated with AD/ADRD ED visits across the five US states during the warm season. The positive associations were also present using a different exposure contrast reflecting effects of typical heat exposure (an increase from the 25th to the 75th percentile, Supplementary Figure S1). For the pooled results, and for all state-specific results except New Jersey, associations with average temperatures at lags 0-2 were stronger than those using maximum and minimum temperature. For example, the estimated pooled odds ratio associated with daily average temperature increasing from 20.4°C to 28.0°C (95th versus 50th percentile contrast) for lags 0, 1, and 2 was 1.042 (95% CI: 1.034 - 1.051).
Figure 1.

Short-term associations between AD/ADRD ED visits and change in 3-day temperature exposure from the 50th to the 95th percentiles during the warm season in 5 states: California (CA), Missouri (MO), North Carolina (NC), New Jersey (NJ) and New York (NY). Three temperature metrics were examined: daily minimum (MIN), daily average (AVG), daily maximum (MAX).
Figure 2 (Panel A) shows the state-specific exposure-response functions of daily average temperature at lags 0-2. Specifically, Figure 2A) presents the state-specific estimated odds ratios associated with one unit change in daily average temperature at lags 0-2 from their 50th percentiles. For the other two temperature metrics (daily maximum and minimum), the corresponding state-specific exposure-response functions are presented in supplementary materials (Supplementary Figure S2). The pooled exposure-response functions for the three temperature metrics are given in Figure 2 (Panel B). Overall, we found that daily temperature was associated with ED visits for AD/ADRD over the entire exposure distribution. As observed in Figure 1, daily average temperature showed the strongest pooled associations with ED visits compared to the other two temperature metrics.
Figure 2.
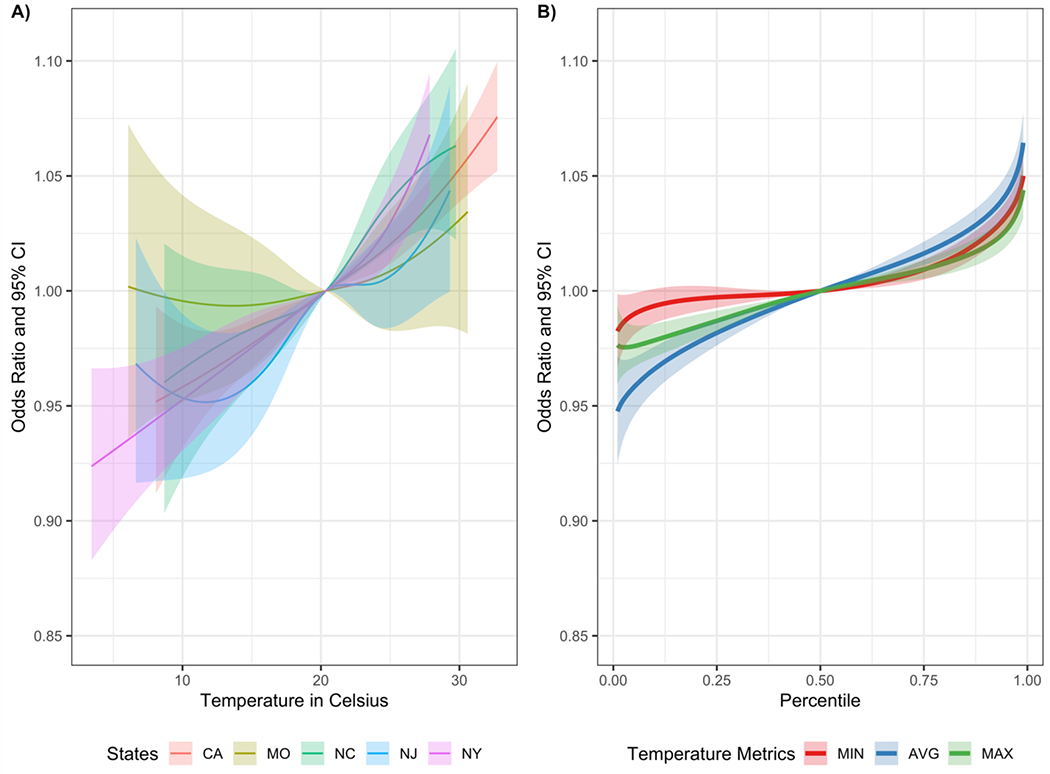
A) State-specific exposure-response functions and 95% pointwise confidence intervals (CI) for the associations between AD/ADRD ED visits and change in 3-day temperature exposure from their 50th percentiles of state-specific distributions of the daily average temperature; B) Pooled exposure-response functions and 95% pointwise CIs for the associations of 3-day temperature exposure for daily minimum, average, and maximum temperature. Reference level of exposure-response function is set to the 50th percentile of the distribution of temperature metrics across all states (MIN: 14.15 °C for lag 0, 14.15 °C for lag 1, and 14.16 °C for lag 2; AVG: 20.36 °C for lag 0, 20.36 °C for lag 1, and 20.37 °C for lag 2; MAX: 26.55 °C for lag 0, 26.56 °C for lag 1, 26.56 °C for lag 2).
3.3. Modifications of temperature effects
Results from stratified analysis by whether the ED visit led to a hospital admission and patient age are shown in Figure 3 and Supplementary Figure S3, respectively. Generally, we found evidence of stronger associations among AD/ADRD ED visits subsequently admitted to hospital for all three temperature metrics (Figure 3). In pooled analyses, we found stronger associations among younger patients (i.e., aged 45-64 and aged 65-74 years) compared to the oldest age group (i.e., ≥75). Notably, despite the smaller sample size compared to older age groups, in California and New York, we also identified positive associations between temperature and AD/ADRD ED visits among those ages 45 to 64 (Supplementary Figure S3). When restricting our analysis to associations between ED visits with AD/ADRD as primary diagnosis and temperature,we identified stronger positive associations compared with associations for AD/ADRD ED visits including both primary and secondary diagnosis (Supplementary Figure S4).
Figure 3.

Short-term associations between AD/ADRD ED visits stratified by decision on hospital admission and change in 3-day temperature exposure from the 50th to the 95th percentiles during the warm season in 5 states: California (CA), Missouri (MO), North Carolina (NC), New Jersey (NJ) and New York (NY). Three temperature metrics were examined: daily minimum (MIN), daily average (AVG), daily maximum (MAX).
3.4. Compare temperature effects on AD/ADRD vs. non-AD/ADRD ED visits
Finally, Figure 4 compares the pooled exposure-response functions for AD/ADRD and non-AD/ADRD ED visits among patient ages 65-74 years and ≥75 years. Across three exposure metrics, we found evidence of increased risks among AD/ADRD patient ages 65-74 years when the temperature metric increasing from their 50th percentiles, and the increased risks are more pronounced at the highest temperatures. The increased risks at the highest temperatures were also observed among AD/ADRD patient ages ≥75 years and all patients (≥45 years) for all three exposure metrics (Figure 4 Panel B and Supplementary Figure S6). In pooled analysis, these differences between risks of AD/ADRD and non-AD/ADRD ED visits at highest temperatures are also reflected in the odds ratio for the 50th to the 95th percentile exposure contrast (Supplementary Figures S5 and S7).
Figure 4.

Pooled exposure-response functions and 95% pointwise CIs for the associations of 3-day temperature exposure for daily minimum, average, and maximum temperature. Reference level of exposure-response function is set to the 50th percentile of the distribution of temperature metrics across all states among populations A) ages 65-74 years and B) aged ≥ 75 years (MIN: 14.15 °C for lag 0, 14.15 °C for lag 1, and 14.16 °C for lag 2; AVG: 20.36 °C for lag 0, 20.36 °C for lag 1, and 20.37 °C for lag 2; MAX: 26.55 °C for lag 0, 26.56 °C for lag 1, 26.56 °C for lag 2).
3.5. Sensitivity analysis
The positive associations between same-day temperature adjusted for the other two lags and AD/ADRD ED visits were consistently identified for daily minimum, average, and maximum temperature (Supplementary Figures S8 and S9). We observed attenuated lag-specific effects adjusted for other two lags for lags 1 and 2 in pooled analysis (Supplementary Figures S8 and S9). Numerical values of all estimated odds ratios, the corresponding 95% confidence intervals, and AIC from different models (Supplementary Table S4) are provided in Supplementary Materials.
4. DISCUSSION
Over 3.4 million ED visits for AD/ADRD from five US states across different climate regions were analyzed in our large population-based study. We found consistent positive short-term temperature effects on AD/ADRD ED visits for various temperature metrics (i.e., daily minimum, average, and maximum temperature) during the warm season. Our study provides new epidemiological evidence that short-term exposure to ambient temperature is linked to increased AD/ADRD ED visits for individuals aged 45 years or above, indicating an underestimated public health burden associated with global warming.
In this study, we observed regional differences in the risk of AD/ADRD ED visits across five US states reflecting different geographical and climatic regions. Compared to other states, the strongest positive associations between daily minimum temperature and AD/ADRD ED visits measured by odds ratio associated with a change in 3-day daily minimum temperature from their 50th to 95th percentiles was observed in California. It is known that the daily minimum temperature typically occurs at night time and is deemed as a proxy for nighttime exposure. We speculate that the strongest effects of the daily minimum temperature in California might because the percent of homes with air conditioner (AC) is probably the lowest among these five states [43]. People in California may tend to stay in warmer homes compared to people in other four states at night times, which may result in higher risk of being exposed to high temperature.
Three temperature metrics have been examined in this study, consistent positive effects of different temperature metrics on AD/ADRD ED visits were observed (Figures 1 and S1) with strongest effects observed for daily average temperature in pooled analysis and in most states. Models using daily average temperature capture both effects of daily minimum and maximum temperature. The observed strongest effect might because both minimum and maximum temperature have positive effects on AD/ADRD ED visits.
Although there has been no study conducted specifically on the association between short-term ambient temperature exposure and AD/ADRD morbidity as measured by ED visits, our results are consistent with previous studies on dementia-related hospital admissions and mortality [28, 30, 31, 44]. For example, a time-series study found an increase in daily maximum temperature at lag 1 over a certain threshold was associated with increased risk of dementia-related emergency hospital admissions in Madrid [28]. Fritze (2020) reported a short-term effects of heat waves on increasing mortality of people with dementia in Germany [31]. In this analysis, we have primarily focused warm-season months (May-October) and examined shortterm effects using exposures up to 2-day lag. However, previous studies with focuses on mental disorders reported cold effects when exploring longer lags during cold seasons [45], this finding warrants a future research of expanding our analysis to study cold effects.
While previous studies have showed that people with dementia represent a vulnerable subpopulation to high ambient temperature, the most studies have not directly compared AD/ADRD patient populations to the general population. The exposure-response functions estimated in this analysis (Figure 4 and Supplementary Figure S6) highlight that the difference of temperature effects on ED visits between AD/ADRD populations and general populations vary by age group. Specifically, the more pronounced difference is observed among individual aged 65-74 years. One possible explanation is that older populations commonly suffer from declined motor function [46, 47], which may impair their physical functioning, which prevent them from outdoors activities. In general, older populations may spend less time for outdoors activities during the day time and have more other comorbidities.
We further observed that the temperature effects for AD/ADRD-related ED visits varied by age group. Specifically, we found stronger positive associations in age groups (45-64 years and 65-74 years) compared to the 75+ age group. For example, the estimated pooled odds ratio associated with the 95th versus 50th percentile exposure contrast of 3-day cumulative exposure for daily minimum temperature was 1.065 (95% CI: 1.046,1.085) for ages 65-74 and 1.026 (95% CI: 1.019, 1.033) for ages ≥75. Older patients generally receive better care as the disease progresses may explain the larger temperature effects was observed among patients aged 65-74 years compared to patients aged 75+ [16]. For example, patients with more severe loss of cognitive functions reside in long-term care facilitates that have improved mitigation strategies against high temperature.
The more pronounced associations were observed for ED visits resulting in a hospital admission versus discharged ED visits (Figure 3). Compared to discharged ED visits, ED visits resulting in a hospital admission likely represent more severe AD/ADRD and/or AD/ADRD cases with more severe comorbidities. This stronger association indicates that patients having more severe outcomes (i.e., AD/ADRD patients that resulted in more sever health conditions) are more sensitive to high temperature. This result highlights the importance of identifying AD/ADRD patients that may be more vulnerable to severe heat-related outcomes. Specifically, further research is warranted to examine which specific patient characteristics and neighborhood factors may confer differential risks of extreme heat as done similarly for other outcomes [48–51]
One particular analysis is to assess effect modification by co-morbid conditions among AD/ADRD ED visits. A growing number of epidemiological and neuropathological studies have suggested the associations between cardiovascular risk factors (e.g., hypertension, diabetes, and obesity) and AD/ADRD [22, 52–54]. AD/ADRD patients are also known to have higher prevalence of other co-morbid conditions, including respiratory diseases and chronic kidney diseases [55–57]. We also found that the majority of ascertained AD/ADRD ED visits were identified with ICD-9/10 codes in secondary diagnosis field. For example, among our AD/ADRD ED visits, we found that more than 80% had a co-diagnosis of cardiovascular disease. Thus, the primary reason for many visits was likely for conditions other than AD/ADRD, and using only ED visits with a primary AD/ADRD diagnosis could be an underestimation of the AD/ADRD morbidity.
Another area of future research is to consider other types of extreme temperature exposures. For example, heat wave represents a sustained period of extreme heat (e.g., at least 2 days above the 98th percentile). The frequency, intensity, and duration of extreme heat events are predicted to increase in the future [5, 6]. For the US, the number of days with extreme heat events and the duration of extreme heat events are both projected to be doubled by 2065 [7]. There are numerous epidemiological studies have shown that heatwaves were associated with higher risks of ED visits and hospital admission [58, 59]. Studies from extreme heat events have also identified the AD/ADRD patients as vulnerable population for mortality [60, 61].
Our analysis has mainly focused on assessing effects of ambient temperatures, however, other meteorological exposures (e.g., humidity, solar radiation, and precipitation) may also have impacts on the health outcomes. A prior study in Australia found that an increase in temperature and humidity is associated with an increase in the proportions of individuals with mental health conditions [62]. One possible future study is to examine joint effects of temperature and humidity on AD/ADRD ED visits.
As reported in the literature, AD accounts for 60% - 80% of all-cause dementia cases. However, in our study, the proportion of AD ED visits out of AD/ADRD-related ED visits were only around 20% - 30% across different states (Supplementary Table S2). This difference might be attributed to several reasons. First, we used diagnosis codes from bill records to identify AD and ADRD, which may suffer from differential under-reporting. Second, our case ascertainment may be impacted by disparities in patient’s health care. There is an increasing evidence base to suggest the existence of disparities in health care access for AD/ADRD (e.g., diagnosis, treatment) [22, 63], including differences between racial groups [64–66].
Our study has several limitations that are typical of similar population-based analyses of ambient temperature. First, we used ambient temperature as a surrogate to personal exposures. Specifically, using ambient temperature fails to capture individual heterogeneity in temperature measurements due to indoor temperatures and urban heat island. However, we utilized the Daymet temperature product that allowed us to account for spatial variation in exposure across patient ZIP codes, which has been shown to result in stronger health effect estimates compared to the use of coarser exposure assessment methods [9]. Further, we also assessed different temperature metrics (e.g., maximum and minimum), which may reflect different timing of exposures. Second, outcome misclassification may occur in identifying AD/ADRD ED visits based on diagnosis codes. Exposure measurement error may also occur due to the use of patient reported residential ZIP code. However, in our setting, exposure misclassifications are likely to be independent of ambient temperature and health outcome, which result in effect attenuation. Finally, the case-crossover design only allows for evaluating effects of ambient temperature on ED visits among people with AD/ADRD who had an encounter at the ED. Such subpopulations might not necessarily be representative of whole at-risk populations.
Specific strengths of our study include the consideration of both ED visits resulting in hospital admissions and discharged ED visits, the use of a spatially-resolved temperature product, and the inclusion of ADRD and all patients above the age of 45.
In conclusion, we found consistent associations between short-term exposure to heat and increased risk of AD/ADRD ED visits across five US states. People with AD/ADRD may represent a vulnerable population affected by short-term exposure to high temperature. Our results support the development of more targeted strategies to reduce heat-related AD/ADRD morbidity.
Supplementary Material
Alzheimer’s disease (AD) and related dementia (ADRD) impact millions of Americans
High ambient temperature may be a risk factor for AD/ADRD morbidity
We analyzed over 3.4 millions AD/ADRD emergency department (ED) visits in 5 states
We found positive associations between ambient temperature and AD/ADRD ED visits
Associations were stronger for AD/ADRD ED visits resulting in hospital admission
Acknowledgements
The data used to produce this publication were acquired from the: California Office of Statewide Health Planning and Development (years 2005-2016); the Missouri Department of Health and Senior Services (years 2005-2018); the North Carolina Hospital (inpatient, ambulatory surgery/outpatient, emergency room) Discharge Database (Truven Health Analytics, years 2011-2017) from the Cecil G. Sheps Center for Health Services Research and the North Carolina Division of Health Service Regulation; the Center for Health Statistics & Informatics of the New Jersey Department of Health, Trenton, NJ (years 2005-2016); and the Statewide Planning and Research Cooperative System of the New York State Department of Health (years 2005-2016). This study was approved by Emory University’s IRB Committee (IRB study number: 46509). The contents of this publication including data analysis, interpretation, conclusions derived, and the views expressed herein are solely those of the authors and do not represent the conclusions or official views of data sources listed above. The data sources, their employees, officers, and agents make no representation, warranty or guarantee as to the accuracy, completeness, currency, or suitability of the information provided here. The authors also thank Edgar Castro for providing the Daymet exposure data used in this study.
Funding:
The work is supported by grant R01ES027892 and R21ES032606 from the National Institutes of Environmental Health. The content is solely the responsibility of the authors and does not necessarily represent the official views of the National Institutes of Health.
Footnotes
Publisher's Disclaimer: This is a PDF file of an unedited manuscript that has been accepted for publication. As a service to our customers we are providing this early version of the manuscript. The manuscript will undergo copyediting, typesetting, and review of the resulting proof before it is published in its final form. Please note that during the production process errors may be discovered which could affect the content, and all legal disclaimers that apply to the journal pertain.
CRediT authorship contribution statement
Yuzi Zhang: Formal analysis and Writing - original draft. Stefanie T. Ebelt: Writing - review & editing and Funding acquisition. Liuhua Shi: Writing - review & editing. Noah C. Scovronick: Writing - review & editing. Rohan R. D’Souza: Data curation and Writing - review & editing. Kyle Steenland: Writing - review & editing. Howard H. Chang: Conceptualization, Funding acquisition, Project administration, Validation, Supervision, Writing - review & editing.
Declaration of Competing Interest
The authors declare that they have no known competing financial interests or personal relationships that could have appeared to influence the work reported in this paper.
References:
- 1.Ahmed M, Introduction to Modern Climate Change. Andrew E. Dessler: Cambridge University Press, 2011, 252 pp, ISBN-10: 0521173159. 2020, Elsevier. [Google Scholar]
- 2.Vicedo-Cabrera AM, et al. , The burden of heat-related mortality attributable to recent human-induced climate change. Nature climate change, 2021. 11(6): p. 492–500. [DOI] [PMC free article] [PubMed] [Google Scholar]
- 3.Oliver EC, et al. , Longer and more frequent marine heatwaves over the past century. Nature communications, 2018. 9(1): p. 1–12. [DOI] [PMC free article] [PubMed] [Google Scholar]
- 4.Cowan T, et al. , Present-day greenhouse gases could cause more frequent and longer Dust Bowl heatwaves. Nature Climate Change, 2020. 10(6): p. 505–510. [Google Scholar]
- 5.Vose R, et al. , Temperature changes in the United States. 2017. [Google Scholar]
- 6.Baldwin JW, et al. , Temporally compound heat wave events and global warming: An emerging hazard. Earth’s Future, 2019. 7(4): p. 411–427. [Google Scholar]
- 7.Dahl K, et al. , Increased frequency of and population exposure to extreme heat index days in the United States during the 21st century. Environmental Research Communications, 2019. 1(7): p. 075002. [Google Scholar]
- 8.Jones B, et al. , Future population exposure to US heat extremes. Nature Climate Change, 2015. 5(7): p. 652–655. [Google Scholar]
- 9.Thomas N, et al. , Time-series analysis of daily ambient temperature and emergency department visits in five US cities with a comparison of exposure metrics derived from 1-km meteorology products. Environmental Health, 2021. 20(1): p. 1–10. [DOI] [PMC free article] [PubMed] [Google Scholar]
- 10.Bobb JF, et al. , Cause-specific risk of hospital admission related to extreme heat in older adults. Jama, 2014. 312(24): p. 2659–2667. [DOI] [PMC free article] [PubMed] [Google Scholar]
- 11.Borg M, et al. , The impact of daily temperature on renal disease incidence: an ecological study. Environmental Health, 2017. 16(1): p. 1–30. [DOI] [PMC free article] [PubMed] [Google Scholar]
- 12.Lim Y-H, et al. , Ambient temperature and hospital admissions for acute kidney injury: A time-series analysis. Science of The Total Environment, 2018. 616: p. 1134–1138. [DOI] [PubMed] [Google Scholar]
- 13.Ban J, et al. , The effect of high temperature on cause-specific mortality: A multi-county analysis in China. Environment international, 2017. 106: p. 19–26. [DOI] [PMC free article] [PubMed] [Google Scholar]
- 14.Kivipelto M, Mangialasche F, and Ngandu T, Lifestyle interventions to prevent cognitive impairment, dementia and Alzheimer disease. Nature Reviews Neurology, 2018. 14(11): p. 653–666. [DOI] [PubMed] [Google Scholar]
- 15.International A.s.D., World Alzheimer report 2019: attitudes to dementia. Alzheimer’s Disease International: London, 2019. [Google Scholar]
- 16.2021 Alzheimer’s disease facts and figures. Alzheimers Dement, 2021. 17(3): p. 327–406. [DOI] [PubMed] [Google Scholar]
- 17.Heron MP, Deaths: leading causes for 2016. 2018. [Google Scholar]
- 18.Matthews KA, et al. , Racial and ethnic estimates of Alzheimer’s disease and related dementias in the United States (2015–2060) in adults aged ⩾ 65 years. Alzheimer’s & Dementia, 2019. 15(1): p. 17–24. [DOI] [PMC free article] [PubMed] [Google Scholar]
- 19.Corriveau RA, et al. , Alzheimer’s Disease–Related Dementias Summit 2016: National research priorities. Neurology, 2017. 89(23): p. 2381–2391. [DOI] [PMC free article] [PubMed] [Google Scholar]
- 20.Hebert LE, et al. , Alzheimer disease in the United States (2010–2050) estimated using the 2010 census. Neurology, 2013. 80(19): p. 1778–1783. [DOI] [PMC free article] [PubMed] [Google Scholar]
- 21.Deb A, et al. , Direct and indirect cost of managing Alzheimer’s disease and related dementias in the United States. Expert review of pharmacoeconomics & outcomes research, 2017. 17(2): p. 189–202. [DOI] [PMC free article] [PubMed] [Google Scholar]
- 22.Longhe Z, 2020 Alzheimer’s disease facts and figures. Alzheimer’s & Dementia, 2020. 16. [DOI] [PubMed] [Google Scholar]
- 23.Motzko-Soares A, et al. , Thermoregulatory profile of neurodegeneration -induced dementia of the Alzheimer’s type using intracerebroventricular streptozotocin in rats. Acta Physiologica, 2018. 224(2): p. e13084. [DOI] [PubMed] [Google Scholar]
- 24.Volicer L, et al. , Sundowning and circadian rhythms in Alzheimer’s disease. American Journal of Psychiatry, 2001. 158(5): p. 704–711. [DOI] [PubMed] [Google Scholar]
- 25.Harper DG, et al. , Differential circadian rhythm disturbances in men with Alzheimer disease and frontotemporal degeneration. Archives of general psychiatry, 2001. 58(4): p. 353–360. [DOI] [PubMed] [Google Scholar]
- 26.Klegeris A, et al. , Increase in core body temperature of Alzheimer’s disease patients as a possible indicator of chronic neuroinflammation: a meta-analysis. Gerontology, 2007. 53(1): p. 7–11. [DOI] [PubMed] [Google Scholar]
- 27.van Hoof J, et al. , Thermal comfort and the integrated design of homes for older people with dementia. Building and Environment, 2010. 45(2): p. 358–370. [Google Scholar]
- 28.Linares C, et al. , Short-term association between environmental factors and hospital admissions due to dementia in Madrid. Environmental research, 2017. 152: p. 214–220. [DOI] [PubMed] [Google Scholar]
- 29.Culqui D, et al. , Association between environmental factors and emergency hospital admissions due to Alzheimer’s disease in Madrid. Science of The Total Environment, 2017. 592: p. 451–457. [DOI] [PubMed] [Google Scholar]
- 30.Xu Z, et al. , Heatwaves, hospitalizations for Alzheimer’s disease, and postdischarge deaths: A population-based cohort study. Environmental research, 2019. 178: p. 108714. [DOI] [PubMed] [Google Scholar]
- 31.Fritze T, The Effect of Heat and Cold Waves on the Mortality of Persons with Dementia in Germany. Sustainability, 2020. 12(9): p. 3664. [Google Scholar]
- 32.Wei Y, et al. , Associations between seasonal temperature and dementia-associated hospitalizations in New England. Environment international, 2019. 126: p. 228–233. [DOI] [PMC free article] [PubMed] [Google Scholar]
- 33.Warehouse CCD Chronic Condition Algorithms. 2022. March 16, 2022]; Available from: https://www2.ccwdata.org/web/guest/condition-categories-chronic#cc27.
- 34.Thornton M, et al. , Daymet: Daily surface weather data on a 1-km grid for North America, Version 4. ORNL DAAC: Oak Ridge, TN, USA, 2020. [Google Scholar]
- 35.Thornton PE, Running SW, and White MA, Generating surfaces of daily meteorological variables over large regions of complex terrain. Journal of hydrology, 1997. 190(3-4): p. 214–251. [Google Scholar]
- 36.Akaike H, A new look at the statistical model identification. IEEE transactions on automatic control, 1974. 19(6): p. 716–723. [Google Scholar]
- 37.Thornton PE, Hasenauer H, and White MA, Simultaneous estimation of daily solar radiation and humidity from observed temperature and precipitation: an application over complex terrain in Austria. Agricultural and forest meteorology, 2000. 104(4): p. 255–271. [Google Scholar]
- 38.Kelley BJ, Boeve BF, and Josephs KA, Young-onset dementia: demographic and etiologic characteristics of 235 patients. Archives of neurology, 2008. 65(11): p. 1502–1508. [DOI] [PubMed] [Google Scholar]
- 39.Wangtongkum S, et al. , Prevalence of dementia among population age over 45 years in Chiang Mai, Thailand. Medical journal of the Medical Association of Thailand, 2008. 91(11): p. 1685. [PubMed] [Google Scholar]
- 40.Vieira RT, et al. , Epidemiology of early-onset dementia: a review of the literature. Clinical practice and epidemiology in mental health: CP & EMH, 2013. 9: p. 88. [DOI] [PMC free article] [PubMed] [Google Scholar]
- 41.Armstrong BG, Gasparrini A, and Tobias A, Conditional Poisson models: a flexible alternative to conditional logistic case cross-over analysis. BMC medical research methodology, 2014. 14(1): p. 1–6. [DOI] [PMC free article] [PubMed] [Google Scholar]
- 42.Team, R.C., R: A language and environment for statistical computing. 2021, R Foundation for Statistical Computing, Vienna, Austria. [Google Scholar]
- 43.Administration USEI RESIDENTIAL ENERGY CONSUMPTION SURVEY (RECS). 2020. May 26, 2022]; Available from: https://www.eia.gov/consumption/residential/data/2020/. [Google Scholar]
- 44.Zanobetti A, et al. , Susceptibility to mortality in weather extremes: effect modification by personal and small area characteristics in a multi-city case-only analysis. Epidemiology (Cambridge, Mass.), 2013. 24(6): p. 809. [DOI] [PMC free article] [PubMed] [Google Scholar]
- 45.Yoo E.-h., et al. , Effect of extreme temperatures on daily emergency room visits for mental disorders. Environmental Science and Pollution Research, 2021. 28(29): p. 39243–39256. [DOI] [PubMed] [Google Scholar]
- 46.Wang L, et al. , Performance-based physical function and future dementia in older people. Archives of internal medicine, 2006. 166(10): p. 1115–1120. [DOI] [PubMed] [Google Scholar]
- 47.Buchman AS and Bennett DA, Loss of motor function in preclinical Alzheimer’s disease. Expert review of neurotherapeutics, 2011. 11(5): p. 665–676. [DOI] [PMC free article] [PubMed] [Google Scholar]
- 48.Green RS, et al. , The effect of temperature on hospital admissions in nine California counties. International journal of public health, 2010. 55(2): p. 113–121. [DOI] [PubMed] [Google Scholar]
- 49.Anderson GB, et al. , Heat-related emergency hospitalizations for respiratory diseases in the Medicare population. American journal of respiratory and critical care medicine, 2013. 187(10): p. 1098–1103. [DOI] [PMC free article] [PubMed] [Google Scholar]
- 50.Fletcher BA, et al. , Association of summer temperatures with hospital admissions for renal diseases in New York State: a case-crossover study. American journal of epidemiology, 2012. 175(9): p. 907–916. [DOI] [PubMed] [Google Scholar]
- 51.Iranpour S, et al. , Modification of the effect of ambient air temperature on cardiovascular and respiratory mortality by air pollution in Ahvaz, Iran. Epidemiology and health, 2020. 42. [DOI] [PMC free article] [PubMed] [Google Scholar]
- 52.Ahtiluoto S, et al. , Diabetes, Alzheimer disease, and vascular dementia: a population-based neuropathologic study. Neurology, 2010. 75(13): p. 1195–1202. [DOI] [PubMed] [Google Scholar]
- 53.Sharp SI, et al. , Hypertension is a potential risk factor for vascular dementia: systematic review. International journal of geriatric psychiatry, 2011. 26(7): p. 661–669. [DOI] [PubMed] [Google Scholar]
- 54.Golimstok A, et al. , Cardiovascular risk factors and frontotemporal dementia: a case–control study. Translational neurodegeneration, 2014. 3(1): p. 1–6. [DOI] [PMC free article] [PubMed] [Google Scholar]
- 55.Russ TC, et al. , Pulmonary function as a risk factor for dementia death: an individual participant meta-analysis of six UK general population cohort studies. J Epidemiol Community Health, 2015. 69(6): p. 550–556. [DOI] [PubMed] [Google Scholar]
- 56.Russ TC, Kivimäki M, and Batty GD, Respiratory disease and lower pulmonary function as risk factors for dementia: a systematic review with meta-analysis. Chest, 2020. 157(6): p. 1538–1558. [DOI] [PubMed] [Google Scholar]
- 57.Zammit AR, et al. , Cognitive impairment and dementia in older adults with chronic kidney disease: a review. Alzheimer disease and associated disorders, 2016. 30(4): p. 357. [DOI] [PMC free article] [PubMed] [Google Scholar]
- 58.Chen T, et al. , Time-series analysis of heat waves and emergency department visits in Atlanta, 1993 to 2012. Environmental health perspectives, 2017. 125(5): p. 057009. [DOI] [PMC free article] [PubMed] [Google Scholar]
- 59.Hansen A, et al. , The effect of heat waves on mental health in a temperate Australian city. Environmental health perspectives, 2008. 116(10): p. 1369–1375. [DOI] [PMC free article] [PubMed] [Google Scholar]
- 60.Conti S, et al. , General and specific mortality among the elderly during the 2003 heat wave in Genoa (Italy). Environmental research, 2007. 103(2): p. 267–274. [DOI] [PubMed] [Google Scholar]
- 61.Thompson R, et al. , Heatwave mortality in summer 2020 in England: an observational study. International journal of environmental research and public health, 2022. 19(10): p. 6123. [DOI] [PMC free article] [PubMed] [Google Scholar]
- 62.Ding N, Berry HL, and Bennett CM, The importance of humidity in the relationship between heat and population mental health: evidence from Australia. PloS one, 2016. 11(10): p. e0164190. [DOI] [PMC free article] [PubMed] [Google Scholar]
- 63.Aranda MP, et al. , Impact of dementia: Health disparities, population trends, care interventions, and economic costs. Journal of the American Geriatrics Society, 2021. 69(7): p. 1774–1783. [DOI] [PMC free article] [PubMed] [Google Scholar]
- 64.Milani SA, et al. , Optimal cutoffs for the Montreal Cognitive Assessment vary by race and ethnicity. Alzheimer’s & Dementia: Diagnosis, Assessment & Disease Monitoring, 2018. 10: p. 773–781. [DOI] [PMC free article] [PubMed] [Google Scholar]
- 65.Zuckerman IH, et al. , Racial and ethnic disparities in the treatment of dementia among Medicare beneficiaries. The Journals of Gerontology Series B: Psychological Sciences and Social Sciences, 2008. 63(5): p. S328–S333. [DOI] [PMC free article] [PubMed] [Google Scholar]
- 66.Thorpe CT, et al. , Racial and ethnic differences in initiation and discontinuation of antidementia drugs by Medicare beneficiaries. Journal of the American Geriatrics Society, 2016. 64(9): p. 1806–1814. [DOI] [PMC free article] [PubMed] [Google Scholar]
Associated Data
This section collects any data citations, data availability statements, or supplementary materials included in this article.