Abstract
Background and Objective
Upadacitinib, an oral selective and reversible Janus kinase (JAK) inhibitor, showed favorable efficacy and safety in patients with moderate-to-severe ulcerative colitis (UC). The objective was to characterize upadacitinib pharmacokinetics in UC patients across Phase 2b and 3 trials and evaluate the relationships between upadacitinib plasma exposures and key efficacy or safety endpoints.
Methods
Population pharmacokinetics and exposure-response analyses were performed to characterize upadacitinib pharmacokinetics in UC patients and evaluate the relationships between plasma exposures and key efficacy or safety endpoints at the end of 8-week induction and 52-week maintenance periods. Data from 1234 UC patients from Phase 2 and 3 induction trials and 449 UC patients from a Phase 3 maintenance trial were used for these analyses. Additionally, data from patients with rheumatoid arthritis, atopic dermatitis, Crohn’s disease, and healthy volunteers were used in the pharmacokinetics analysis. Quartile plots and logistic regression models were used to evaluate the exposure-response relationships across upadacitinib doses of 7.5–45 mg once daily (QD) for induction and 15–30 mg QD for maintenance.
Results
Upadacitinib plasma exposures were dose-proportional in UC patients across the evaluated dose range. Upadacitinib pharmacokinetics in UC were consistent between the induction and maintenance periods, and with other patient populations. Upadacitinib plasma exposures associated with the 45 mg QD induction dose maximized efficacy for Week 8 clinical and endoscopic endpoints. Plasma exposures associated with upadacitinib 30 mg maintenance dose provided additional incremental benefit compared to 15 mg QD for Week 52 key clinical and endoscopic endpoints. No trends were observed in the evaluated safety events with increasing plasma exposures at the end of induction or maintenance periods.
Conclusion
These analyses supported selection of upadacitinib UC induction and maintenance doses.
Trial Registration
Data from studies NCT02819635 and NCT03653026 were included in these analyses.
Supplementary Information
The online version contains supplementary material available at 10.1007/s40262-022-01191-6.
Key Points
| Upadacitinib pharmacokinetics are consistent between ulcerative colitis and other patient populations. |
| Upadacitinib plasma exposures associated with upadacitinib 45 mg QD approached maximal efficacy across different induction endpoints. |
| Exposures associated with 30 mg provided additional incremental efficacy benefit during maintenance in ulcerative colitis compared to 15 mg QD. |
Introduction
Ulcerative colitis (UC) is one of the two primary forms of idiopathic inflammatory bowel disease along with Crohn's disease (CD). UC is a chronic, relapsing inflammatory disease of the large intestine characterized by inflammation and ulceration of mainly the mucosal and occasionally submucosal intestinal layers. Available pharmaceutical therapies are limited, do not always completely abate the inflammatory process, and may have significant adverse effects. Although some patients with moderate-to-severe symptoms may derive some benefits from available treatment including conventional therapy and biologic agents, large unmet needs remain due to limited efficacy and side effects [1, 2]. Thus, there remains a clear medical need for additional therapeutic options in UC for patients with inadequate response or intolerance to conventional therapies and biologic therapies.
The Janus kinases (JAKs) are a family of intracellular tyrosine kinases that function as dimers in the signaling process of many cytokine receptors [3]. Upadacitinib is an oral selective and reversible JAK inhibitor that recently became approved by the US Food and Drug Administration (FDA) as a treatment in adults with moderately to severely active UC who have had an inadequate response or intolerance to one or more tumor necrosis factor blockers [4]. Upadacitinib has already been approved for the treatment of rheumatoid arthritis (RA), atopic dermatitis (AD), ankylosing spondylitis, and psoriatic arthritis (PsA) in many countries [5], and is currently being evaluated for the treatment of other inflammatory diseases. Upadacitinib has been administered as an extended-release formulation in Phase 3 clinical trials in adult and adolescent patients [6].
Upadacitinib efficacy and safety profiles in patients with moderate-to-severe UC were evaluated in Phase 2b and 3 randomized, double-blinded, placebo-controlled studies. The UC program included three induction U-ACHIEVE (NCT02819635) studies, a Phase 2b (Study 1) and two replicate Phase 3 studies (Study 2 and Study 4), and one maintenance U-ACCOMPLISH study, Study 3 (NCT03653026). Study 1 was a Phase 2b dose-ranging study designed to evaluate the efficacy and safety of different oral doses of upadacitinib [7.5 mg, 15 mg, 30 mg, and 45 mg once daily (QD)] compared to placebo as induction therapy for 8 weeks in patients with UC. After all randomized patients completed the 8-week induction, a dose-selection analysis of efficacy and safety of upadacitinib versus placebo was performed [7]. In Study 1, upadacitinib dosing demonstrated a statistically significant dose-response relationship compared to placebo for the primary efficacy endpoint and all ranked secondary efficacy endpoints, with the highest efficacy response rates observed in the 45 mg QD treatment group for clinical and endoscopic endpoints [8]. Upadacitinib was generally safe and well tolerated. No new safety concerns were identified compared to what has been observed in studies of upadacitinib in other disease indications [8]. Analyses of Study 1 supported the selection of 45 mg QD as the upadacitinib induction dose to evaluate in Phase 3 studies in UC. Upadacitinib 15 mg and 30 mg QD doses were evaluated as maintenance therapy for 52 weeks (Study 3).
Population pharmacokinetics and exposure-response analyses have been conducted for upadacitinib for several indications, such as RA [9, 10], CD [11], PsA [12], and AD [13], which have informed optimal dosing for clinical benefit specific to each disease. The population pharmacokinetics and exposure-response analyses in this work characterized upadacitinib pharmacokinetics in patients with moderately to severely active UC across Phase 2b and 3 trials and evaluated the relationships between upadacitinib plasma exposures and key efficacy and safety endpoints using data from these trials during induction and maintenance treatment.
Methods
Study Design and Populations
The studies included in the analyses were conducted in accordance with Good Clinical Practice guidelines and the ethical principles that have their origin in the Declaration of Helsinki. The protocol and informed consent forms were approved by the institutional review boards or ethics committees for each study included in the analyses, and participants provided written informed consent before any study-related procedures were performed.
Data from three induction studies and one maintenance study in patients with moderately to severely active UC were included in these analyses (Online Supplementary Material (OSM) Table 1). Study 1 was a randomized Phase 2b dose-ranging study with two parts designed to evaluate the safety and efficacy of oral administration of upadacitinib in placebo-controlled 8-week induction studies: Part 1 included 7.5, 15, 30, and 45 mg QD and Part 2 included 30 and 45 mg QD. Study 2 was a two-part Phase 3 study designed to evaluate the efficacy and safety of oral administration of upadacitinib 45 mg QD compared to placebo as induction therapy for up to 16 weeks in patients with UC: (Part 1) a randomized, double-blind, placebo-controlled 8-week induction study; (Part 2) an 8-week, open-label extended treatment period for clinical non-responders from Part 1 of Study 2. Study 3 is a Phase 3 study designed to evaluate the efficacy and safety of oral administration of upadacitinib 15 mg QD and 30 mg QD compared to placebo as maintenance therapy for 52 weeks in patients with UC who achieved clinical response following induction with upadacitinib in Study 1 or Study 2, or Study 4. Study 4 consisted of 2 parts: Part 1 was a randomized, double-blind, placebo-controlled 8-week induction period that evaluated the efficacy and safety of oral administration of upadacitinib 45 mg QD compared to placebo and Part 2 was an open-label, 8-week extended treatment period for participants who did not achieve clinical response at Week 8 in Part 1.
Baseline for pharmacokinetics and efficacy/safety data was defined as the last non-missing value collected prior to the initial dose of study drug in the induction phase. Additional details on the methodology are explained in the OSM.
Pharmacokinetic, Efficacy, and Safety assessments
All pharmacokinetic data from enrolled patients who received at least one dose, had pharmacokinetic sample(s) collected, and had at least one concentration measurement were included in the pharmacokinetic analysis. Efficacy and safety endpoints that were assessed are described in OSM Table 2.
Population Pharmacokinetic Analyses
Population pharmacokinetic models were evaluated using nonlinear mixed-effects modeling with NONMEM 7.4.4 compiled with a GNU Fortran compiler (Version 4.8.3). The first-order conditional estimation method with η-ε interaction (FOCE-INT) was employed for model runs within NONMEM. The population pharmacokinetic analysis was conducted using data from Phase 1 studies, Phase 2b studies in RA, CD, AD, and UC, and Phase 3 studies in UC.
A previously published population pharmacokinetic model for upadacitinib in patients with RA, CD, UC, AD, and healthy volunteers (HVs) was used as the basis for this pharmacokinetic analysis. In this previous model, upadacitinib pharmacokinetics were described by a two-compartment model with mixed zero- and first-order absorption with lag time (for the first order absorption) for the upadacitinib QD formulation [14]. Statistically significant covariates identified in the previous model included subject population (HV vs. AD/UC/CD and RA vs. AD/UC/CD), creatinine clearance, and sex, on apparent oral clearance (CL/F), and sex and body weight on apparent volume of distribution of the central compartment (Vc/F) were retained in the model for the current analysis. Additional covariates were evaluated in the model via stepwise forward inclusion at α = 0.01 and followed by a backward elimination procedure at α = 0.001, both using the likelihood ratio test.
After identifying the statistically significant covariates on upadacitinib pharmacokinetic parameters through the Perl Speaks NONMEMs SCM routine procedure, simulations were performed to explore the impact of significant covariate effects on upadacitinib average plasma concentration (Cavg) and maximum plasma concentration (Cmax) at steady state to characterize the effect of these covariates on upadacitinib plasma exposures.
All model parameters, including covariate effects, from the original model were re-estimated using a combined dataset that included data from Induction phase up to Week 8 of UC Phase 2b/3 studies in addition to the data previously included in the cross-population pharmacokinetic analyses [14]. Different inter-subject variability (ISV) and residual variability model structures were explored in the process of model development by graphical methods to assess model goodness-of-fit (GOF).
Additionally, the following covariates were investigated for influence on upadacitinib pharmacokinetics via visual inspection of appropriate graphics in the UC population: concomitant medication (binary: at least once during sampling or not): corticosteroids, aminosalicylates, methotrexate, antacids; baseline disease characteristics: C-reactive protein (CRP), fecal calprotectin, Adapted Mayo Score, biologic therapy-intolerant or inadequate responder (Bio-IR); and upadacitinib dose group.
The developed model using data from the induction studies was then used to describe the population pharmacokinetics of upadacitinib in a combined dataset that included patients with moderately to severely active UC from Study 3. All pharmacokinetic data up to Week 52 were included for patients in Study 3. Pharmacokinetic data of these patients collected in the induction studies (Study 1 and Study 2, and Study 4) were also included. The previous developed model was validated via a post hoc approach, that is, the population parameter estimates of the fixed effects and estimates for the random effects (inter-individual variability) of the established population pharmacokinetic model fitted using data from the induction studies were used to generate individual post hoc estimates for patients in Study 3. The final model fit was evaluated using GOF and visual predictive checks (VPCs).
Model-estimated steady-state upadacitinib plasma exposures (Cmax, Cavg, and Ctrough) were derived using empirical Bayesian estimates
Exposure-Response Analyses
Upadacitinib exposure-response relationships for efficacy and safety parameters at Week 8 and at Week 52 were evaluated using quartile plots and logistic regression analyses (when appropriate).
The logistic regression models were used to conduct simulations to predict the probabilities of the efficacy endpoints at Week 8 and at Week 52 for the different induction and maintenance treatments, respectively. The logistic regression models were also used to assess the effects of the pre-specified covariates on probabilities of the efficacy endpoints at different treatments (placebo and upadacitinib 15 mg, 30 mg and 45 mg QD for induction endpoints; placebo and upadacitinib 15 mg, 30 mg QD for maintenance endpoints).
The covariates were investigated in the exposure-response analyses in an exploratory fashion by adding each covariate to the primary exposure-response model and evaluating the impact on the parameter estimate for upadacitinib effect in the model. To account for multiple testing in the covariate evaluation, p-values were corrected for a family-wise error rate of 0.05 using the Bonferroni correction. Continuous covariates were scaled with the median of the overall study population. Covariates that showed a statistically significant effect on probabilities of the efficacy or safety endpoints in models with a statistically significant exposure effect were further evaluated for their potential interactions with exposure.
The relationships between upadacitinib exposures and efficacy and safety endpoints were first explored using quartile plots. Only efficacy and safety variables with more than ten events were evaluated further using exposure-response models. Quartile plots for safety were evaluated for Cavg and Cmax (for safety endpoints). Cavg was the main exposure metric used for analyzing the exposure-response models for efficacy and safety endpoints.
Different drug effect exposure-response models [linear, logarithmic, and maximum response (Emax)] as well as a treatment effect model (upadacitinib vs. placebo) with no exposure-response relationship were evaluated to determine the best model describing the upadacitinib effect on the probability of each efficacy and safety endpoint. The selection of logistic regression models was based on Bayesian Information Criterion (BIC), model stability, predictive performance, and adequate precision of parameter estimates.
Results
Data Summary and Demographics
Data from a total of 1,927 subjects from Phase 1 studies, Phase 2b studies in RA, CD, AD, and UC, and Phase 3 studies in UC who received upadacitinib and had at least one upadacitinib concentration greater than the lower limit of quantitation were included in the population pharmacokinetic analyses of the induction treatment for patients with moderate to severely active UC. Data from 978 patients (643 from Study 1 (328) and Study 2 (315), and 335 from Study 4) with UC (from Phase 2b/3 studies in UC) were included in the population pharmacokinetic analyses. Data from 623 patients from Study 3 who received upadacitinib and had at least one measurable upadacitinib concentration were included in the population pharmacokinetic analyses of the maintenance treatment for patients with UC. Summaries of demographics and other baseline characteristics for patients from Study 1, Study 2, Study 3, and Study 4 included in the population pharmacokinetic analysis are presented in OSM Table 3 and OSM Table 4.
Data from 1,234 patients with UC (720 patients for Study 1 (248 main patient group) and Study 2 (472), and 514 patients for Study 4) who received placebo or who received upadacitinib were included in the efficacy and safety exposure-response analyses of induction clinical endpoints. Data from 449 patients who received at least one dose of study drug in Study 3 and were within the first approximately 450 upadacitinib 45 mg QD 8-week induction responders were included in the exposure-response analyses of maintenance clinical endpoints.
Upadacitinib model predicted exposures were dose-proportional in UC patients across the 7.5–45 mg QD dose range (OSM Table 5), and the model adequately described upadacitinib pharmacokinetics across the range of doses in UC patients (Figs. 1 and 2). Upadacitinib pharmacokinetics in UC patients were consistent between the induction and maintenance periods, and with other patient populations (RA, PsA, and AD; Fig. 1).
Fig. 1.
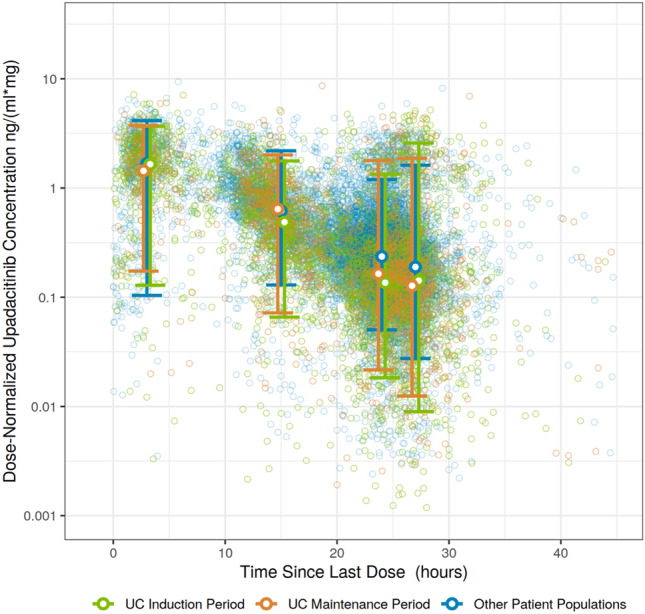
Oberved dose-normalized upadacitinib concentrations from ulcerative colitis (UC) patients during the induction and maintenance periods and compared to other patient populations [rheumatoid arthritis (RA), atopic dermatitis (AD), and psoriatic arthritis (PsA)]. Open circles represent individual observations. Circles and error bars represent median and 5th to 95th percentiels of observations within each time bin
Fig. 2.
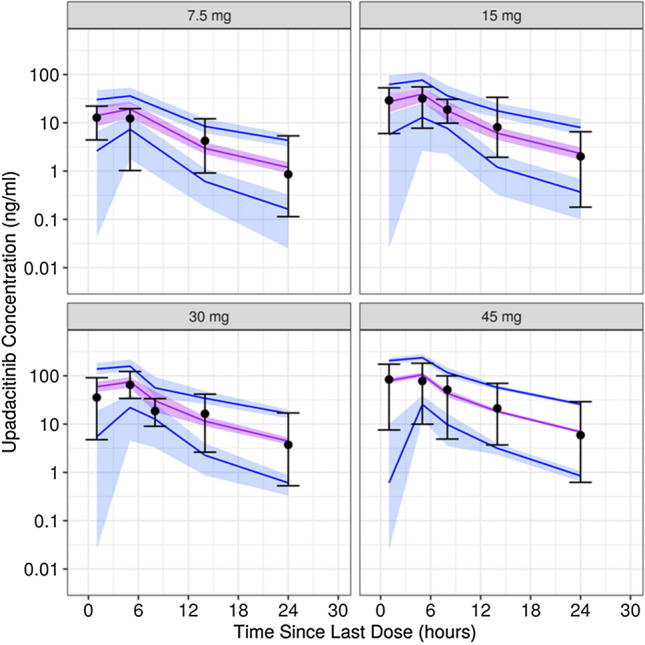
Visual predictive checks of upadacitinib concentration in patients with ulcerative colitis (UC) (induction studies: 1, 2, and 4) stratified by dose group. The blue lines represent the 90% prediction interval of the model, the shaded blue areas represent the associated 90% confidence intervals of the 5th and 95th percentiles of simulated concentrations. The purple line represents the predicted median, the purple shaded area its 90% confidence interval. The dots and error bars are the median and 90% inter-percentile range (5th to 95th percentile) of the observed data. Note: Time bins were chosen at 1, 5, 8, 14, and 24 h after last dose for the 15, 30, and 45 mg groups and at 1, 5, 14, and 24 h after the last dose for the 7.5mg group as there are no observed records at 8 h after the last dose
Population Pharmacokinetic Analysis
Using the previously published population pharmacokinetic model for upadacitinib as a starting point [14], the outlined stepwise covariate selection method was performed. Statistically significant covariates that were included in the model were creatinine clearance, subject population, sex, and aspartate aminotransferase on CL/F; and sex and body weight on Vc/F. The inter-subject variability values for upadacitinib CL/F and Vc/F were 35% and 27%, respectively.
The influence of statistically significant covariates identified in the population pharmacokinetic analyses on model-predicted upadacitinib steady state Cavg and Cmax was assessed performing simulations of the test and reference groups (OSM Fig. 1). Graphical assessments were made to evaluate relationships between upadacitinib pharmacokinetic parameters (CL/F and Vc/F) and relevant covariates (including baseline UC disease severity, UC-specific concomitant medications, and upadacitinib dose group) in patients with UC. No trends were observed for upadacitinib CL/F or Vc/F with covariates (other than those included in the final population pharmacokinetic model) in the parameter versus covariate plots (OSM Figs. 2 and 3).
The final population pharmacokinetic model parameters are presented in OSM Table 6. The GOF plots of the final population pharmacokinetic model for patients with UC are shown in OSM Fig. 4. VPCs for the upadacitinib concentrations in patients with UC (Studies 1, 2, and 4) stratified by induction dose group (Fig. 2) show good agreement between simulated and observed data across the doses evaluated.
The pharmacokinetics model developed using the data from induction trials was used to calculate the individual post hoc estimates for patients in the maintenance study. VPCs for upadacitinib concentrations stratified by maintenance dose group showed that the model adequately described the observed data, supporting consistency of upadacitinib pharmacokinetics between induction and maintenance periods in UC patients (OSM Fig. 5).
Exposure-Response Analyses
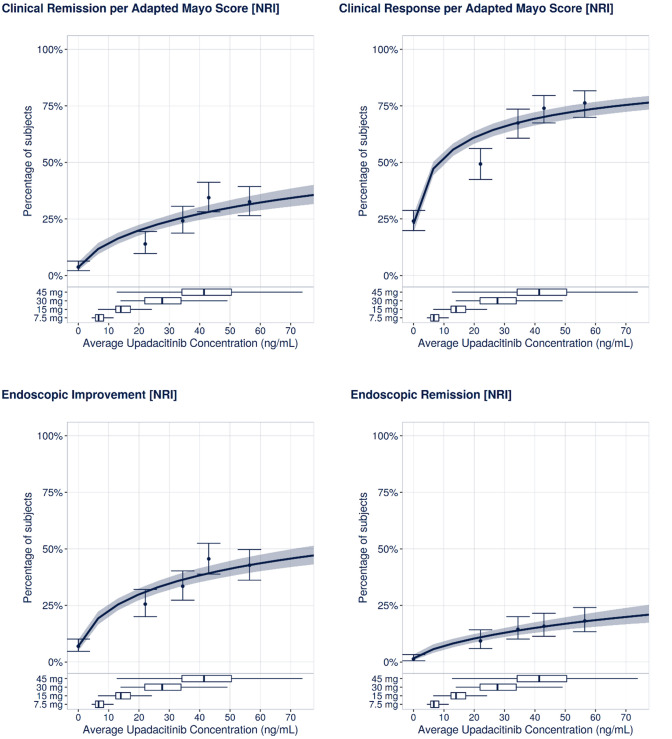
Logistic regression models were constructed relating upadacitinib Cavg to the clinical and endoscopic endpoints, while adjusting for the pre-specified covariates. Following the model selection criteria, a logarithmic shape function best described the exposure-response relationship for all clinical and endoscopic endpoints at Week 8 (clinical remission per Adapted Mayo score, endoscopic improvement, endoscopic remission, and clinical response per Adapted Mayo score). Statistically significant exposure-response relationships with upadacitinib Cavg were observed for all evaluated efficacy endpoints at Week 8. The percentage of patients achieving clinical and endoscopic efficacy endpoints at the end of the induction period increased with increasing upadacitinib Cavg and approached plateau at Cavg values approximately equivalent to the 45 mg QD regimen (Fig. 3). The parameter estimates of the coefficients of the final logistic regression models are shown in OSM Table 7.
Fig. 3.
Observed and model-predicted percentage of patients with ulcerative colitis (UC) who achieved efficacy endpoints at induction Week 8. The dots and error bars represent the median and 95% confidence interval (CI) of observed NRI response by quartile of upadacitinib Cavg; solid lines and shaded areas represent the median and 95% CIs for model-predictions; boxplots represent the spread of exposure for different doses. NRI, nonresponder imputation
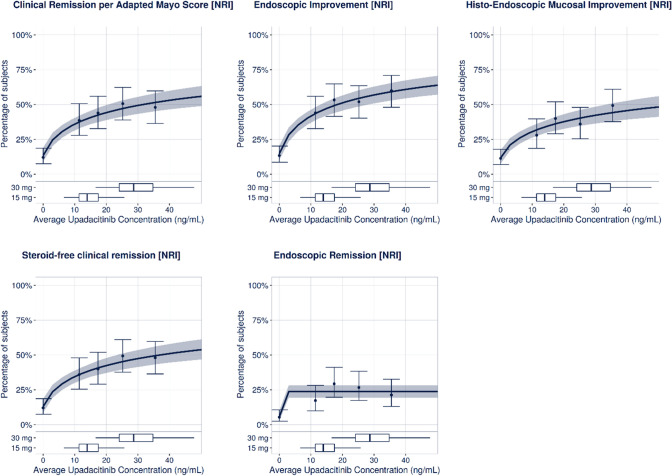
For maintenance endpoints, there was a trend for increasing the percentage of patients achieving clinical remission, steroid-free remission, endoscopic improvement, and histo-endoscopic mucosal improvement within the range of upadacitinib plasma exposures evaluated (Fig. 4). No exposure-response trend was observed for endoscopic remission. Logistic regression models were constructed relating upadacitinib Cavg to maintenance efficacy and clinical endpoints, while adjusting for the pre-specified covariates. Logarithmic exposure-response models best described the exposure-response relationship for clinical remission per Adapted Mayo Score, histo-endoscopic mucosal improvement, and steroid-free clinical remission at Week 52. A treatment effect model best described the exposure-response relationship for endoscopic remission at Week 52. The parameter estimates of the coefficients of the final logistic regression models are shown in OSM Table 7.
Fig. 4.
Observed and model-predicted percentage of patients with ulcerative colitis (UC) who achieved efficacy endpoints at maintenance Week 52. The dots and error bars represent the median and 95% confidence interval (CI) of observed NRI response by quartile of upadacitinib Cavg; solid lines and shaded areas represent the median and 95% CIs for model-predictions; boxplots represent the spread of exposure for different doses. NRI, nonresponder imputation
Covariates of interest were explored for their impact on the different clinical and endoscopic efficacy endpoints at the end of induction and maintenance treatment (OSM Table 8). Sex and albumin were statistically significant factors for endoscopic improvement at Week 8. Sex was also a statistically significant factor for clinical remission per Adapted Mayo Score at Week 8. Clinical remission status per Adapted Mayo score at Week 0 was a statistically significant factor for all maintenance endpoints, and age was a statistically significant covariate for clinical remission per Adapted Mayo score and steroid-free clinical remission at Week 52. However, the inclusion of the covariates did not change the estimated effect of upadacitinib Cavg and did not have significant interaction with the upadacitinib exposure effect in the model (OSM Tables 9 and 10).
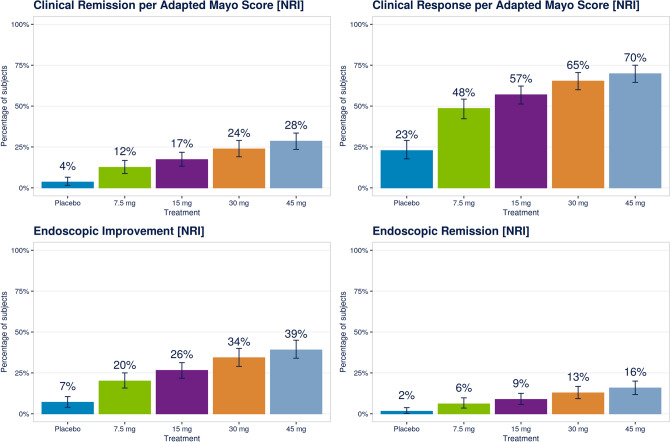
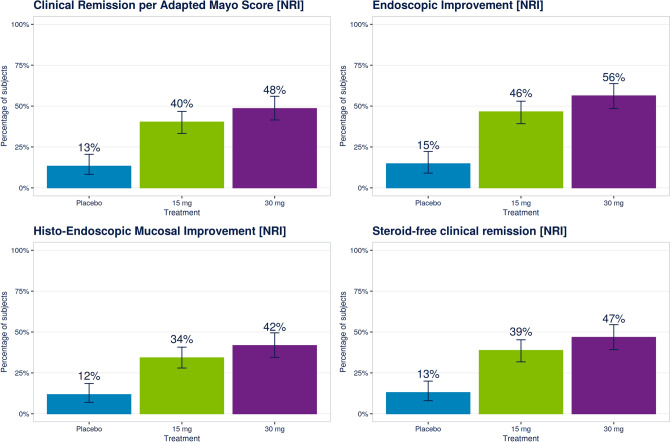
The model-predicted efficacy for different induction and maintenance regimens of upadacitinib are provided in Figs. 5, 6, respectively. Based on the exposure-response models, upadacitinib 45 mg QD is predicted to result in 3–5% greater percentage of patients achieving the different evaluated efficacy endpoints compared to a 30 mg QD regimen. Across these maintenance efficacy endpoints, model-predicted response rates demonstrated 8–10% greater efficacy with the upadacitinib 30 mg dose compared to the 15 mg dose.
Fig. 5.
Model-predicted efficacy responses by treatment group at induction Week 8 (median and 95% prediction interval)
Fig. 6.
Model-predicted efficacy responses by treatment group at maintenance Week 52 for the endpoints that demonstrated exposure-response relationships (median and 95% prediction interval)
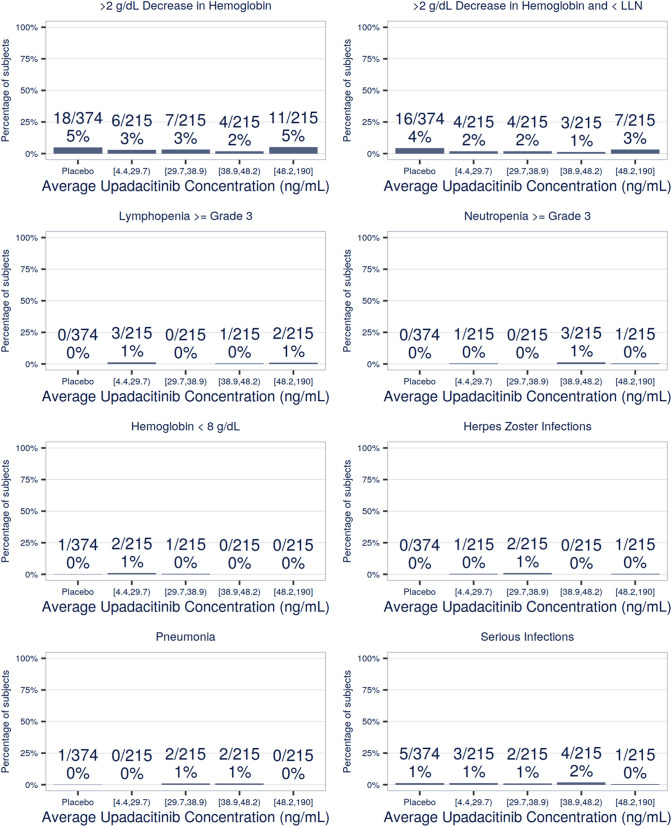
There was no trend for exposure-response relationships within the range of evaluated upadacitinib exposures for any of the evaluated safety endpoints (> 2 g/dL decrease in hemoglobin and > 2 g/dL decrease in hemoglobin and < lower limit for normal, lymphopenia ≥ Grade 3, neutropenia ≥ Grade 3, hemoglobin < 8 g/dL, lymphopenia ≥ Grade 4, neutropenia ≥ Grade 4, Herpes zoster infections, pneumonia, and serious infections) at the end of the induction or maintenance periods (Fig. 7 and OSM Fig. 6, respectively).
Fig. 7.
Exposure-response quartile plots for safety variables at Week 8 in patients with moderate to severe ulcerative colitis (UC)
Discussion
These analyses represent a comprehensive assessment of upadacitinib pharmacokinetics and exposure-response relationships in UC patients utilizing data across dose-ranging and registrational clinical trials, and were essential in supporting the recommended induction and maintenance doses in UC in global regulatory submissions. Upadacitinib pharmacokinetics were dose-proportional across the 7.5–45 mg QD dose range consistent between UC patients and patients from other autoimmune disease populations (e.g., RA, AD, and PsA). Additionally, there was no significant effect of UC-specific baseline characteristics (e.g., disease duration and UC-specific concomitant medications) on upadacitinib pharmacokinetic parameters. The inter-subject variability for upadacitinib CL/F and Vc/F were 35% and 27%, respectively, which were similar to prior estimates based on population analyses in other patient populations [14]. This highlights that upadacitinib absorption and elimination from the extended-release formulation are not affected by inflammation in the colon in UC patients. The effects of covariates on upadacitinib pharmacokinetics were generally consistent between the analyses including data across UC clinical trials and other prior analyses, and there was no clinically relevant difference in upadacitinib plasma exposures between different patient subgroups for statistically significant covariates (OSM Fig. 1).
In the efficacy exposure-response analyses, the predicted percentage of patients achieving clinical remission, clinical response, and the endoscopic endpoints (improvement and remission) at Week 8 increased with increasing upadacitinib plasma exposures with maximal upadacitinib efficacy appeared to be approached at Cavg of ~40 ng/mL and higher, which is approximately equivalent to the median Cavg for 45 mg QD. None of the evaluated covariates and baseline characteristics had a clinically relevant effect on the upadacitinib exposure-response relationship. These results demonstrate that exposures associated with upadacitinib 45 mg QD maximize efficacy in UC patients across different patient subgroups. For maintenance, model-predicted response rates demonstrated 8–10% greater efficacy for clinical remission per Adapted Mayo score, endoscopic improvement, histologic endoscopic mucosal improvement, and steroid-free clinical remission with the upadacitinib exposures associated with the 30 mg dose compared to the 15 mg dose. No exposure-response relationship beyond treatment effect was identified for endoscopic remission at Week 52. The lack of exposure-response for endoscopic remission at Week 52, in contrast to all of the other evaluated clinical and endoscopic endpoints, could possibly be due to the stringency of the endpoint and the relatively fewer number of subjects in the trial achieving it. A similar phenomenon was observed in the tofacitinib UC study where the percentage of subjects achieving the more stringent endpoints were relatively lower than the other endpoints and similar for high- and low-dose treatment [15]. Clinical remission status per Adapted Mayo score at Week 0 was a statistically significant factor for all endpoints, and age was a statistically significant covariate for clinical remission per Adapted Mayo score and steroid-free clinical remission. However, neither of the two covariates had a statistically significant interaction with the upadacitinib exposure effect in any of the evaluated endpoints, indicating consistency of upadacitinib efficacy exposure-response relationships at Week 52 across the different patient subgroups.
There was no trend for exposure-response relationships with any of the evaluated endpoints for safety or clinically relevant changes in laboratory parameters at induction Week 8 or maintenance Week 52, within the range of upadacitinib plasma exposures evaluated in the induction (7.5–45 mg QD exposures) or maintenance (15–30 mg QD exposures) clinical trials. Of note, the trend of the relationship between upadacitinib plasma exposures and decreases in hemoglobin appeared different in UC compared to other patient populations (e.g., RA and PsA) [9, 12]. In UC, a shallow decreasing trend was observed for the percentage of patients experiencing a decrease in hemoglobin with increasing upadacitinib plasma exposures, reflecting improvements in anemia with increasing upadacitinib exposures. This is opposite to the trend observed in RA and PsA within the range of plasma exposures evaluated in these indications [9, 12]. Gastrointestinal bleeding is one of the hallmarks of UC [16]; therefore, the trend for a decrease in the percentage of patients experiencing a decrease in hemoglobin with increasing upadacitinib plasma exposures might reflect improvement in the clinical symptoms including bleeding. This further demonstrates that optimal doses and exposure-response relationships for upadacitinib are different between different autoimmune diseases, which is reflected by the different doses recommended for the different indications. Given the consistency of upadacitinib pharmacokinetics between patient populations, the difference in optimal doses between populations is due to a difference in benefit-risk and exposure-response relationships and not due to differences in plasma exposures.
In summary, upadacitinib pharmacokinetics in UC patients were well characterized using the developed population pharmacokinetics model and were consistent with other evaluated patient populations. Upadacitinib plasma exposures associated with the 45 mg QD induction dose maximized efficacy for clinical and endoscopic endpoints at Week 8. Plasma exposures associated with a upadacitinib 30 mg maintenance dose provided additional incremental efficacy benefit compared to 15 mg QD for key clinical and endoscopic endpoints at Week 52. No trends were observed for an increase in the evaluated safety events with increasing upadacitinib plasma exposures at induction Week 8 or maintenance Week 52 within the range of upadacitinib doses evaluated in UC studies. These analyses were important to support the global regulatory submissions for upadacitinib in UC.
Supplementary Information
Below is the link to the electronic supplementary material.
Acknowledgements
Medical writing support was provided by Mia DeFino, MS, ELS, a freelance medical writer under contract with AbbVie. Programming support was provided by Esteban Hernandez Maldonado MSc.
Author contributions
AVP, SS, DE, WZ, WL, and MFM wrote the manuscript. AVP, SS, DE, WZ, WL, and MFM designed the research. AVP, SS, DE, WZ, WL, and MFM analyzed the data.
Declarations
Conflict of interest statement
All authors are employees at AbbVie and may hold AbbVie stock.
Ethics approval
The studies were conducted in accordance with Good Clinical Practice Guidelines and the ethical principles that have their origin in the Declaration of Helsinki. The protocols were approved by the institutional review board or ethics committee for each site.
Consent to participate
Each subject provided written informed consent before any study-related procedures were performed.
Consent for publication
All authors provided consent for publication.
Code availability
Not available.
Funding information
AbbVie provided financial support for the studies and participated in the study design, study conduct, and analysis and interpretation of data and the writing, review, and approval of the manuscript.
Data sharing
AbbVie is committed to responsible data sharing regarding the clinical trials we sponsor. This includes access to anonymized, individual, and trial-level data (analysis data sets), as well as other information (e.g., protocols and Clinical Study Reports), as long as the trials are not part of an ongoing or planned regulatory submission. This includes requests for clinical trial data for unlicensed products and indications. This clinical trial data can be requested by any qualified researchers who engage in rigorous, independent scientific research and will be provided following review and approval of a research proposal and Statistical Analysis Plan (SAP) and execution of a Data Sharing Agreement (DSA). Data requests can be submitted at any time, and the data will be accessible for 12 months, with possible extensions considered. For more information on the process or to submit a request, visit the following link: https://www.abbvie.com/our-science/clinical-trials/clinical-trials-data-and-information-sharing/data-and-information-sharing-with-qualified-researchers.html.
References
- 1.Fumery M, Singh S, Dulai PS, Gower-Rousseau C, Peyrin-Biroulet L, Sandborn WJ. Natural History of Adult Ulcerative Colitis in Population-based Cohorts: A Systematic Review. Clin Gastroenterol Hepatol. 2018;16(3):343–56e3. doi: 10.1016/j.cgh.2017.06.016. [DOI] [PMC free article] [PubMed] [Google Scholar]
- 2.Rubin DT, Ananthakrishnan AN, Siegel CA, Sauer BG, Long MD. ACG clinical guideline: ulcerative colitis in adults. Am J Gastroenterol. 2019;114(3):384–413. doi: 10.14309/ajg.0000000000000152. [DOI] [PubMed] [Google Scholar]
- 3.Murray PJ. The JAK-STAT signaling pathway: input and output integration. J Immunol. 2007;178(5):2623–2629. doi: 10.4049/jimmunol.178.5.2623. [DOI] [PubMed] [Google Scholar]
- 4.AbbVie Inc. RINVOQ™ (upadacitinib extended-release tablets) [US package insert]. North Chicago, IL; 2022.
- 5.AbbVie. Rinvoq (upadacitinib) [summary of product characteristics]. Ludwigshafen, Germany: AbbVie Deutschland GmbH & Co. KG; 2021.
- 6.Mohamed MF, Zeng J, Marroum PJ, Song IH, Othman AA. Pharmacokinetics of upadacitinib with the clinical regimens of the extended-release formulation utilized in rheumatoid arthritis phase 3 trials. Clin Pharmacol Drug Dev. 2019;8(2):208–216. doi: 10.1002/cpdd.462. [DOI] [PMC free article] [PubMed] [Google Scholar]
- 7.Minocha M, Engelhardt B, Stodtmann S, Zhou W, Othman A. Exposure-Response Analyses of Upadacitinib (ABT-494) Efficacy in Subjects with Moderately to Severely Active Ulcerative Colitis-Analyses of a Phase 2 Dose Ranging Induction Study (P0347). In: United European Gastroenterology Week 2018; 21–24 October; Vienna, Austria: SAGE; 2018. p. A245.
- 8.Sandborn WJ, Ghosh S, Panes J, Schreiber S, D'Haens G, Tanida S, et al. Efficacy of upadacitinib in a randomized trial of patients with active ulcerative colitis. Gastroenterology. 2020;158(8):2139–49e14. doi: 10.1053/j.gastro.2020.02.030. [DOI] [PubMed] [Google Scholar]
- 9.Nader A, Mohamed MF, Winzenborg I, Doelger E, Noertersheuser P, Pangan AL, et al. Exposure-response analyses of upadacitinib efficacy and safety in phase II and III studies to support benefit-risk assessment in rheumatoid arthritis. Clin Pharmacol Ther. 2020;107(4):994–1003. doi: 10.1002/cpt.1671. [DOI] [PMC free article] [PubMed] [Google Scholar]
- 10.Mohamed MF, Klunder B, Othman AA. Clinical pharmacokinetics of upadacitinib: review of data relevant to the rheumatoid arthritis indication. Clin Pharmacokinet. 2020;59(5):531–544. doi: 10.1007/s40262-019-00855-0. [DOI] [PMC free article] [PubMed] [Google Scholar]
- 11.Mohamed MF, Klunder B, Lacerda AP, Othman AA. Exposure-response analyses for upadacitinib efficacy and safety in the Crohn's disease CELEST study and bridging to the extended-release formulation. Clin Pharmacol Ther. 2020;107(3):639–649. doi: 10.1002/cpt.1668. [DOI] [PMC free article] [PubMed] [Google Scholar]
- 12.Muensterman E, Engelhardt B, Gopalakrishnan S, Anderson JK, Mohamed MF. Upadacitinib pharmacokinetics and exposure-response analyses of efficacy and safety in psoriatic arthritis patients - Analyses of phase III clinical trials. Clin Transl Sci. 2022;15(1):267–278. doi: 10.1111/cts.13146. [DOI] [PMC free article] [PubMed] [Google Scholar]
- 13.Mohamed MF, Gopalakrishnan S, Teixeira HD, Othman AA. Exposure-response analyses for upadacitinib efficacy in subjects with atopic dermatitis-analyses of phase 2b study to support selection of phase 3 doses. J Clin Pharmacol. 2021;61(5):628–635. doi: 10.1002/jcph.1782. [DOI] [PMC free article] [PubMed] [Google Scholar]
- 14.Nader A, Stodtmann S, Friedel A, Mohamed MF, Othman AA. Pharmacokinetics of upadacitinib in healthy subjects and subjects with rheumatoid arthritis, Crohn's disease, ulcerative colitis, or atopic dermatitis: population analyses of phase 1 and 2 clinical trials. J Clin Pharmacol. 2020;60(4):528–539. doi: 10.1002/jcph.1550. [DOI] [PubMed] [Google Scholar]
- 15.Sandborn WJ, Su C, Panes J. Tofacitinib as Induction and Maintenance Therapy for Ulcerative Colitis. N Engl J Med. 2017;377(5):496–497. doi: 10.1056/NEJMc1707500. [DOI] [PubMed] [Google Scholar]
- 16.Ungaro R, Mehandru S, Allen PB, Peyrin-Biroulet L, Colombel JF. Ulcerative colitis. Lancet. 2017;389(10080):1756–1770. doi: 10.1016/S0140-6736(16)32126-2. [DOI] [PMC free article] [PubMed] [Google Scholar]
Associated Data
This section collects any data citations, data availability statements, or supplementary materials included in this article.


