

Abstract
Objective:
The current study investigated cognitive mechanisms underlying the ability to stop “autocorrect” errors elicited by unexpected words in a reading aloud task, and the utility of autocorrection for predicting Alzheimer’s disease (AD) biomarkers.
Method:
Cognitively normal participants (total n=85; n=64 with CSF biomarkers) read aloud six short paragraphs in which ten critical target words were replaced with autocorrect targets, e.g., The player who scored that final [paint] for the local team reported [him] experience. Autocorrect targets either replaced the most expected/dominant completion (i.e., point) or a less expected/nondominant completion (i.e., basket), and within each paragraph half of the autocorrect targets were content words (e.g., point/paint) and half were function words (e.g., his/him). Participants were instructed to avoid autocorrecting.
Results:
Participants produced more autocorrect errors in paragraphs with dominant than with nondominant targets, and with function than with content targets. Cognitively normal participants with high CSF Tau/Aβ42 (i.e., an AD-like biomarker profile) produced more autocorrect total errors than those below the Tau/Aβ42 threshold, an effect also significant with dominant-function targets alone (e.g., saying his instead of him). A logistic regression model with dominant-function errors and age showed errors as the stronger predictor of biomarker status (sensitivity 83%; specificity 85%).
Conclusions:
Difficulty stopping autocorrect errors is associated with biomarkers indicating preclinical AD, and reveals promise as a diagnostic tool. Greater vulnerability of function over content words to autocorrection in individuals with AD-like biomarkers implicates monitoring and attention (rather than semantic processing) in the earliest of cognitive changes associated with AD risk.
Keywords: reading aloud, biomarker, Alzheimer’s disease, CSF, speech errors, language impairment
Like many complex human behaviors, the ability to speak fluently is usually taken for granted. Spontaneous speech is produced at a rate of about 150 or more words/minute with only about 1-2 errors in every 1,000 words, all while being used in complex communicative exchanges in a variety of formats and contexts (Levelt, 1989). This high degree of fluency, accuracy and flexibility is quite remarkable given that during speech in natural settings each word must be selected rapidly from a lexicon of thousands of potentially competing candidates in concert with grammatical encoding needed to assemble a syntactic framework that outputs an ordered set of word forms and inflections. Additionally, speech and language production involves a complex coordination of multiple underlying cognitive skills including formulation of a message, lexical selection, planning of syntactic structure, and monitoring of planned speech to prevent errors prior to articulation.
Assessment of language is ubiquitous in neuropsychological evaluations. However, the focus is almost exclusively on retrieval of single words (e.g., picture naming, vocabulary, verbal fluency) with little attention paid to other aspects of language such as syntax and more complex language. Thus, the field of language assessment is ripe for development of new cognitive tests that might capitalize on the complexity of speech. These efforts have been hindered by challenges in eliciting, measuring and interpreting speech in a standardized manner in clinical settings. A useful method for eliciting fully connected speech in controlled laboratory settings is reading aloud of short paragraphs. This allows precise experimental control over what speakers say while engaging many of the cognitive mechanisms underlying spontaneous speech production (Gollan & Goldrick, 2018; MacDonald & Thornton, 2009; Moers et al., 2017).
Reading aloud reveals both pockets of preserved linguistic functioning and the presence of subtle cognitive impairments in Alzheimer’s disease (AD). An example is found in reports of a striking phenomenon in Spanish-English bilinguals with AD. When reading aloud short paragraphs written mostly in one language but with a small number of words switched to the other language, bilinguals spontaneously translated the written switch words to avoid producing language switches in their speech. These spontaneous translation “intrusion” errors occurred about 1% of the time overall, and more often (5-15%) when switch words were function words (Gollan et al., 2014; Gollan & Goldrick, 2018; Kolers, 1966). Interestingly, bilinguals with AD produced more of these language intrusion errors in the read-aloud task than matched healthy controls even though their production requires rapid and automatic translation of written switch words (Gollan et al., 2017; Gollan et al., 2020a).
A subsequent adaptation of the read aloud task with language switches revealed what seems to be a related phenomenon in monolinguals (Gollan et al., 2020b). Cognitively healthy older adult monolinguals read aloud short paragraphs in which a small number of words were replaced with malapropisms (i.e., words that are similar in form but not in meaning, producing a nonsensical utterance). For example, in a sentence like “Every day in the early morning hours the sunlight would barge through the window carton, waking Doug up…” the expected word curtain had been replaced with the target switch word carton. Participants were instructed to read aloud exactly what was written. Despite these instructions, participants were unable to stop themselves from producing the expected word (i.e., they “autocorrected” to curtain) instead of the written target word about 16% of the time. The rate of autocorrection errors was higher in individuals with greater risk for AD based on lower Aβ1-42 levels in CSF (i.e., a marker of greater accumulation of amyloid in their brains).
The results from Gollan and colleagues (Gollan et al., 2020b) suggest that autocorrection errors during the read aloud task may be a sensitive marker of early breakdown of language processes due to preclinical AD. However, the clinical utility of the task for detecting early AD-associated cognitive decline remains unknown. It may also be possible to increase the potential clinical utility of the read aloud task if replacement of some types of words (e.g., function words) is more sensitive to AD risk than replacement of other types of words (e.g., content words). Gollan and colleagues (Gollan et al., 2020b) found that autocorrection errors were significantly higher for target function words (as in “…today he planned to eat oats what banana slices” - where the expected function word with had been replaced by the autocorrect target what) than for target content words (e.g., carton/curtain). A similar part-of-speech effect was observed in the bilingual version of the task (Gollan et al., 2017; Gollan et al., 2020a) suggesting a common mechanism underlying errors in both tasks. Though the part-of-speech effect was robust in the monolingual version of the task, the correlation between autocorrection errors and Aβ1-42 levels in CSF appeared to be equally strong for function and content words (i.e., there was no interaction between part-of-speech and the AD biomarker). Further investigation is needed since content and function words differed in many uncontrolled factors in these studies, which could have affected the results (e.g., function words tend to be shorter, higher frequency, and more predictable than content words; Bell et al., 2009). Additional research on the part-of-speech effect could also shed light on cognitive mechanisms underlying changes in how connected speech is planned and produced in speakers with AD.
Gollan et al. (2020b) did not explore potential diagnostic utility of autocorrection errors nor whether autocorrection errors might be useful for classifying participants as biomarker positive versus negative. However, in the read-aloud study with bilingual participants, the difference in the rate of intrusion errors between bilinguals with AD and controls was smaller on function than on content words, but only if the content words were also cognates which are translation equivalents that are similar in form (e.g., reason/razón, family/familia) (Gollan et al., 2020a). By contrast, intrusions on noncognate content words were rare, but were excellent for discriminating patients from controls in an earlier study which did not examine switches on cognates or function words (Gollan et al., 2017). Receiver Operating Characteristic (ROC) curve analyses in the two studies with bilinguals showed that the read aloud task provided very good to excellent diagnostic accuracy for distinguishing patients with AD from controls, depending on the type of target word. Area under the curve (AUC) values ranged from .71-.92, sensitivity values from .75-1.00, and specificity values from .68-.86 for intrusion errors on function and cognate words in the later study (Gollan et al., 2020a) and noncognates in the dominant language in the earlier study (Gollan et al., 2017).
The current study was designed to further investigate the association between CSF biomarkers of AD and production of autocorrect errors with both content and function word targets during a read aloud task. Target word predictability was manipulated to determine if increased predictability of function words caused them to be more prone to autocorrect errors. If, after controlling for predictability, autocorrect errors on function word targets are more sensitive to differences in biomarker status than errors on content word targets, it would suggest that the earliest cognitive changes associated with AD pathology primarily reflect differences in monitoring and attentional control (which are notoriously difficult with function words; Schotter et al., 2019; Staub et al., 2019). Alternatively, if autocorrect errors on content word targets are more sensitive than errors on function word targets, changes in semantic processing would be implicated, because content words elicit relatively more semantic processing than function words.
Method
Participants
Participants were recruited from the UCSD Shiley-Marcos Alzheimer’s Disease Research Center (ADRC). Annual ADRC evaluations included detailed clinical and medical history, brief medical examination, neurological and neuropsychological assessments, screening for depression and other psychiatric symptoms, assessment of functional activities of daily living, and laboratory tests (including genotyping for APOE). At least two ADRC board-certified neurologists reviewed all information (in consultation with neuropsychologists) and classified each participant as cognitively normal or diagnosed them using current NIA-AA diagnostic criteria for AD (McKhann, et al., 2011), or published criteria for other neurodegenerative diseases with cognitive impairment (e.g., frontotemporal dementia, dementia with Lewy bodies). A subset of all the participants had lumbar puncture (LP) to obtain cerebrospinal fluid (CSF) for assessment of AD biomarkers. Information from the CSF analysis or from APOE genotyping was not used in the classification/diagnosis of participants. This research was approved by the UCSD Institutional Review Board.
Our study focused primarily on ADRC participants classified as cognitively normal for whom CSF AD biomarkers were available within 5 years of recruitment into the current study (n=64); unless otherwise stated, the analyses reported below included only these participants. An additional small sample of participants with probable AD (n=8) also completed the task and though the Figures illustrate their performance in dark grey, we excluded these participants from most statistical analyses to maintain focus on the utility of the autocorrect task for identifying individuals who are cognitively normal but at risk for developing AD based on CSF biomarkers. Finally, for our analysis of convergent validity (see Table 3) we included n=21 additional cognitively normal ADRC participants who completed the autocorrect task but did not contribute CSF biomarker data. Table 1 shows participant demographics and selected neuropsychological test data from the most contemporaneous ADRC evaluation (usually within one year of the current study) as a function of CSF AD biomarker status (i.e., biomarker+ or biomarker−). The selected tests included global screening measures (DRS, Mini-Mental State Exam), and sensitive standardized tests of memory (California Verbal Learning Test-II [CVLT-II], language (fluency), Multilingual Naming Test [MINT], and executive function (Trail Making Test Parts A and B, Delis-Kaplan Executive Function Color-Word Interference Test [CWIT]). All but one participant reported English as their native language1,and all but two cognitively normal participants exhibited English MINT scores within the normal range (Stasenko et al., 2019; Weintraub et al., 2018) with the vast majority at or close to ceiling on this proxy measure of English proficiency level (Gollan et al., 2012; Ivanova et al., 2013).
Table 3.
Spearman bivariate correlations between autocorrect errors, demographic variables, and neuropsychological scores among all participants who completed the autocorrect task (N=85)
| Variable | All errors | Function- dominant |
Function- nondominant |
Content- dominant |
Content- nondominant |
|---|---|---|---|---|---|
| Age | .216 * | .255 * | .122 | .060 | .146 |
| Education | −.113 | −.283 ** | .018 | .064 | .009 |
| DRS | −.105 | −.066 | −.009 | −.164 | −.170 |
| CVLT Trials 1-5 | −.036 | −.124 | .018 | −.062 | −.116 |
| CVLT LDFR | .034 | −.024 | .081 | .035 | −.148 |
| Trails A | .101 | .100 | .066 | −.034 | .051 |
| Trails B | .102 | .129 | .076 | .021 | .052 |
| Letter fluency | −.195 | −.087 | −.150 | −.159 | −.061 |
| Semantic fluency | −.123 | −.071 | −.010 | −.167 | −.044 |
| MINT | .040 | .068 | .166 | −.117 | −.013 |
| CWIT Inhibition | .352 *** | .293 ** | .202 | .102 | .300** |
| CWIT Inhibition errors | .224 * | .295 ** | .033 | .065 | .128 |
| CWIT Inhibition/Switching | .274 * | .273 * | .198 | −.039 | .223 * |
| CWIT Inhibition/Switching errors | .246 * | .125 | .141 | .274 * | .211 |
Note.
p < .001
p < .01
p < .05; significant correlations are bolded. DRS = Dementia Rating Scale; CVLT = California Verbal Learning Test; MINT = Multilingual Naming Test; CWIT = Color Word Interference Test
Table 1.
Demographics and test scores for biomarker positive vs. negative participants, and for all cognitively normal participants tested on the autocorrect task (collapsing those with and those without biomarker data).
| Participants with available biomarkers (n=64) |
All participants (n=85) | ||||||
|---|---|---|---|---|---|---|---|
| Biomarker + (n=14) |
Biomarker − (n=50) |
p-value | |||||
| Sex (Female/Male) | 7/7 | 26/24 | 1.00 | 46/39 | |||
| APOE-4 Status (+/−)a | 8/6 | 18/31 | .223 | 29/54 | |||
| Ethnicity (Non-Hispanic/Hispanic) | 14/0 | 49/1 | 1.00 | 82/3 | |||
| Race (White/Asian) | 13/1 | 50/0 | .219 | 84/1 | |||
| M | SD | M | SD | p-value | M | SD | |
| Age in years | 78.86 | 5.48 | 74.56 | 4.59 | .009 | 76.21 | 5.86 |
| Education level in years | 17.64 | 2.71 | 17.44 | 2.10 | .382 | 17.42 | 2.11 |
| MMSE (/30) | 29.43 | 0.76 | 29.28 | 1.42 | .703 | 29.36 | 1.17 |
| DRS (/144) | 139.57 | 4.33 | 139.70 | 2.94 | .725 | 139.80 | 3.09 |
| CVLT II Trials 1-5 | 49.79 | 10.36 | 51.48 | 9.22 | .708 | 51.13 | 10.03 |
| CVLT Long Delay Free Recall | 10.86 | 2.07 | 11.18 | 3.47 | .573 | 11.25 | 3.23 |
| Trails A | 35.50 | 9.31 | 28.66 | 7.08 | .009 | 30.94 | 9.00 |
| Trails B | 94.57 | 34.21 | 74.70 | 23.25 | .021 | 76.87 | 26.87 |
| Letter fluency (FAS) | 45.64 | 11.51 | 47.10 | 10.00 | .770 | 47.65 | 10.91 |
| Semantic fluencyb | 53.00 | 8.29 | 53.46 | 10.34 | .571 | 53.45 | 10.96 |
| MINT | 30.64 | 2.13 | 31.22 | 1.04 | .741 | 31.07 | 1.45 |
| CWIT Inhibition | 65.86 | 15.99 | 60.42 | 10.66 | .338 | 61.24 | 11.55 |
| CWIT Inhibition errors | 0.14 | 0.36 | 0.12 | 0.44 | .520 | 0.19 | 0.55 |
| CWIT Inhibition/Switching | 69.86 | 17.62 | 63.08 | 12.28 | .249 | 64.33 | 12.90 |
| CWIT Inhibition/Switching errors | 1.14 | 1.75 | 0.30 | 0.68 | .052 | 0.54 | 1.12 |
| Interval b/w LP and Autocorrectc | 41.71 | 17.47 | 33.82 | 14.05 | .139 | 35.55 | 15.08 |
| Interval b/w LP and NP testingc | 27.43 | 16.47 | 19.16 | 13.75 | .207 | -- | -- |
| Autocorrect Task | |||||||
| Function dominant | 4.50 | 2.14 | 2.74 | 1.66 | .003 | 3.16 | 1.92 |
| Function nondominant | 2.86 | 2.69 | 1.62 | 1.44 | .200 | 1.69 | 1.72 |
| Content dominant | 1.50 | 1.51 | 1.02 | 0.92 | .429 | 1.15 | 1.10 |
| Content nondominant | 1.36 | 1.74 | 0.70 | 0.97 | .203 | 0.87 | 1.18 |
| Self-corrected content words (%) | 30.1 | 31.5 | 30.1 | 34.9 | .515 | 28.5 | 32.9 |
| Self-corrected function words (%) | 31.4 | 20.2 | 28.0 | 25.9 | .959 | 28.8 | 25.0 |
| Paragraph reading time (sec) | 85.64 | 17.11 | 81.15 | 8.03 | .655 | 82.47 | 11.29 |
Note. Values for continuous variables are represented as means (standard deviation). Group differences significant at p < .05 are bolded based on a Mann Whitney U test for continuous variables and Fisher’s exact for categorical variables. MMSE = Mini-Mental State Examination; DRS = Dementia Rating Scale; CVLT = California Verbal Learning Test; MINT = Multilingual Naming Test (32 item UDS NACC version); CWIT = Color Word Interference Test; LP = lumbar puncture
Two participants had a missing value for APOE-4 status
Sum of animals, fruits, and vegetables
Interval expressed in months; NP = all cognitive tests other than the Autocorrect task
Materials
Autocorrect Task
Six paragraphs each with approximately 190 words (M=185, SD=24 words) were created, with each paragraph including autocorrect targets that replaced 5 content words and 5 function words. Autocorrect targets were words that resembled in written and phonological form either a highly expected (henceforth dominant) or a less expected (henceforth nondominant) completion in that context. Three of the paragraphs had autocorrect targets that resembled the dominant completions and 3 had autocorrect targets that resembled the nondominant completions.
Dominance had been determined in a pilot study by replacing the target words in each paragraph with blank spaces and asking 9 cognitively normal individuals (who did not participate in the current study) to read the paragraphs silently and fill in the missing words. Words generated by a majority of the normal individuals were considered dominant, and those generated by a minority were considered nondominant. On average, words used to create the dominant autocorrect targets were generated by 64.5% (SD=14.6) and 64.2% (SD=6.7; t<1) of individuals for content and function words, respectively. Words used to create the nondominant autocorrect targets were generated by 8.8% (SD=2.7) and 11.2% (SD=3.5; t=1.29, p=.22) of individuals for content and function words, respectively. An example paragraph with generated responses (dominant/nondominant) from the pilot study is shown below.
Dominant/nondominant words generated with the fill-in-the-blank pilot study:
The health of vulnerable citizens is receiving some attention. A new question doctors and nurses are asking patients is if/do they have enough food to eat. Public health officials/personnel say the answer often is "not really." So-called Food Insecurity has become a real concern among/with seniors. More than 5 million older Americans don't have enough food to lead a healthy life — a figure that has increased/grown in the last two decades. In response, food banks are increasingly meeting seniors where they/most get their health care, and hospitals are sending patients home with food. Organizers call it a food pharmacy, with patients receiving/getting a prescription for what to pick up. Some shelves have high-calorie foods for cancer patients to keep their weight up. Others have low-sugar foods/content for people with diabetes or low-sodium items for patients with hypertension. The pantry operates mostly on/from grant funding. The biggest/other challenge is keeping it fully stocked with important and/yet more expensive items like fresh produce and spices, which can be used to help patients keep some flavor while limiting salt in their diet.
Autocorrect target words were created for the dominant and non-dominant expected words in each of the six study paragraphs and substituted in the expected words’ place. Within each paragraph expected content and function target words were matched for predictability based on the pilot study results. Edit distance between expected words and autocorrect targets was 2.3 - 2.4 letters on average for all target types, except for dominant function targets which differed from the expected word by fewer letters (only 1.4 on average, all ps≤.02). Because of this difference, we repeated the analyses of item type when controlling for edit distance.
An example of a paragraph with the dominant and nondominant autocorrect targets (bolded dominant/nondominant) is shown below (e.g., the autocorrect target “of” replaced the dominant completion “if” in the second sentence). In this example, autocorrect target words are underlined and bolded for illustration purposes (a different font and spacing are also used); no words were underlined in materials shown to participants. In the actual study, each paragraph was presented in its entirety on a Power-point slide in black ink, using Calibri (Body) font size 16 with double line spacing.
Dominant/nondominant autocorrect targets:
The health of vulnerable citizens is receiving some attention. A new question doctors and nurses are asking patients is of/to they have enough food to eat. Public health offices/percentiles say the answer often is "not really." So-called Food Insecurity has become a real concern almost/within seniors. More than 5 million older Americans don't have enough food to lead a healthy life — a figure that has uncrossed/grain in the last two decades. In response, food banks are increasingly meeting seniors where the/more get their health care, and hospitals are sending patients home with food. Organizers call it a food pharmacy, with patients receding/guessing a prescription for what to pick up. Some shelves have high-calorie foods for cancer patients to keep their weight up. Others have low-sugar fads/constant for people with diabetes or low-sodium items for patients with hypertension. The pantry operates mostly an/few grant funding. The buckets/order challenge is keeping it fully stocked with important as/you more expensive items like fresh produce and spices, which can be used to help patients keep some flavor while limiting salt in their diet.
AD Biomarker Acquisition
Standard protocols were followed for assessment of AD biomarkers including pre-analytical preparation and storage of CSF and plasma (Vanderstichele et al., 2012; Xiao et al., 2017). In brief, CSF (20–30 mL) was collected by lumbar puncture in the early morning after overnight fasting. Samples were processed, aliquoted into 500 μL fractions in polypropylene microtubes, snap frozen and stored at −80°C until assayed. Levels of Aβ1-42 (Aβ42), Aβ1-40 (Aβ40), total Tau and phosphorylated tau (pTau) in CSF were analyzed using fully automated chemiluminescent assays (Lumipulse, Fujirebio, Belgium). The ratios of Aβ42/40 and pTau/Aβ42 were calculated. CSF samples were run blind to diagnosis. Biomarker threshold cutoffs (positive vs. negative) were derived as the optimal cut-points maximizing the Youden index (i.e. Sensitivity + Specificity – 1) from a ROC analysis of a larger data set of 140 patients clinically diagnosed with AD and 266 cognitively normal individuals (Galasko et al., 2019). Participants were divided into groups based on a Tau/Aβ42 threshold level with values above 0.609 classified as biomarker positive (AD biomarker+) and .609 or lower as biomarker negative (AD biomarker−).
Procedure
The paragraph reading task with autocorrect targets was administered as part of a remote evaluation carried out through interactive video (Zoom video telephone conferencing software) that included a brief interview to assess general health and well-being, evaluation of vision and hearing sufficient to see and hear the examiner clearly, a paragraph reading task (without autocorrect words) to assess naturalistic language production, and a brief “telephone” cognitive assessment (the T-Cog of the National Alzheimer’s Coordinating Center [NACC] Uniform Data Set [UDS]) that included tests of number span, category fluency, story recall, and a telephone version of the Montreal Cognitive Screening Assessment (T-MoCA). Participants were tested one-on-one on a tablet, laptop or personal computer with a screen size of at least 11 inches. To mitigate order effects, half of the participants completed the autocorrect task first, prior to the other components of the evaluation, and half completed the autocorrect task last, after the other components of the evaluation.
The six autocorrect paragraphs were presented in a fixed order (1-6) alternating between dominant and nondominant versions every other paragraph. Half of the participants began with a dominant version of paragraph 1 and half with a nondominant version of the same paragraph (i.e., dominance was counterbalanced across paragraphs and participants). Participants were instructed as follows: “In this task, you will be reading paragraphs aloud. Please read each paragraph as accurately as you can at a comfortable pace. You will notice that some of the words are not written correctly. Despite this, try to read them exactly as they are written. Do you have any questions?” A practice paragraph of about 100 words, with 2 content and 2 function words replaced by autocorrect targets, was presented before the test paragraphs. Participants then read aloud the 6 autocorrect task paragraphs. Participants’ reading was audio recorded for later scoring to ensure accuracy. The number of errors committed on each type of target word (function vs. content, dominant vs. nondominant) was scored.
Statistical Analysis
Mann-Whitney U and Fisher’s exact tests were used to examine group differences on demographic variables and cognitive measures. Given non-normal distribution of biomarker and some neuropsychological test values, Spearman rank correlations were used to test bivariate relationships between biomarker values and autocorrect errors (see Table 2), and between autocorrect errors and common standardized neuropsychological test scores (see Table 3). Given the exploratory nature of the correlations, no correction for multiple comparisons was applied. Generalized mixed effect models (using the ‘glmer function in R) were used to analyze the effects of biomarker (Tau/Aβ42 ratio; negative vs positive), paragraph type (dominant vs. nondominant), part of speech (function word vs. content word) and their interactions on the ability to predict autocorrect errors after controlling for age, sex, APOE ε4 status (presence/absence), education, Levenshtein edit distance2, target word length, paragraph reading times, and the interval between the testing on the autocorrect task and the date of biomarker sampling. Paragraph type and part of speech predictors were contrast coded (−.5 vs. .5). All continuous variables were centered and scaled (i.e., converted into z-scores). Participants and paragraphs were entered as random intercepts with related random slopes (i.e., paragraph type, part of speech, and their interaction for participants, and Tau/Aβ42 level for paragraphs). Significance was assessed via model comparisons (Barr, Levy, Scheepers, & Tily, 2013). Finally, logistic regressions and Receiver Operating Characteristic (ROC) curves were used to evaluate the ability of autocorrect errors to correctly classify participants as AD biomarker positive versus negative.
Table 2.
Spearman bivariate correlations between autocorrect errors and four CSF biomarkers (n=64)
| Variable | All errors |
Function- dominant |
Function- nondominant |
Content- dominant |
Content- nondominant |
|---|---|---|---|---|---|
| Tau | .265 * | .416*** | .093 | .088 | .201 |
| Aβ42 | −.106 | −.147 | −.039 | −.056 | .085 |
| Tau/Aβ42 | .251 * | .393 ** | .067 | .131 | .107 |
| Aβ42/40 | −.284 * | −.364 ** | −.188 | −.075 | −.084 |
Note.
p < .001
p < .01; significant correlations are bolded
Transparency and Openness
We follow Journal Article Reporting Standards (JARS; Kazak, 2018) and report how we determined our sample size, all data exclusions (if any), all manipulations, and all measures collected in the study. All study data, analysis code, and research materials are available at [https://osf.io/cnh9w/]. Data were analyzed using R version 4.0.3 (R Core Team, 2020) and the package lme4 version 1.1.26 (Bates et al., 2015). Study design and analyses were not pre-registered.
Results
Demographic and cognitive variables.
Cognitively normal participants with positive AD biomarker status were significantly older, and had slower performance on Trails A and B, and made marginally more errors on the CWIT Inhibition/Switching subtest, but otherwise did not differ significantly from those with negative biomarker status on any other demographic measures, neuropsychological tests, reading speed, or rate of self-correction of autocorrect errors (see the left side of Table 1).
Correlations with autocorrect errors.
Correlations between autocorrect errors and several biomarkers including total Tau level, Aβ42, and the Aβ42/40 and Tau/Aβ42 ratios are shown in Table 2. Total Tau level, the Tau/Aβ42 ratio, and the Aβ42/40 ratio were correlated with all autocorrect errors and with errors on function words in the dominant paragraphs. We focus on total Tau/Aβ42 in subsequent analyses given recent evidence of its utility for classifying individuals with Alzheimer’s pathology (Hansson et al., 2018). Table 3 shows correlations between autocorrect errors and other commonly used neuropsychological tests for discriminant validity. For these analyses we maximized power by including all participants tested on the autocorrect task including those with and those without biomarker data.
Generalized mixed effects models.
The results of our main analysis using a generalized mixed effects logistic regression are shown in Figure 1a with model results in Table 4. Participants made more autocorrect errors on function than on content words targets, a main effect of part of speech (M = 17.9% (SD = 11.5%) vs. 7.2% (SD = 6.83%); p < .001), and more autocorrect errors when reading dominant than non-dominant paragraphs, a main effect of paragraph type (M = 15.0% (SD = 8.49%) vs. 1.1% (SD = 9.28%); p < .001). Participants who were biomarker positive produced more autocorrect errors than participants who were biomarker negative, a main effect of the Tau/Aβ42 ratio (p = .013). Paragraphs with autocorrect targets on dominant function words appeared to be especially error prone in individuals with positive Tau/Aβ42 ratios (see Figure 1), but none of the interactions were significant (ps > .16). In addition to these main effects of primary interest, some of the control factors also produced significant results; males produced more errors than females (M = 13.2% (SD = 8.79%) vs. 10.2% (SD = 5.43%); p= .035), participants produced fewer errors on longer words (p = .017), and more errors on autocorrect targets with shorter edit distance from the expected word completions (p < .001). The main effects of edit distance and length are illustrated in Figures 1b-1c.
Figure 1a.
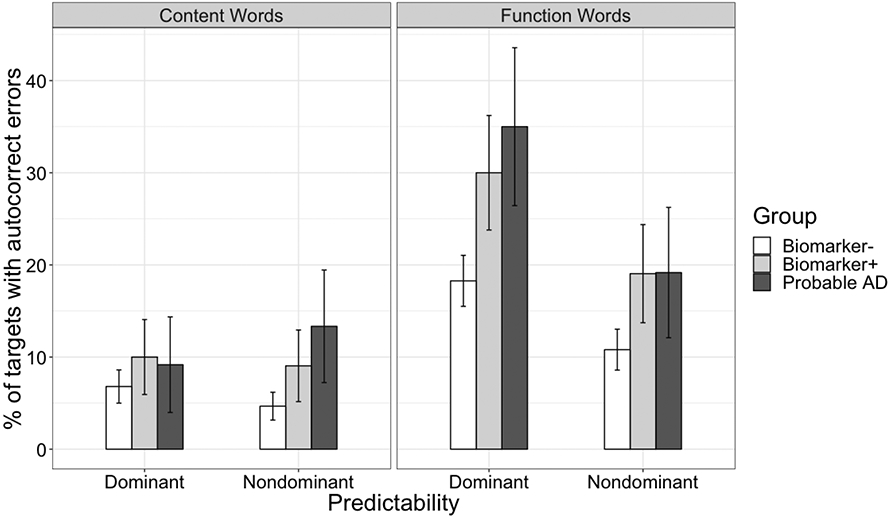
Percent of autocorrect targets that elicited autocorrect errors by part of speech, paragraph type, and Tau/Aβ42 ratio for cognitively normal participants who were biomarker negative (n=50), cognitively normal participants who were biomarker positive (n=14), and for illustrative purposes in a small group of participants with probable AD (n=8) who were not included in the main analysis (note: all but one participant with Probable AD was biomarker positive). Error bars refer to 95% confidence intervals.
Table 4.
Fixed effects from the generalized mixed-effects logistic regression model predicting autocorrect errors
| Word Type | Term | Beta | Std error | χ2 | p value |
|---|---|---|---|---|---|
| All target words collapsed | Intercept | −2.477 | 0.158 | 245.292 | <0.001 |
| Paragraph Type | 0.587 | 0.17 | 11.902 | <0.001 | |
| Part of Speech | 1.039 | 0.19 | 30.012 | <0.001 | |
| Tau/Aβ42 ratio | 0.601 | 0.243 | 6.12 | 0.013 | |
| Reading Times | −0.074 | 0.092 | 0.637 | 0.425 | |
| Interval between Biomarker & Autocorrect Task | −0.068 | 0.085 | 0.642 | 0.423 | |
| Age | 0.129 | 0.088 | 2.128 | 0.145 | |
| Sex = Male | −0.364 | 0.173 | 4.438 | 0.035 | |
| Education | −0.168 | 0.095 | 3.12 | 0.077 | |
| APOE-4 status = Absent | −0.195 | 0.184 | 1.127 | 0.288 | |
| Edit Distance | −1.047 | 0.107 | 95.072 | <0.001 | |
| Word Length | 0.205 | 0.086 | 5.731 | 0.017 | |
| Paragraph Type x Part of Speech | −0.443 | 0.318 | 1.943 | 0.163 | |
| Paragraph Type x Tau/Aβ42 ratio | −0.145 | 0.297 | 0.239 | 0.625 | |
| Part of Speech x Tau/Aβ42 ratio | 0.176 | 0.303 | 0.337 | 0.562 | |
| Paragraph Type x Part of Speech x Tau/Aβ42 ratio | 0.237 | 0.517 | 0.21 | 0.647 | |
| Dominant Function Words | Intercept | −1.845 | 0.294 | 39.257 | < .001 |
| Tau/Aβ42 ratio | 0.673 | 0.241 | 7.82 | 0.005 | |
| Reading Times | −0.181 | 0.129 | 1.974 | 0.160 | |
| Interval between Biomarker & Autocorrect Task | −0.12 | 0.094 | 1.621 | 0.203 | |
| Age | 0.189 | 0.099 | 3.666 | 0.056 | |
| Sex = Male | −0.382 | 0.195 | 3.826 | 0.050 | |
| Education | −0.275 | 0.103 | 7.169 | 0.007 | |
| APOE-4 status = Absent | −0.147 | 0.205 | 0.509 | 0.476 | |
| Edit Distance | −1.407 | 0.232 | 36.733 | < .001 | |
| Word Length | 0.524 | 0.166 | 9.937 | 0.002 a | |
| Dominant Content words | Intercept | −2.579 | 0.323 | 63.929 | < .001 |
| Tau/Aβ42 ratio | 0.724 | 0.442 | 2.684 | 0.101 | |
| Reading Times | 0.018 | 0.154 | 0.014 | 0.905 | |
| Interval between Biomarker & Autocorrect Task | 0.016 | 0.139 | 0.013 | 0.911 | |
| Age | −0.002 | 0.148 | 0 | 0.987 | |
| Sex = Male | −0.313 | 0.276 | 1.29 | 0.256 | |
| Education | 0.135 | 0.146 | 0.856 | 0.355 | |
| APOE-4 status = Absent | −0.275 | 0.295 | 0.874 | 0.350 | |
| Edit Distance | −0.814 | 0.231 | 12.411 | < .001 | |
| Word Length | 0.007 | 0.171 | 0.002 | 0.968 | |
| Nondominant Function Words | Intercept | −2.214 | 0.406 | 29.749 | < .001 |
| Tau/Aβ42 ratio | 0.52 | 0.352 | 2.187 | 0.139 | |
| Reading Times | 0.369 | 0.167 | 4.891 | 0.027 | |
| Interval between Biomarker & Autocorrect Task | −0.179 | 0.124 | 2.082 | 0.149 | |
| Age | 0.215 | 0.136 | 2.485 | 0.115 | |
| Sex = Male | −0.201 | 0.262 | 0.59 | 0.443 | |
| Education | 0.096 | 0.14 | 0.474 | 0.491 | |
| APOE-4 status = Absent | −0.514 | 0.276 | 3.47 | 0.062 | |
| Edit Distance | −1.021 | 0.228 | 20.092 | < .001 | |
| Word Length | 0.16 | 0.284 | 0.318 | 0.573 | |
| Nondominant Content Words | Intercept | −3.376 | 0.351 | 92.736 | < .001 |
| Tau/Aβ42 ratio | 0.803 | 0.505 | 2.527 | 0.112 | |
| Reading Times | 0.414 | 0.215 | 3.697 | 0.055 | |
| Interval between Biomarker & Autocorrect Task | −0.298 | 0.194 | 2.364 | 0.124 | |
| Age | 0.173 | 0.202 | 0.726 | 0.394 | |
| Sex = Male | −0.185 | 0.411 | 0.203 | 0.652 | |
| Education | −0.031 | 0.21 | 0.021 | 0.884 | |
| APOE-4 status = Absent | −0.564 | 0.427 | 1.742 | 0.187 | |
| Edit Distance | −1.122 | 0.287 | 15.308 | < .001 | |
| Word Length | 0.132 | 0.206 | 0.415 | 0.520 |
This effect was in the opposite direction as the overall length effect (shown in Figure 1c). However, after removing two long targets (though/through; always/around) the effect was no longer significant. We did not experimentally manipulate or control target word length or edit distance, as such these effects must be interpreted with caution.
Figure 1b.
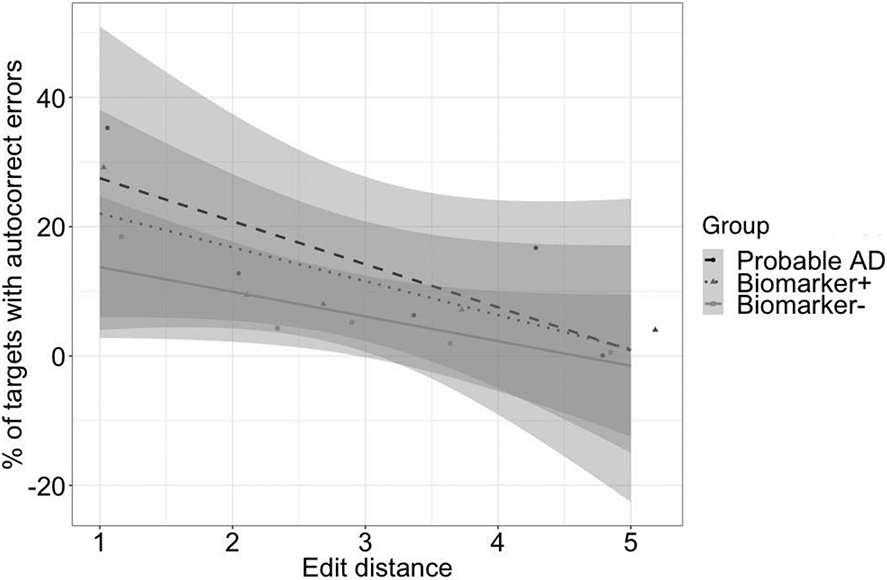
Percent of autocorrect errors for target words that differed by 1 to 5 letters from their expected completions for cognitively normal participants who were biomarker negative (n=50), cognitively normal participants who were biomarker positive (n=14), and for illustrative purposes in a small group of participants with probable AD (n=8) who were not included in the main analysis. Error bars refer to 95% confidence intervals around the best fitting regression line.
Figure 1c.
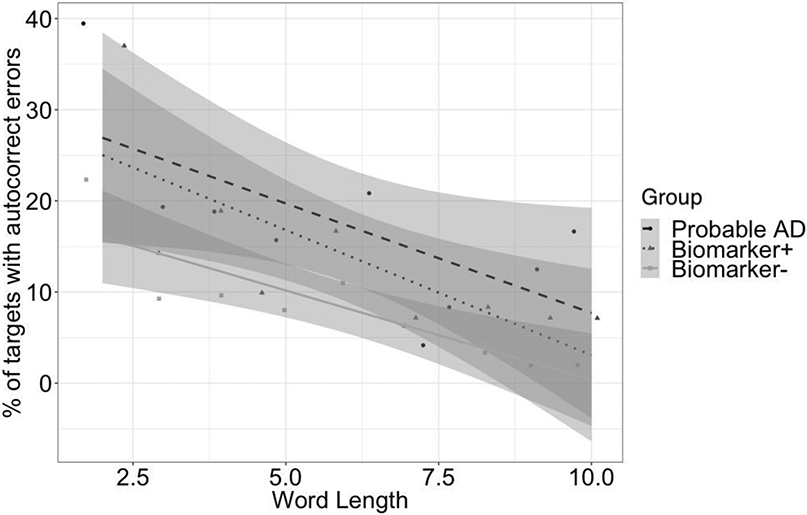
Percent of autocorrect errors for function word targets of different lengths in dominant paragraphs for cognitively normal participants who were biomarker negative (n=50), cognitively normal participants who were biomarker positive (n=14), and for illustrative purposes in a small group of participants with probable AD (n=8) who were not included in the main analysis. Error bars refer to 95% confidence intervals around the best fitting regression line.
Given our main aim to determine which types of autocorrect targets might be most sensitive to biomarkers, we further explored if the significant effects we observed generalized across the different types of targets (see bottom of Table 4). In these analyses, the main effect of Tau/Aβ42 was significant only on dominant function words (β = .673, SE β = .241, χ2= 7.820, p = .005), but not on the other three types of words (ps > .10). Similarly, the main effects of gender and word length were also significant only on dominant function words (ps < .05; though the latter effect was in the opposite direction as shown in Figure 1c and appeared to be driven by two relatively long and highly error prone autocorrect/expected target pars i.e., though/through and always/around), but not on all other types of words (ps > .25). By contrast, all four types of targets exhibited significant effects of edit distance (ps < .001). Finally, within dominant paragraphs (and overall), reading times had no significant effects, but in nondominant paragraphs, participants with slower reading times also tended to produce more autocorrect errors.
In light of previous results by Gollan et al. (2020b), we examined the interaction between age and the Tau/Aβ42 ratio (as a continuous variable) on production of autocorrect errors while controlling for sex, education, and APOE genotype. The interaction between age and the biomarker on autocorrect errors was not significant in a model with all target words (b = .07; SE = .07; χ2 =1.05. p = .307), not significant in a model with only dominant function word targets (b = .02; SE = .07; χ2 < 1), and also not significant when using total Tau or the Aβ42/Aβ40 ratio instead of the Tau/Aβ42 ratio (ps ≥ .31).
Diagnostic utility of autocorrect errors
Figure 2 shows ROC curves and areas under the curve (AUC) for autocorrect errors on function (A) or content (B) word targets, and for comparison on standard neuropsychological tests (C) of memory (CVLT learning), executive functions (CWIT inhibition), and a neuropsychological composite score (i.e., mean z-score of all tests listed in Table 3). The AUC was significant for autocorrect errors on function word targets in dominant paragraphs (AUC = .76; SE = .07; p = .003), but not for any of the other error types or for neuropsychological measures (ps > .05; Figure 2). A cut-off score of 3 or more function dominant errors achieved 71% sensitivity and 72% specificity.
Figure 2.

Receiver operating characteristic (ROC) curves classifying biomarker status (Tau/AB42 threshold) for 64 cognitively normal participants based on A) function errors, B) content errors, and C) selected neuropsychological tests
Note. ** p < .01; significant effects are bolded. AUC = Area Under the Curve; CI = confidence interval; CWIT = Color Word Interference Test; CVLT 1-5 = California Verbal Learning Test - Trials 1-5; NP = neuropsychological
To further examine potential diagnostic utility of autocorrect errors, we conducted binary logistic regressions (controlling for age) to examine if autocorrect errors could classify participants by biomarker status (i.e., positive or negative for AD pathology based on the Tau/Aβ42 ratio). A model including errors on function dominant word targets and age was significant (χ2 (1) = 14.51; p < .001; Nagelkerke R-square = .31) and correctly classified biomarker status in 84% of participants (sensitivity = 83%; specificity = 85%), with errors explaining unique variance over and above the effect of age (Wald χ(1)=5.45; p = .019; odds ratio = 1.59; 95% CI = [1.08, 2.35]. None of the other three error types significantly predicted biomarker status when considered along with age (all model ps ≥ .180).
We carried out additional simultaneous logistic regressions with errors on function dominant targets and any measure from Table 1 which showed marginally significant or significant differences between biomarker positive vs. negative groups. Controlling for age, both errors on function dominant words and performance on Trails A uniquely predicted biomarker status (function dominant errors: Wald χ(1) = 5.74; p = .017; odds ratio = 2.74; 95% CI of odds ratio = [1.20, 6.25]; Trails A: Wald χ(1) = 5.13; p = .024; odds ratio = 2.72; 95% CI of odds ratio = [1.14, 6.46]. When considered along with Trails B, only function dominant errors uniquely predicted biomarker status (Wald χ(1) = 4.81; p = .028; odds ratio = 2.44; 95% CI of odds ratio = [1.10, 5.42], and Trails B was marginally significant (Wald χ(1) = 3.41; p = .065; odds ratio = 1.90; 95% CI of odds ratio = [0.96, 3.77]). In a third model, function dominant errors were just significant (Wald χ(1) = 3.82; p = .051; odds ratio = 2.21; 95% CI of odds ratio = [1.00, 4.88], while Inhibition/Switch errors were marginally significant (Wald χ(1) = 3.13; p = .077; odds ratio = 2.01; 95% CI of odds ratio = [0.93, 4.34] as predictors of biomarker status. These analyses suggest that function dominant errors explain unique variance for predicting biomarker status in cognitively normal participants relative to other standardized neuropsychological measures on which our groups differed.
Examination of autocorrect errors in probable AD.
Finally, we explored whether participants with a diagnosis of probable AD would also overproduce autocorrect errors or if this phenomenon would be observed only in cognitively healthy participants. For this purpose, we compared 8 participants with AD to a case control matched3 subset of cognitively healthy control participants who were biomarker negative, and matched for age, years of education, and gender. Table 5 shows participant characteristics, and performance on a subset of the neuropsychological tests and the autocorrect task. Participants with probable AD produced more autocorrect errors than matched controls, thereby exhibiting a similar general pattern as already reported for biomarker positive participants. Additionally, there was some suggestion that participants with probable AD produced more autocorrect errors than matched controls in a more generalized manner across different types of autocorrect targets; the difference between groups was significant for both function dominant and content nondominant targets, and ROC curve analyses showed AUC values above .7 for all but one target type (i.e., function dominant AUC=.88; function nondominant AUC=.72; content dominant AUC=.59; content nondominant AUC=.75; all errors AUC=0.84). Though these data must be viewed as preliminary given the very small number of participants, they provide some evidence that at least in relatively early stages of dementia participants have more difficultly stopping themselves from producing autocorrections than controls. This evidence is also useful for pinpointing the cognitive mechanisms underlying autocorrection.
Table 5.
Demographic variables, means (SD) on commonly administered neuropsychological tests, and mean (SD) numbers of autocorrect errors produced by participants with Probable AD and case control matched cognitively normal and biomarker negative participants (four males and four females in each group).
| Normal & Biomarker − (n=8) |
Probable AD (n=8) | ||||
|---|---|---|---|---|---|
| M | SD | M | SD | p-value | |
| Age in years | 77.0 | 5.5 | 76.1 | 9.8 | .829 |
| Education level in years | 17.0 | 1.8 | 16.9 | 2.7 | .914 |
| DRS (/144) | 139.4 | 4.1 | 127.4 | 9.3 | .005 |
| CVLT II Trials 1-5 | 55.1 | 11.7 | 32.8 | 8.4 | <.001 |
| CVLT LDFR | 12.0 | 3 | 2.9 | 3.1 | <.001 |
| Letter Fluency (FAS) | 49.2 | 14.6 | 39.5 | 13.8 | .191 |
| Semantic Fluency | 52.1 | 7.0 | 29.4 | 13.5 | <.001 |
| MINT | 31.5 | 1.1 | 29.8 | 1.7 | .026 |
| Autocorrect task | |||||
| Function dominant | 2.1 | 1.1 | 5.3 | 2.4 | .005 |
| Function nondominant | 1.6 | 1.3 | 2.9 | 1.9 | .145 |
| Content dominant | 0.9 | 1.1 | 1.4 | 1.5 | .464 |
| Content nondominant | 0.5 | 0.5 | 2.0 | 1.9 | .045 |
| All Errors | 5.1 | 1.8 | 11.5 | 6.6 | .020 |
| Paragraph Reading Times | 82.4 | 9.1 | 89.9 | 14.5 | .240 |
Note:
p < .001
p < .01
p < .05 Group differences significant at p < .05 are bolded based on an independent samples t-test. DRS = Dementia Rating Scale; CVLT = California Verbal Learning Test; LDFR = Long Delay Free Recall; MINT = Multilingual Naming Test (32 item UDS NACC version); Semantic Fluency is the sum of Animals and Vegetables.
Discussion
The results of the present study revealed a number of key findings that replicate and build on previous research using the autocorrect task. First, replicating our previous study (Gollan et al., 2020b), cognitively healthy participants who may be at risk for AD based on CSF biomarkers produced more autocorrect errors when reading aloud than individuals not at risk, suggesting that increases in autocorrect errors can be observed in preclinical AD (and preliminary data with a small number of participants suggested the same may be true for individuals with probable AD). Critically, the present study also suggests that the autocorrect task might be useful in clinical settings and provide some guidance as to how to further develop the task to maximize its potential use for this purpose. Autocorrect errors, were good for making categorical discriminations between biomarker positive versus negative individuals, especially function word targets in paragraphs in which the autocorrect targets replaced the dominant expected completion word. Additionally, target words that were more similar to (i.e., with shorter edit distance from) their expected completions elicited more errors— this effect was highly robust for both parts of speech (function, content), and in both types of paragraphs (dominant, nondominant). We also observed target word length effects (shorter targets were more likely to elicit autocorrect errors than longer targets), and provided preliminary evidence on convergent and discriminant validity for the autocorrect task. Errors on function word targets in dominant paragraphs exhibited low-to-moderate correlations with CWIT Inhibition and Inhibition/Switching scores, showing convergent validity, but were not significantly correlated with test scores from other domains (e.g., memory, language), showing discriminant validity. Importantly, autocorrect errors appeared to be as sensitive as other neuropsychological test scores for identifying biomarker positive individuals (e.g., see Table 1; Figure 2), suggesting that the autocorrect task may be a useful addition to a cognitive assessment test battery.
Theoretical Implications and Potential Clinical Utility
Our replication of the correlation between AD biomarker levels and autocorrect errors increases confidence in the potential diagnostic utility of the task, and other aspects of the results we reported provide clues to underlying cognitive mechanisms. A priori, we did not know if AD risk should be associated with more or with fewer autocorrect errors since autocorrection requires interpretation of semantic context in a manner that leads expected target words to compete for selection during planning of speech for production. The lower rate of errors in paragraphs where autocorrect targets replaced less expected targets (i.e., the nondominant paragraphs) relative to when they replaced more expected targets (i.e., the dominant paragraphs) suggests that the ability to generate expectations from semantic context remains intact in preclinical AD. On the other hand, avoiding autocorrect errors requires the ability to control competition between the expected words and the written autocorrect targets – an ability that is impaired in individuals with more AD pathology. The task is less sensitive to AD biomarkers in nondominant than dominant paragraphs because the autocorrect target is similar to a less expected word and therefore elicits less robust response competition.
These results contribute additional evidence as to whether errors on function or content words are more sensitive to AD risk in reading aloud tasks. A priori we might have expected content words to exhibit greater sensitivity to AD given that memory for semantic content is sensitive for predicting who will eventually develop dementia (for review see Belleville et al., 2017; Han et al., 2017). Longitudinal studies also revealed subtle changes in semantic content of spontaneous language samples years before diagnosis of AD (e.g., lower idea density in written diaries of nuns; Snowdon et al., 1996; increased use of generic terms in picture description such as girl instead of sister/daughter in the Cookie Theft picture, Eyigoz et al., 2020, for review see Venneri et al, 2018), and language tests that require semantic processing (e.g., picture naming, semantic fluency, Papp et al., 2016) also accurately predict which individuals with MCI will convert to AD (on average 31 months later in a meta-analysis by Belleville et al., 2017).
While AD risk was associated with increased likelihood of autocorrection errors, it is unlikely that this is a consequence of diminished semantic processing since function word targets elicited more autocorrect errors than content word targets (see Figure 1), and function words better discriminated biomarker positive from negative individuals than content words (see Figure 2). Additionally, autocorrect errors were not significantly correlated with other semantic processing tasks (see Table 3), and participants with AD produced more autocorrect errors even though they likely had semantic deficits (see verbal fluency performance in Table 5). Instead, reading aloud may exploit points of convergence between relatively automatic syntactic processing vs. more attention demanding processes that are needed to monitor planned speech to avoid producing errors. These processes may be highly sensitive to AD biomarker levels even before the onset of clinical symptoms. While retrieval of function words relies less on semantic processing than retrieval of content words (and syntactic processing remains relatively intact in AD; Gollan et al., 2017; 2020), its ballistic nature makes monitoring to prevent production of errors more difficult (Schotter et al., 2019; Staub et al., 2019). In particular, the conflict between a highly expected function word and a formally similar autocorrect target is substantial and difficult to monitor. This interpretation fits with suggestions that attention and selection4 are more effective than semantic processing in identifying preclinical AD (as reviewed above, e.g., see Balota et al., 2010; Aschenbrenner et al., 2015). Consistent with the idea that executive control may be critical for preventing autocorrect errors, Table 1 shows significant differences between participants with positive vs. negative AD biomarkers on other executive control measures (Trails B), and the only neuropsychological test that was significantly correlated with autocorrect errors was the CWIT (Color Word Interference Test) – i.e., another measure of executive control.
Importantly, executive and attentional control tasks have also been identified as highly sensitive to AD pathology (e.g., Aschenbrenner et al., 2015; Susanto et al., 2015), and some have suggested that what appears to be a memory deficit could instead reflect decline in attentional control (e.g., Johnson et al., 2003 suggested lower story recall in AD is caused by diversion of attention from the episodic buffer to the task of producing speech; for possibly related work on the nature of deficits in story recall, see Mueller et al., 2020). In line with this view, the ability to control production of errors on incongruent trials in a computer administered version of the Stroop task was found to be more sensitive to prodromal AD than any one of 17 other most commonly used neuropsychological tests including memory tests (Balota et al., 2010; Hutchison et al., 2010). Though color words are content words, their repeated production out of syntactic context in the Stroop task likely changes the nature of their retrieval, perhaps implicating top-down intentional control more than semantic processing (Roelofs, 2021).
The deficits we observed on the autocorrect task in biomarker positive individuals (many of whom we assume have preclinical AD) are consistent with the early development of AD pathology in cortical areas and circuits critical for attentional control. One of the earliest areas of amyloid deposition in cognitively normal individuals with preclinical AD is the anterior cingulate cortex (ACC; Grothe et al., 2017), a brain region strongly implicated in attentional control (Shenhav et al., 2013). Amyloid deposition in the ACC may directly reduce the efficiency of attentional networks (Gordon et al., 2015), making the autocorrect task more sensitive to the effects of this pathology than traditional neuropsychological tests. Within this mechanistic framework, poor performance on the autocorrect task should be correlated with AD biomarkers, as we found, and is likely to be a harbinger of further cognitive decline due to AD that will eventually become apparent on standard cognitive tests. Consistent with this possibility, errors on similar attentional control tasks have been shown to predict conversion from cognitively normal to dementia in those with a positive biomarker of AD (Balota et al., 2010), and we observed similar patterns of deficits on the autocorrect task in biomarker positive participants as in those with mild dementia due to AD. Given how different the autocorrect task is from related tasks studied to date (e.g., Stroop, task-switching), these results suggest that it might be useful as a unique part of a composite battery of tests focused on attention that could be used to track neurodegenerative effects on cognition (Aschenbrenner et al., 2020).
Constraints on Generality and Study Limitations
Longitudinal studies will be needed to verify that the autocorrect task identifies individuals who eventually go on to develop AD. Herein, we assumed that because the production of autocorrect errors is associated with AD biomarker positivity (e.g., high Tau/AB42 ratio), it is a cognitive deficit that signals a significant impact of early AD pathology in brain regions important for attentional control. If this interpretation is correct, then autocorrect errors should be predictive of eventual development of dementia, particularly in the context of AD biomarker positivity (Dubois et al., 2021).
Additional work also will be needed to replicate the findings we reported with larger numbers of participants, and to determine how to maximize diagnostic sensitivity of the test. It is not known if the presence or proportion of different types of targets within each paragraph affects sensitivity to AD pathology reflected in CSF biomarkers. In the present study, we intermixed autocorrect content and function word targets in equal numbers within each paragraph and part-of-speech effects might have depended on this factor. Autocorrect errors could go up even further if only function word targets are replaced. Such a result would suggest that some of the test’s sensitivity to preclinical AD can be undermined by application of effortful attention. Note that participants produced errors on a minority of autocorrect targets, and though they self-corrected some of their errors (Table 1), most of the time they seemed not to notice the errors. Alternatively, paragraphs without function word targets could increase the sensitivity of autocorrect errors on content words to AD biomarkers, if only individuals with AD pathology have trouble monitoring such errors. Similar work is needed to further develop the bilingual version of the read aloud task with language switches. The strongest ROC results were found in previous studies when switches only occurred on noncognate content words (Gollan et al., 2017), but such switches did not discriminate patients from controls as well in a study in which half of the paragraphs had switches only on cognate and noncognate content words, while the other half of the paragraphs had switches only on function words (Gollan et al., 2020b).
Additional remaining questions concern apparent differences between the results of the present study and those of Gollan et al. (2020b). In the current study, total Tau level and the Tau/Aβ42 ratio best predicted autocorrect errors while in Gollan et al. (2020b) total Tau was not significantly correlated with autocorrect errors. This discrepancy could be due to different sensitivity in the assays used in the two studies (a fully automated Lumipulse assay (Fujirebio, Inc.) in the present study and an ELISA assay (ADx; Sutphen et al., 2015) in the previous study), or differences in study participants. Correlations between behavioral measures and either CSF Aβ42 or CSF Tau are common in the literature (Ibarra et al., 2021; Milà-Alomà et al., 2020). Finally, Gollan and colleagues reported that the oldest-old participants with the most AD-like biomarkers produced the most autocorrect errors (Gollan et al., 2020b). It is not known why we did not observe this interaction in the current study; many methodological differences between the two studies might have been critical. Perhaps most notably, only half the paragraphs in the present study had autocorrect targets that replaced the most expected completions.
Other limitations were that testing was done via ZOOM (due to COVID-19 restrictions), and our experimental manipulation of paragraph type likely reduced power to observe differential sensitivity of different types of autocorrect targets (e.g., each participant only completed 3 paragraphs with autocorrect targets replacing dominant expected completions). Additionally, our sample was predominantly White and most participants were highly educated. Thus, it is not known if autocorrect errors would be sensitive to AD pathology in more diverse participants with lower education level (but see possibly related effects in Spanish-English bilinguals with lower education level in Gollan et al., 2017; 2020a). Additional work with larger samples will be needed to explore the effects of gender (males produced more errors than females) and education level (individuals with lower education level produced marginally more errors). Finally, biomarkers were collected in closer proximity in time to the standard neuropsychological tests than to the autocorrect task (see Table 1). This could have affected which tests best predict AD biomarker levels, although, if anything, this should have biased in favor of neuropsychological tests administered closer in time to CSF collection. Overall, additional work will be needed to determine how to maximize the potential diagnostic utility of the autocorrect task, and the extent to which it will be useful in more diverse participants.
Conclusion
The autocorrect task is simple to perform, easy to administer, and exhibits promise as a diagnostic test for early, preclinical AD pathology. Most of the time participants read aloud fluently and did not even notice when they produced autocorrection errors (see self-correction rates in Table 1). Additional work is needed to determine which type of autocorrect target is most effective for detecting increased risk of AD in cognitively normal individuals. The autocorrect task will make a welcome addition to the neuropsychologist’s toolkit since it is sensitive to CSF biomarkers of AD pathology and measures a unique aspect of language that is seldom assessed in current standard practice.
Key Points:
Question:
This study investigated if it is possible to determine who might be at risk for Alzheimer’s disease using a simple reading-aloud task with an instruction to avoid correcting words that were written incorrectly (e.g., carton instead of curtain).
Findings:
Participants at risk for AD based on CSF biomarkers had more difficulty stopping themselves from autocorrecting misspelled words, especially if they were highly expected function words (e.g., this is not they word you were expecting).
Importance:
These results suggest that the earliest cognitive changes associated with AD pathology are primarily related to attentional control more than to semantic processing, and provide a novel psycholinguistic marker of AD risk.
Next Steps:
Additional work is needed to determine what types of paragraphs, and what types of target words best discriminate individuals who may be at greater risk for AD, and to follow participants longitudinally to confirm that individuals identified as at risk by this task are in fact more likely to eventually develop AD.
Acknowledgments
This research was supported by grants from the National Institute on Deafness and Other Communication Disorders (011492), by National Science Foundation Grant BCS1923065, and by a P30 (AG062429) from the National Institute of Aging to the University of California. A.S. was supported by an NRSA postdoctoral fellowship from the National Institute of Neurological Disorders and Stroke (F32NS119285). D.S.S. is supported by an NRSA predoctoral MD/PhD fellowship from the National Institute on Aging (F30-AG063440). Any opinions, findings, and conclusions or recommendations expressed in this material are those of the authors and do not necessarily reflect the views of the National Institutes of Health.
Data are publicly available at https://osf.io/cnh9w/
Footnotes
We have no conflicts of interest to disclose.
This information was missing for a few participants but all three had high English proficiency based on their English MINT scores, which were at or close to ceiling (i.e., 30, 31, and 32 out of a total possible score of 32).
Levenshtein distance between two words is the minimum number of single-character edits (insertions, deletions, or substitutions) required to change one word into the other.
Case control matching was done with SPSS v28, sampling without replacement, maximizing matching performance, and allowing for “fuzzy” matches.
Importantly, there was no evidence of speed-accuracy trade-offs. Overall, reading speed did not affect production of autocorrect errors, and also not in dominant paragraphs alone (see Table 4). Participants with slower reading times produced more errors in reading aloud the nondominant paragraphs, but these paragraphs were not good for classifying participants into biomarker positive versus negative groups.
References
- Aschenbrenner AJ, Balota DA, Fagan AM, Duchek JM, Benzinger TL, Morris JC (2015). Alzheimer Disease Cerebrospinal Fluid Biomarkers Moderate Baseline Differences and Predict Longitudinal Change in Attentional Control and Episodic Memory Composites in the Adult Children Study. Journal of the International Neuropsychological Society, 21(8), 573–83. doi: 10.1017/S1355617715000776. [DOI] [PMC free article] [PubMed] [Google Scholar]
- Aschenbrenner AJ, Gordon BA, Fagan AM, Schindler SE, Balota DA, Morris JC, Hassenstab JJ (2020). Neurofilament Light Predicts Decline in Attention but Not Episodic Memory in Preclinical Alzheimer's Disease. Journal of Alzheimer’s Disease, 74(4), 1119–1129. doi: 10.3233/JAD-200018. [DOI] [PMC free article] [PubMed] [Google Scholar]
- Balota DA, Tse CS, Hutchison KA, Spieler DH, Duchek JM, & Morris JC (2010). Predicting conversion to dementia of the Alzheimer’s type in a healthy control sample: The power of errors in Stroop color naming. Psychology and Aging, 25, 208–218. [DOI] [PMC free article] [PubMed] [Google Scholar]
- Barr DJ, Levy R, Scheepers C, & Tily HJ (2013). Random effects structure for confirmatory hypothesis testing: Keep it maximal. Journal of Memory and Language, 68(3), 255–278. 10.1016/j.jml.2012.11.001 [DOI] [PMC free article] [PubMed] [Google Scholar]
- Bates D, Mächler M, Bolker B, Walker S (2015). “Fitting Linear Mixed-Effects Models Using lme4.” Journal of Statistical Software, 67(1), 1–48. doi: 10.18637/jss.v067.i01. [DOI] [Google Scholar]
- Bell A, Brenier JM, Gregory M, Girand C, & Jurafsky D (2009). Predictability effects on durations of content and function words in conversational English. Journal of Memory and Language, 60, 92–111. 10.1016/j.jml.2008.06.003 [DOI] [Google Scholar]
- Belleville S, Fouquet C, Hudon C, Zomahoun H, Croteau J, & Consortium for the Early Identification of Alzheimer’s disease-Quebec (2017). Neuropsychological Measures that Predict Progression from Mild Cognitive Impairment to Alzheimer's type dementia in Older Adults: a Systematic Review and Meta-Analysis. Neuropsychology review, 27(4), 328–353. 10.1007/s11065-017-9361-5 [DOI] [PMC free article] [PubMed] [Google Scholar]
- Dubois B, Villain N, Frisoni GB, Rabinovici GD, Sabbagh M, Cappa S, Bejanin A, Bombois S, Epelbaum S, Teichmann M, Habert M, Nordberg A, Blennow K, Galasko D, Stern Y, Rowe CC, Salloway S, Schneider LS, Cummings JL, & Feldman HH (2021). Clinical diagnosis of Alzheimer's disease: recommendations of the International Working Group, The Lancet Neurology, 20(6), 484–496. doi.org/ 10.1016/S1474-4422(21)00066-1. [DOI] [PMC free article] [PubMed] [Google Scholar]
- Eyigoz E, Mathur S, Santamaria MT, Cecchi GA, & Naylor M (2020). Linguistic markers predict onset of Alzheimer's disease. EClinicalMedicine, 28. [DOI] [PMC free article] [PubMed] [Google Scholar]
- Galasko D, Xiao M, Xu D, Smirnov D, Salmon DP, Dewit N, Vanbrabant J, Jacobs D, Vanderstichele H, Vanmechelen E, Alzheimer's Disease Neuroimaging Initiative (ADNI), & Worley P (2019). Synaptic biomarkers in CSF aid in diagnosis, correlate with cognition and predict progression in MCI and Alzheimer's disease. Alzheimer's & dementia (New York, N. Y.), 5, 871–882. 10.1016/j [DOI] [PMC free article] [PubMed] [Google Scholar]
- Gollan TH, & Goldrick M (2018). A switch is not a switch: Syntactically-driven bilingual language control. Journal of Experimental Psychology. Learning, Memory, and Cognition, 44(1), 143–156. 10.1037/xlm0000462 [DOI] [PMC free article] [PubMed] [Google Scholar]
- Gollan TH, & Goldrick M (2019). Aging deficits in naturalistic speech production and monitoring revealed through reading aloud. Psychology and Aging, 34(1), 25–42. 10.1037/pag0000296 [DOI] [PMC free article] [PubMed] [Google Scholar]
- Gollan TH, Schotter ER, Gomez J, Murillo M, Rayner K (2014). Multiple levels of bilingual language control: Evidence from language intrusions in reading aloud. Psychological Science, 25, 585–595. [DOI] [PMC free article] [PubMed] [Google Scholar]
- Gollan TH, Stasenko A, Li C, & Salmon DP (2017). Bilingual language intrusions and other speech errors in Alzheimer’s disease. Brain & Cognition, 118, 27–44. [DOI] [PMC free article] [PubMed] [Google Scholar]
- Gollan TH, Li C, Stasenko A, & Salmon DP (2020a). Intact reversed language-dominance but exaggerated cognate effects in reading aloud of language switches in bilingual Alzheimer’s disease. Neuropsychology, 34, 88–106. [DOI] [PMC free article] [PubMed] [Google Scholar]
- Gollan TH, Smirnov DS, Salmon DP, & Galasko D (2020b). Failure to stop autocorrect errors in reading aloud increases with aging especially with a positive marker for Alzheimer’s disease. Psychology & Aging, 35, 1016–1025. [DOI] [PMC free article] [PubMed] [Google Scholar]
- Gollan TH, Weissberger GH, Runnqvist E, Montoya RI, & Cera CM (2012). Self-ratings of Spoken Language Dominance: A Multi-Lingual Naming Test (MINT) and Preliminary Norms for Young and Aging Spanish-English Bilinguals. Bilingualism: Language and Cognition, 15(3), 594–615. 10.1017/S1366728911000332 [DOI] [PMC free article] [PubMed] [Google Scholar]
- Gordon BA, Zacks JM, Blazey T, Benzinger TLS, Morris JC, Fagan AM, Holtzman DM, Balota DA (2015). Task-evoked fMRI Changes in Attention Networks are Associated with Preclinical Alzheimer Disease Biomarkers, Neurobiology of Aging (2015), doi: 10.1016/j.neurobiolaging.2015.01.019. [DOI] [PMC free article] [PubMed] [Google Scholar]
- Grothe MJ, Barthel H, Sepulcre J, Dyrba M, Sabri O, Teipel SJ (2017). In vivo staging of regional amyloid deposition. For the Alzheimer's Disease Neuroimaging Initiative Neurology, 89 (20), 2031–2038, DOI: 10.1212/WNL.0000000000004643 [DOI] [PMC free article] [PubMed] [Google Scholar]
- Han SD, Nguyen CP, Stricker NH, & Nation DA (2017). Detectable neuropsychological differences in early preclinical Alzheimer's disease: A meta-analysis. Neuropsychology Review. 10.1007/s11065-017-9345-5. [DOI] [PMC free article] [PubMed] [Google Scholar]
- Hansson O, Seibyl J, Stomrud E, Zetterberg H, Trojanowski JQ, Bittner T, Lifke V, Corradini V, Eichenlaub U, Batrla R, Buck K, Zink K, Rabe C, Blennow K, Shaw LM, Swedish BioFINDER study group, & Alzheimer's Disease Neuroimaging Initiative (2018). CSF biomarkers of Alzheimer's disease concord with amyloid-β PET and predict clinical progression: A study of fully automated immunoassays in BioFINDER and ADNI cohorts. Alzheimer's & dementia : the journal of the Alzheimer's Association, 14(11), 1470–1481. 10.1016/j.jalz.2018.01.010 [DOI] [PMC free article] [PubMed] [Google Scholar]
- Hutchison KA, Balota DA, & Duchek JM (2010). The utility of Stroop task switching as a marker for early-stage Alzheimer's disease. Psychology & Aging, 25, 545–559. doi: 10.1037/a0018498. [DOI] [PMC free article] [PubMed] [Google Scholar]
- Ibarra R, Radanovic M, Pais MV, Talib LL, & Forlenza OV (2021). AD-Related CSF Biomarkers Across Distinct Levels of Cognitive Impairment: Correlations With Global Cognitive State. Journal of Geriatric Psychiatry and Neurology, 34(6), 659–667. 10.1177/0891988720944237 [DOI] [PubMed] [Google Scholar]
- Ivanova I, Salmon DP, & Gollan TH (2013). The Multilingual Naming Test in Alzheimer’s Disease: Clues to the Origin of Naming Impairments. Journal of the International Neuropsychological Society : JINS, 19(3), 272–283. 10.1017/S1355617712001282 [DOI] [PMC free article] [PubMed] [Google Scholar]
- Johnson DK, Storandt M, & Balota DA (2003). Discourse analysis of logical memory recall in normal aging and in dementia of the Alzheimer type. Neuropsychology, 17(1), 82–92. 10.1037/0894-4105.17.1.82 [DOI] [PubMed] [Google Scholar]
- Kazak AE (2018). Editorial: Journal article reporting standards. American Psychologist, 73(1), 1–2. [DOI] [PubMed] [Google Scholar]
- Kolers PA (1966). Reading and talking bilingually. The American Journal of Psychology, 79, 357–376. [PubMed] [Google Scholar]
- Levelt WJM (1989). Speaking: From intention to articulation. Boston, MA: MIT Press. [Google Scholar]
- MacDonald MC, & Thornton R (2009). When language comprehension reflects production constraints: Resolving ambiguities with the help of past experience. Memory & Cognition, 37, 1177–1186. [DOI] [PMC free article] [PubMed] [Google Scholar]
- McKhann GM, Knopman DS, Chertkow H, Hyman BT, Jack CR Jr, Kawas CH, Klunk WE, Koroshetz WJ, Manly JJ, Mayeux R, Mohs RC, Morris JC, Rossor MN, Scheltens P, Carrillo MC, Thies B, Weintraub S, & Phelps CH (2011). The diagnosis of dementia due to Alzheimer's disease: recommendations from the National Institute on Aging-Alzheimer's Association workgroups on diagnostic guidelines for Alzheimer's disease. Alzheimer's & dementia: the journal of the Alzheimer's Association, 7(3), 263–269. [DOI] [PMC free article] [PubMed] [Google Scholar]
- Milà-Alomà M, Salvadó G, Gispert JD, Vilor-Tejedor N, Grau-Rivera O, Sala-Vila A, Sánchez-Benavides G, Arenaza-Urquijo EM, Crous-Bou M, González-de-Echávarri JM, Minguillon C, Fauria K, Simon M, Kollmorgen G, Zetterberg H, Blennow K, Suárez-Calvet M, Molinuevo JL, & ALFA study (2020). Amyloid beta, tau, synaptic, neurodegeneration, and glial biomarkers in the preclinical stage of the Alzheimer's continuum. Alzheimer's & Dementia: the journal of the Alzheimer's Association, 16(10), 1358–1371. 10.1002/alz.12131 [DOI] [PMC free article] [PubMed] [Google Scholar]
- Moers C, Meyer A, & Janse E (2017). Effects of Word Frequency and Transitional Probability on Word Reading Durations of Younger and Older Speakers. Language and Speech, 60(2), 289–317. [DOI] [PubMed] [Google Scholar]
- Mueller KD, Koscik RL, Du L, Bruno D, Jonaitis EM, Koscik AZ, Christian BT, Betthauser TJ, Chin NA, Hermann BP, & Johnson SC (2020). Proper names from story recall are associated with beta-amyloid in cognitively unimpaired adults at risk for Alzheimer's disease, Cortex, 131, 137–150. 10.1016/j.cortex.2020.07.008. [DOI] [PMC free article] [PubMed] [Google Scholar]
- Papp KV, Mormino EC, Amariglio RE, Munro C, Dagley A, Schultz AP, Johnson KA, Sperling RA, & Rentz DM (2016). Biomarker validation of a decline in semantic processing in preclinical Alzheimer’s disease. Neuropsychology, 30(5), 624–63. https://doi.org/1.1037/neu0000246 [DOI] [PMC free article] [PubMed] [Google Scholar]
- Roelofs A (2021, February 1). How Attention Controls Naming: Lessons From Wundt 2.0. Journal of Experimental Psychology: General. 10.1037/xge0001030 [DOI] [PubMed] [Google Scholar]
- van der Kall LM, Truong T, Burnham SC, Doré V, Mulligan RS, Bozinovski S, Lamb F, Bourgeat P, Fripp J, Schultz S, Lim YY, Laws SM, Ames D, Fowler C, Rainey-Smith SR, Martins RN, Salvado O, Robertson J, Maruff P, Masters CL, Villemagne VL, & Rowe CC (2021). Association of β-Amyloid Level, Clinical Progression, and Longitudinal Cognitive Change in Normal Older Individuals Neurology 96 (5) e662–e670; DOI: 10.1212/WNL.0000000000011222 [DOI] [PMC free article] [PubMed] [Google Scholar]
- Vanderstichele H, Bibl M, Engelborghs S, Le Bastard N, Lewczuk P, Molinuevo JL, Parnetti L, Perret-Liaudet A, Shaw LM, Teunissen C, Wouters D, & Blennow K (2012). Standardization of preanalytical aspects of cerebrospinal fluid biomarker testing for Alzheimer’s disease diagnosis: A consensus paper from the Alzheimer’s Biomarkers Standardization Initiative. Alzheimer’s & Dementia: The Journal of the Alzheimer’s Association, 8(1), 65–73. 10.1016/j.jalz.2011.07.004 [DOI] [PubMed] [Google Scholar]
- R Core Team (2020). R: A language and environment for statistical computing. Foundation for Statistical Computing, Vienna, Austria. URL https://www.R-project.org/ [Google Scholar]
- Schotter L, Li C, & Gollan TH (2019). What reading aloud reveals about speaking: Regressive saccades implicate a failure to monitor, not inattention, in the prevalence of intrusion errors on function words. Quarterly Journal of Experimental Psychology, 72, 2032–2045. [DOI] [PMC free article] [PubMed] [Google Scholar]
- Shenhav A, Botvinick MM, & Cohen JD (2013). The expected value of control: an integrative theory of anterior cingulate cortex function. Neuron, 79(2), 217–240. 10.1016/j.neuron.2013.07.007 [DOI] [PMC free article] [PubMed] [Google Scholar]
- Snowdon DA, Kemper SJ, Mortimer JA, Greiner LH, Wekstein DR, & Markesbery WR (1996). Linguistic ability in early life and cognitive function and Alzheimer’s disease in late life: Findings from the Nun Study. JAMA, 275(7), 528–532. doi: 10.1001/jama.1996.03530310034029 [DOI] [PubMed] [Google Scholar]
- Stasenko A, Jacobs DM, Salmon DP, & Gollan TH (2019). The Multilingual Naming Test (MINT) as a measure of picture naming ability in Alzheimer’s disease. Journal of the International Neuropsychological Society, 25(8), 821–833. 10.1017/S1355617719000560 [DOI] [PMC free article] [PubMed] [Google Scholar]
- Staub A, Dodge S, & Cohen. A. (2019). Failure to notice function word repetitions and omissions in reading: Are eye movements to blame? Psychonomic Bulletin & Review, 26, 340–346 [DOI] [PubMed] [Google Scholar]
- Susanto TA, Pua EP, & Zhou J (2015). Cognition, brain atrophy, and cerebrospinal fluid biomarkers changes from preclinical to dementia stage of Alzheimer's disease and the influence of apolipoprotein E. Journal of Alzheimer’s Disease, 45(1), 253–268. [DOI] [PubMed] [Google Scholar]
- Sutphen CL, Jasielec MS, Shah AR, Macy EM, Xiong C, Vlassenko AG, Benzinger TL, Stoops EE, Vanderstichele HM, Brix B, Darby HD, Vandijck ML, Ladenson JH, Morris JC, Holtzman DM, & Fagan AM (2015). Longitudinal cerebrospinal fluid biomarker changes in preclinical Alzheimer disease during middle age. JAMA Neurol, 72(9), 1029–1042. 10.1001/jamaneurol.2015.1285 [DOI] [PMC free article] [PubMed] [Google Scholar]
- Venneri A, Jahn-Carta C, Marco MD, Quaranta D, & Marra C (2018). Diagnostic and prognostic role of s disease. Biomarkers in Medicine, 12(6), 637–651. doi.org/ 10.2217/bmm-2017-0324 [DOI] [PubMed] [Google Scholar]
- Weintraub S, Besser L, Dodge HH, Teylan M, Ferris S, Goldstein FC, Giordani B, Kramer J, Loewenstein D, Marson D, Mungas D, Salmon D, Welsh-Bohmer K, Zhou XH, Shirk SD, Atri A, Kukull WA, Phelps C, & Morris JC (2018). Version 3 of the Alzheimer Disease Centers' Neuropsychological Test Battery in the Uniform Data Set (UDS). Alzheimer disease and associated disorders, 32(1), 10–17. 10.1097/WAD.0000000000000223 [DOI] [PMC free article] [PubMed] [Google Scholar]
- Xiao M-F, Xu D, Craig MT, Pelkey KA, Chien C-C, Shi Y, Zhang J, Resnick S, Pletnikova O, Salmon DP, Brewer J, Edland S, Wegiel J, Tycko B, Savonenko A, Reeves RH, Toncoso JC, McBain CJ, Galasko D, Worley PF (2017). NPTX2 and cognitive dysfunction in Alzheimer’s Disease. ELife, 6. 10.7554/eLife.23798 [DOI] [PMC free article] [PubMed] [Google Scholar]