Abstract
Several limitations of [18F]FDG have been reported, such as nonspecific uptake of inflammation foci. Moreover, [11C]MET has been found to accumulate in normal and inflammatory tissues as well as tumors. To increase specificity to tumor tissues, PET probes with tumor-specific molecular targets have been actively developed. [18F]FIMP was found to be highly accumulated in LAT1-positive tumors but not in inflamed tissue. The aim of this study was to explore whether [18F]FIMP can be used for the early-phase evaluation of radiotherapy accompanied by inflammation, and compare its effectiveness with those of [11C]MET and [18F]FDG. Tumor uptake of [18F]FIMP decreased at day 1 after irradiation, and remained low until day 14. Comparatively, that of [18F]FDG initially decreased at day 3 but was transiently elevated at day 7 and then decreased again at day 10. Decreased tumor uptake of [11C]MET was observed at day 10. In line with the uptake of [18F]FIMP, the ratio of Ki-67 immuno-positive cells in tumor tissues significantly decreased at day 1, 7, and 10 as compared with that in the control. These findings suggest that [18F]FIMP may be a PET probe involved in the early detection and prediction of radiotherapy efficacy, although further clarification is needed.
Subject terms: Cancer imaging, Radiotherapy
Introduction
Radiotherapy is used to treat a wide variety of cancers with more than 50% of all cancer patients1. Detection of anatomical changes using computed tomography (CT) and magnetic resonance imaging (MRI) after radiotherapy has commonly been used for evaluation of the therapeutic effect. The current clinical standard for assessing responses to treatment is to determine the reduction in tumor size by CT and/or MRI using the response evaluation criteria in solid tumors (RECIST) clinical guideline2. However, changes in tumor size have been found to be very slow requiring several weeks or months after radiotherapy3. Moreover, RECIST criteria focus only on reducing tumor size4 and not necessarily correlating the result with patient survival5–7.
Chemo- and radio-therapy bring about biochemical changes in tumor tissues which occur before the size reduction of tumor. It can be determined by highly sensitive PET, not CT or MRI. Recently, novel clinical criteria have been proposed for assessing tumor volume change including biological information obtained from PET imaging of glucose metabolism using 2-deoxy-2-[18F]fluoro-D-glucose (FDG), called PET response criteria in solid tumors (PERCIST)2. However, [18F]FDG is actively transported into cells via glucose transporters, which are expressed not only in tumor tissue but also in inflammatory foci, where they regulate glucose metabolism to promote inflammatory responses8,9. Glucose transporters are also expressed in cells of the central nervous system, which limits imaging of brain tumors10. Hence, [18F]FDG PET cannot distinguish between tumor tissue and inflamed lesions11, and therefore results in false-positives for tumor diagnosis12.
To overcome the disadvantages of [18F]FDG, radiolabeled amino acid PET probes such as L-[methyl-11C]methionine (MET) were developed13. MET is a natural analogue of methionine that is incorporated into proteins, and its incorporation probably suggests enhanced protein synthesis and is useful in predicting the histologic grade of astrocytoma14. However, [11C]MET has been found to accumulate in normal and inflammatory tissues as well as tumors15–17. To increase specificity to tumor tissues, PET probes with tumor-specific molecular targets have been actively developed.
L-type amino acid transporter 1 (LAT1) is one of the sodium-independent L-type amino acid transporters18. LAT1 is highly expressed in a variety of human tumors and is a promising target for both imaging and therapy19. Several PET probes targeting LAT1 have been reported, including [18F]fluoro-ethyl-tyrosine (FET)20, and 3-[18F]fluoro-α-methyl-L-tyrosine (FAMT)21. However, none of them are widely used, probably because the signal/noise ratio is not sufficient.
Recently, we also designed and synthesized a novel α-methyl-L-phenylalanine derivative to specifically target LAT1, (S)-2-amino-3-[3-(2-[18F]fluoroethoxy)-4-iodophenyl]-2-methylpropanoic acid ([18F]FIMP). [18F]FIMP showed high accumulation in the tumor tissues and low accumulation in inflamed tissues in tumor-bearing mice22 and the patient with glioblastoma23.
Radiotherapy mainly elicited strong inflammation, which sometimes gave false positive results with [18F]FDG. Since LAT1 is a tumor-specific transporter, our LAT1-targeted [18F]FIMP may be able to correctly assess the effects of radiotherapy.
Here, we aimed to determine whether [18F]FIMP, after reduced accumulation in inflamed tissues, is useful for evaluating the effect of radiation treatment compared to the conventional PET probes [11C]MET and [18F]FDG.
Results
Time-dependent change of tumor volume after irradiation
The tumor volume in the control group was found to progressively increase until 31 days as compared with the irradiated group [control group, 903.9 ± 163.6; irradiated group, 24.6 ± 15.0 percent changes from pre-irradiation volume (%dVol.)]. However, the tumor volume in the irradiated group did not show a significant decrease until the 7th day after irradiation (control group, 155.1 ± 11.4; irradiated group, 164.1 ± 35.1%dVol.) and significantly decreased from the 8th day after irradiation (control group, 223.6 ± 17.4; irradiated group, 132.2 ± 25.8%dVol.) compared to controls (Fig. 1).
Figure 1.
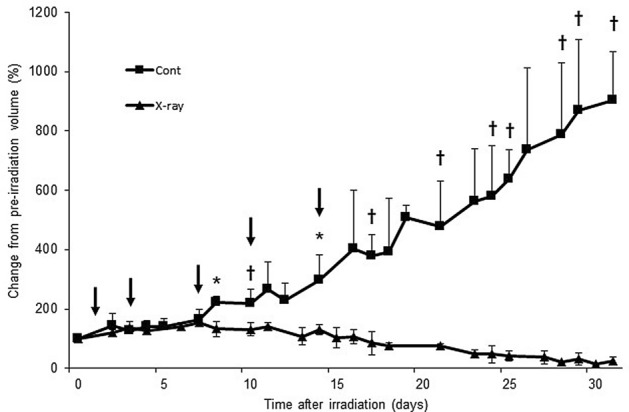
Time-dependent change in tumor volume of LNZ308 tumors after irradiation. Tumors on right paws were irradiated on day 0 at a dose of 60 Gy. Each point represents mean ± SD of the change from pre-irradiation tumor volume (n = 4–6). Probe uptake studies were performed on days 1, 3, 7, 10, and 14 after irradiation, as indicated by arrows. *p < 0.05 and †p < 0.01, as compared with control.
In a comparison of before and after irradiation, the tumor volume in the control group significantly increased from day 7 (164.1 ± 35.1%dVol.) as compared with pre-irradiation (day 0). However, the tumor volume in the irradiated group significantly increased initially until day 11 (139.3 ± 13.4%dVol.), and thereafter it significantly decreased from day 18 (77.1 ± 8.8%dVol.) as compared with pre-irradiation (day 0) (Fig. 1).
Histological changes in the tumor tissue after irradiation
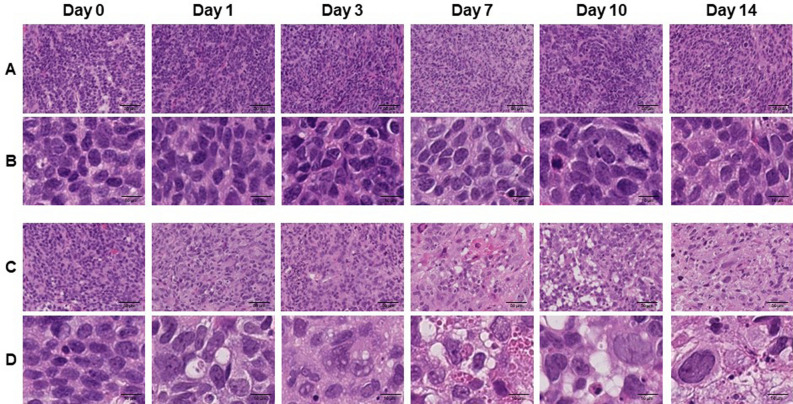
To confirm irradiation-associated changes in tumor tissue, a section of the tumor tissue was stained by H.E. (Fig. 2). Although, time-dependent change was not observed in control tissue, several characteristic changes related to cell death were observed in the irradiated tissue such as nuclear and cytoplasmic vacuolization (day 1 and 3), pyknosis and infiltration of inflammatory cells (day 7), foamy cytoplasm and swelling of nuclei (day 10), and infiltration of fibroblast (day 14) (Fig. 2).
Figure 2.
Hematoxylin and Eosin (HE) stained sections of LNZ308 tumors after irradiation. Tumors on right paws were irradiated on day 0 at the dose of 0 Gy (A and B) or 60 Gy (C and D). Photomicrographs of low (A and C) and high (B and D) magnification show HE stained tumor sections at days 0, 1, 3, 7, 10, and 14 after irradiation (N = 1 each treatment group).
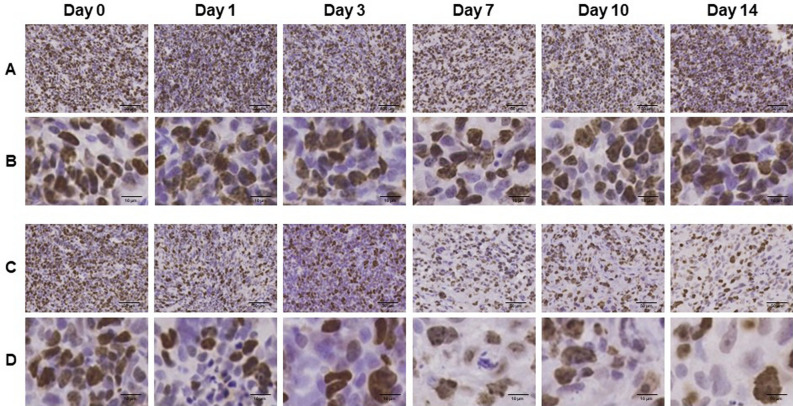
To confirm irradiation-associated changes in cell proliferation, sections of tumor tissues were stained with anti-Ki-67 antibody (Fig. 3). Ki-67 immunoreactivities decreased in a time-dependent manner after irradiation. Semi-quantitative analysis of immunohistochemical expression of Ki-67 in LNZ308 tumors after irradiation was performed (Fig. 4). The ratio of Ki-67 immuno-positive cells was significantly decreased at days 1, 7, and 10 after irradiation compared to that in the control.
Figure 3.
Ki-67 immunohistochemically stained sections of LNZ308 tumors after irradiation. The cell proliferation antigen Ki-67 was used as a marker of cell proliferation. Tumors on right paws were irradiated on day 0 at the dose of 0 Gy (A and B) or 60 Gy (C and D). Photomicrographs of low (A and C) and high (B and D) magnification. Ki-67 stained tumor sections are shown at days 0, 1, 3, 7, 10, and 14 after irradiation (N = 1 each treatment group).
Figure 4.
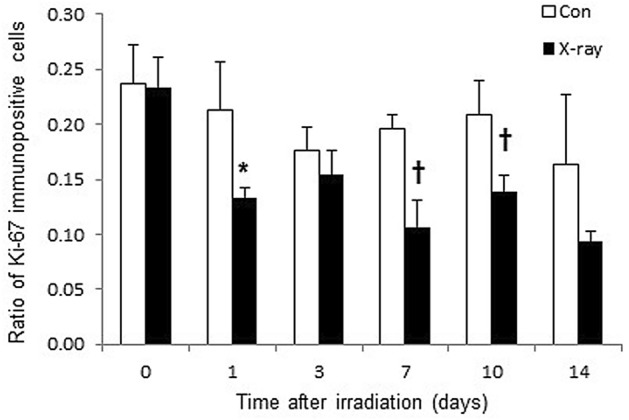
Semi-quantitative analysis of immunohistochemical expression of Ki-67 in LNZ308 tumors after irradiation. Tumors on right paws were irradiated on day 0 at the dose of 60 Gy. Each point represents mean ± SD of the ratio of Ki-67 immunopositive cells (n = 4). *p < 0.05 and †p < 0.01, as compared with control.
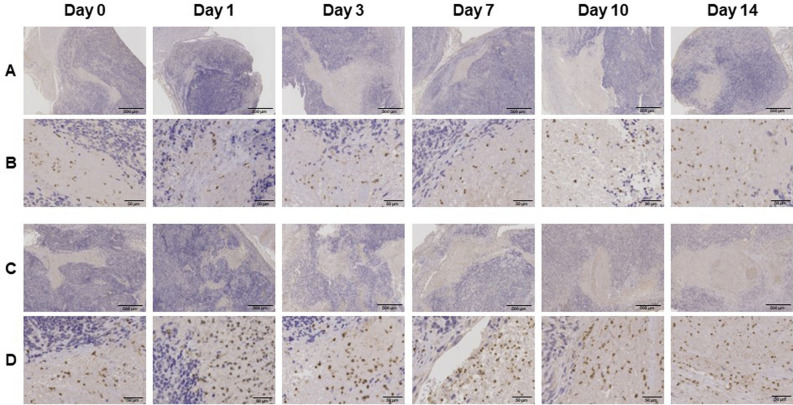
To confirm the induction of irradiation-associated inflammation, sections of tumor tissues were stained with anti-CD11b antibody (Fig. 5). CD11b immunoreactivities tended to increase 1 day after irradiation compared to those in the control.
Figure 5.
CD11b immunohistochemically stained sections of LNZ308 tumors after irradiation. The integrin alpha chain family member protein CD11b was used as a marker of inflammation. Tumors on right paws were irradiated on day 0 at the dose of 0 Gy (A and B) or 60 Gy (C and D). Photomicrographs of low (A and C) and high (B and D) magnification reveal CD11b stained tumor sections at days 0, 1, 3, 7, 10, and 14 after irradiation (N = 1 each treatment group).
Time-dependent change in PET probe uptake after irradiation
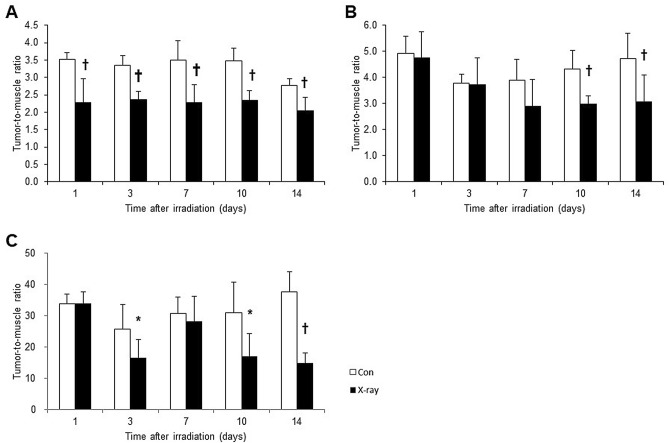
PET probe accumulations were evaluated in the dissected tissues using the mice model with LNZ308 tumor. [18F]FIMP accumulations were significantly decreased from day 1 compared to those in the control (Fig. 6A). However, [11C]MET accumulations significantly decreased from day 10 compared to those in the control (Fig. 6B). [18F]FDG accumulations were significantly decreased at day 3. However, this accumulation was transiently increased at day 7, and then was significantly decreased at day 10 and 14 as compared with that in the control (Fig. 6C).
Figure 6.
Change in probe uptake of LNZ308 tumors after irradiation. Tumors on right paws were irradiated on day 0 at the dose of 60 Gy. Probe uptake studies were performed at days 1, 3, 7, 10, and 14 after irradiation. Uptake of [18F]FIMP (A), [11C]MET (B), and [18F]FDG (C) were denoted by the tumor-to-muscle ratio (TMR). Each point represents mean ± SD (n = 4–8). *p < 0.05 and †p < 0.01, as compared with control.
Small animal PET imaging with [18F]FIMP
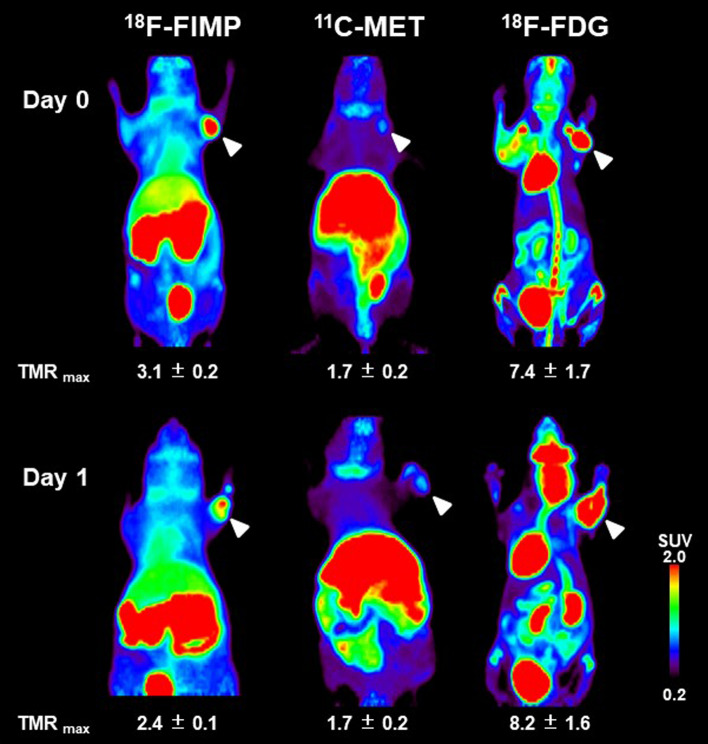
Small animal PET imaging using the LNZ308 tumor-bearing mouse was performed on day 1 after irradiation (Fig. 7). Accumulation of [18F]FIMP was markedly decreased compared to that in the control (TMR: control, 3.1 ± 0.2; irradiation, 2.4 ± 0.1). However, accumulation of [11C]MET did not change compared to that in the control (TMR: 1.7 ± 0.2; 1.7 ± 0.2). Accumulation of [18F]FDG was slightly increased compared to that in the control (TMR: 7.4 ± 1.7; 8.2 ± 1.6). PET images of all observation points are shown in supplementary information (see Supplementary Figs. S1 –S3 online).
Figure 7.
PET probe accumulation in LNZ308 tumors after irradiation. Images shown are the maximum intensity projection (MIP) image of [18F]FIMP, [11C]MET, and [18F]FDG-PET after irradiation on days 0 and 1. Tumors on right paws, as indicated by arrows, were irradiated on day 0 at the dose of 60 Gy. PET data were acquired 90 min after injection of [18F]FIMP and [11C]MET. [18F]FDG-PET data was acquired 55 to 100 min after injection. Data were reconstructed using OS-EM algorithm. Part of this figure was sourced from the following paper. Sci Rep. 2019 Oct 31;9(1):15718. 10.1038/s41598-019-52270-x.
Discussion
In this study, we revealed that [18F]FIMP could be more useful for early-phase evaluation of radiotherapy than the conventional probes [11C]MET and [18F]FDG.
We found that after irradiation, the tumor volume was significantly increased until day 11 and significantly decreased from day 18 compared to that before irradiation (day 0) (Fig. 1). These results suggest that anatomical changes such as decrease in tumor size due to irradiation is evident only from day 18 by anatomical imaging techniques such as CT or MRI, and before that, it is possible to detect biochemical changes only by using a functional imaging technologies such as PET. Based on this finding, our PET imaging studies were performed at days 1, 3, 7, 10, and 14 (arrow in Fig. 1).
Moreover, as a result of histological analysis of irradiated tissues, several characteristic changes in irradiation-induced cell death were observed in irradiated tumor tissue. Especially, it should be noted that morphologic and biochemical changes were already observed by H.E. staining (Fig. 2), Ki-67 (Figs. 3 and 4) and CD11b (Fig. 5) immunostaining just one day after irradiation. The decrease in Ki67 immunopositive cells reflects an increase in apoptotic cell death and is consequently associated with tumor shrinkage24. The frequency of CD11b-positive cells in tumors is highly correlated with COX-2 expression in tumors, reflecting the degree of radiation-induced inflammation25. That is, some biochemical changes may occur within the cells the next day after irradiation, suggesting that early-phase evaluation of radiotherapy is possible by using PET. As a confirmation of this hypothesis, the accumulations of [11C]MET and [18F]FDG did not change in the tumor tissues at the next day after irradiation, however, the accumulation of [18F]FIMP was significantly decreased at the next day after irradiation (Figs. 6, 7 and see Supplementary Fig. S1–S3 online). Our previous study identified that [18F]FIMP is a PET probe with sufficiently good affinity for LAT1 [28]. Therefore, LAT1 may be involved in this phenomenon. Previous studies have reported that Ki-67 and LAT1 expression in tumor tissues show a positive correlation26–28. Moreover, LAT1 is related to the regulation of cell proliferation by stimulating the mechanistic/mammalian target of rapamycin (mTOR) via the substrate L-leucine29. LAT1 expression after irradiation decreases in human brain tumor30. In this study, [18F]FIMP accumulation and Ki-67 expression in the tumor tissues after irradiation showed a similar tendency to decrease. Therefore, decrease in accumulation of [18F]FIMP after irradiation reflects a reduction of LAT1 expression, which may result in a decrease in cell proliferation.
The early-phase evaluation of tumor tissues after irradiation has already been studied with several PET probes such as [18F]FDG for glucose metabolism31, [18F]fluoromisonidazole (FMISO)32 and [64Cu]diacetyl-bis(N4-methylthiosemicarbazone) (ATSM)33 for hypoxia, [11C]MET34 for amino acid metabolism, [18F]fluorothymidine (FLT)35 for cell proliferation, and 2-(5-[18F]fluoro-pentyl)-2-methylmalonic acid (ML-10)36 for apoptosis. However, these probes are not sufficient to distinguish between tumor cells after irradiation and other changes such as inflammatory cells. In fact, immunoreactivity of CD11b, which is used as an inflammation marker, was appeared transiently increased at day 7 after irradiation (Fig. 5). Similarly, the accumulation of [18F]FDG was transiently increased at day 7 after irradiation (Fig. 6C).
In this study, only one dose of 60 Gy has been used as the radiation dose on the tumor tissue. However, in clinical radiation therapy, even lower dose or divided irradiation may be used to prevent the side effects of radiation. Therefore, in the next stage, we should test [18F]FIMP accumulation under these conditions.
Tumor uptake of [18F]FIMP but not of [11C]MET and [18F]FDG was effectively decreased 1 day after irradiation. Prognostic information after radiotherapy was obtained with [18F]FIMP at all time points during the first week after irradiation but only at limited time points with the 2 conventional probes [11C]MET and [18F]FDG. Based on these results, [18F]FIMP may be a PET probe involved in the early detection and prediction of radiotherapy efficacy, although further clarification is needed.
Methods
Probe synthesis
[18F]FIMP22 and [11C]MET37 were synthesized as described previously. All radiochemical purities of > 99.5% were determined by high performance liquid chromatography (HPLC). Human diagnostic grade [18F]FDG was provided by the Institute of Biomedical Research and Innovation (IBRI) hospital, Kobe, Japan.
Animal model
All animal experimental protocols were approved by the RIKEN Animal Welfare Committee and were conducted in accordance with the National Institutes of Health Principles of Laboratory Animal Care. All applicable institutional and/or national guidelines for the care and use of animals were followed. All animal results are reported following ARRIVE guidelines.
The LNZ308 human glioblastoma cell line, which has been confirmed to express LAT122, was a kind gift from Prof. Motoo Nagane of Department of Neurosurgery, Kyorin University, Japan. LNZ308 cells were cultured in Dulbecco's modified Eagle's medium (Nacalai Tesque, Inc., Kyoto, Japan) supplemented with 10% fetal bovine serum (Equitech-Bio, Inc., Kerrville, TX), 100 units/mL penicillin, and 100 μg/mL streptomycin (Nacalai Tesque, Inc.)38. LNZ308 cells were inoculated into the right forepaws of female BALB/cAJcl-nu/nu nude mice (CLEA Japan, Inc., Tokyo, Japan) via subcutaneous injection of 5 × 10⁶ cells in 100 μL Hank's balanced salt solution (Thermo Fisher Scientific, Waltham, MA)38. Tumor growth was monitored twice a week using a caliper.
Radiation treatment
Irradiation was performed with an X-ray irradiation system (MX-160Labo, mediXtec Japan Corporation, Chiba, Japan). Mice whose tumor volume reached 100 mm3 were selected and irradiated with X-rays. The mice were restrained in polypropylene tubes under 1.5% isoflurane anesthesia. In order to prevent radiation damage to normal tissues, the tube was shielded with a barium sulfate containing sheet (thickness: 9.9 mm; GT—RS, Green Technologies, Tokyo, Japan) which was highly effective in preventing radiation and only the tumor tissue in the right forepaw was irradiated. The X-ray dose applied was 60 Gy at a tube voltage of 160 kV, a tube current of 2.95 mA, a dose rate of 1.2 Gy/min, and an irradiation time of 52 min.
PET data acquisition and probe biodistribution
Mice were fasted for 14 h before [18F]FDG administration. [18F]FIMP and [11C]MET PET were administered to fed mice as a routine clinical [11C]MET PET examination. All mice were anesthetized with 1.5% isoflurane and placed on the bed of a microPET Focus 220 scanner (Siemens Medical Solutions USA, Inc., Knoxville, TN). Radiolabeled probes were dissolved in saline (0.1 mL) and administered via a cannula inserted into the tail vein. Emission data were acquired for 90 min after administration using a 3-dimensional (3D) list-mode method for [18F]FIMP and [11C]MET, and for 55–100 min after administration using a 3D list-mode method for [18F]FDG. Data were reconstructed using 2-dimensional filtered back projection (FBP) for quantification and a 2-dimensional ordered subset expectation maximization (OS-EM) algorithm for region of interest (ROI) definition. For ROI definition and further analysis, summed images (0–90 or 55–100 min post injection) were reconstructed. ROIs were drawn on several areas of tumor and muscle. Regional uptake of radioactivity in organs were decay-corrected based on injection times and expressed as the standardized uptake value (SUV), where SUV = tissue radioactivity concentration (MBq/cm3)/injected radioactivity (MBq) × body weight (g). Quantitative analysis of PET imaging data were also represented as tumor-to-muscle ratio (TMR)22. The Probe biodistribution study was performed using a different mouse than the PET study. After 90 min of probe administration, mice were sacrificed, and their organs quickly removed and washed with saline. Excised organs were weighed, and their radioactivity determined using a Wallac Wizard 1480 scintillation counter (PerkinElmer, Waltham, MA). Results were expressed as tumor-to-muscle ratio (TMR).
Histological analysis
Tumor tissues were fixed in 4% paraformaldehyde for more than 24 h, embedded in paraffin, cut into 10-µm thick sections. And then sections were deparaffinized and rehydrated.
For immunostaining, the tissues were heated with 10 mM citric acid using a microwave for antigen retrieval, and then incubated in blocking buffer containing 10% goat serum (Vector Laboratories, Burlingame, CA) for 30 min, and further incubated at 4 °C overnight with rabbit polyclonal anti-Ki67 antibody (1/1000; Leica Biosystems, Nussloch, German) or rabbit monoclonal anti-CD11b antibody (1/1000; Abcam plc, Cambridge, UK) diluted with Tris Buffered Saline with Tween 20 (TBST). The sections were washed in TBST and then incubated for 30 min with horseradish peroxidase-labeled polymer conjugated anti-rabbit antibody (DAKO EnVision + , Agilent Technologies, Inc., Santa Clara, CA), followed by 3,3'-diaminobenzidine (DAB) (Nacalai Tesque) as substrate. Once the desired color developed, sections were lightly counterstained with Mayer’s hematoxylin (FUJIFILM Wako Pure Chemical Corporation, Tokyo, Japan).
For Hematoxylin–Eosin (H.E.) staining, the tissues were stained with Mayer’s hematoxylin and Eosin Y Solutions (FUJIFILM Wako Pure Chemical Corporation).
All slides were digitized and saved using SCN400 slide scanner (Leica Microsystems, Wetzlar, Germany).
For quantification of Ki-67 immuno-positive cells, the number of DAB- and hematoxylin-stained nuclei was counted using a public domain Java image processing program, ImageJ39. The DAB-stained nuclei were divided by the sum of DAB- and hematoxylin-stained nuclei and converted into a ratio of Ki-67 immuno-positive cells.
Statistical analysis
Data are presented as mean ± standard deviation (SD). All statistical analyses were performed using Microsoft Excel 2010 version 14.0 (Microsoft, Redmond, WA) using Student’s t test. P-values less than 0.05 indicated significance.
Ethical approval
All animal experimental protocols were approved by the Animal Care and Use Committee of RIKEN. The study is reported in this manuscript according to the ARRIVE guidelines.
Supplementary Information
Acknowledgements
We thank Mr. M. Kurahashi (Sumitomo Heavy Industry Accelerator Service Ltd., Tokyo, Japan) for operating the cyclotron. This research was supported by AMED under Grant Numbers JP16cm0106201 (Y.W.), and JP16cm0106404 (S.N.).
Author contributions
S.N., Y.N., A.M., N.S., W.E.H., E.H., Y.W., H.D., and Y.W. were contributed to the concept and design of the experiments. S.N., Y.N., A.M., N.S., W.E.H., E.H., Y.W. were responsible for performing the experiments. S.N., Y.N., A.M. were responsible for analyzing the data. S.N., A.M., Y.W., H.D., and Y.W. were responsible for writing the paper. All authors contributed to the interpretation of the data. All authors critically reviewed and approved the manuscript.
Data availability
The datasets used and/or analysed during the current study available from the corresponding author on reasonable request.
Competing interests
The authors declare no competing interests.
Footnotes
Publisher's note
Springer Nature remains neutral with regard to jurisdictional claims in published maps and institutional affiliations.
Supplementary Information
The online version contains supplementary material available at 10.1038/s41598-023-29166-y.
References
- 1.Owen JB, Coia LR, Hanks GE. Recent patterns of growth in radiation therapy facilities in the United States: A patterns of care study report. Int. J. Radiat. Oncol. Biol. Phys. 1992;24:983–986. doi: 10.1016/0360-3016(92)90483-X. [DOI] [PubMed] [Google Scholar]
- 2.Wahl RL, Jacene H, Kasamon Y, Lodge MA. From RECIST to PERCIST: Evolving considerations for PET response criteria in solid tumors. J. Nucl. Med. 2009;50(Suppl 1):122S–150S. doi: 10.2967/jnumed.108.057307. [DOI] [PMC free article] [PubMed] [Google Scholar]
- 3.Vansteenkiste JF, et al. Prognostic importance of the standardized uptake value on (18)F-fluoro-2-deoxy-glucose-positron emission tomography scan in non-small-cell lung cancer: An analysis of 125 cases. Leuven Lung Cancer Group. J. Clin. Oncol. 1999;17:3201–3206. doi: 10.1200/JCO.1999.17.10.3201. [DOI] [PubMed] [Google Scholar]
- 4.Michaelis LC, Ratain MJ. Measuring response in a post-RECIST world: from black and white to shades of grey. Nat. Rev. Cancer. 2006;6:409–414. doi: 10.1038/nrc1883. [DOI] [PubMed] [Google Scholar]
- 5.Goffin J, Baral S, Tu D, Nomikos D, Seymour L. Objective responses in patients with malignant melanoma or renal cell cancer in early clinical studies do not predict regulatory approval. Clin. Cancer Res. 2005;11:5928–5934. doi: 10.1158/1078-0432.CCR-05-0130. [DOI] [PubMed] [Google Scholar]
- 6.Ratain MJ. Phase II oncology trials: let's be positive. Clin. Cancer Res. 2005;11:5661–5662. doi: 10.1158/1078-0432.CCR-05-1046. [DOI] [PubMed] [Google Scholar]
- 7.Buyse M, et al. Relation between tumour response to first-line chemotherapy and survival in advanced colorectal cancer: A meta-analysis. Meta-Anal. Group Cancer. Lancet. 2000;356:373–378. doi: 10.1016/s0140-6736(00)02528-9. [DOI] [PubMed] [Google Scholar]
- 8.Mochizuki T, et al. FDG uptake and glucose transporter subtype expressions in experimental tumor and inflammation models. J. Nucl. Med. 2001;42:1551–1555. [PubMed] [Google Scholar]
- 9.Freemerman AJ, et al. Metabolic reprogramming of macrophages: Glucose transporter 1 (GLUT1)-mediated glucose metabolism drives a proinflammatory phenotype. J. Biol. Chem. 2014;289:7884–7896. doi: 10.1074/jbc.M113.522037. [DOI] [PMC free article] [PubMed] [Google Scholar]
- 10.Hasnain N, Mustafa RM, Bakhshi SK, Shamim MS. Efficacy of Positron Emission Tomography in distinguishing brain tumours from inflammation. J. Pak Med. Assoc. 2020;70:2291–2293. [PubMed] [Google Scholar]
- 11.Cook GJ, Maisey MN, Fogelman I. Normal variants, artefacts and interpretative pitfalls in PET imaging with 18-fluoro-2-deoxyglucose and carbon-11 methionine. Eur. J. Nucl. Med. 1999;26:1363–1378. doi: 10.1007/s002590050597. [DOI] [PubMed] [Google Scholar]
- 12.Culverwell AD, Scarsbrook AF, Chowdhury FU. False-positive uptake on 2-[(1)(8)F]-fluoro-2-deoxy-D-glucose (FDG) positron-emission tomography/computed tomography (PET/CT) in oncological imaging. Clin. Radiol. 2011;66:366–382. doi: 10.1016/j.crad.2010.12.004. [DOI] [PubMed] [Google Scholar]
- 13.Glaudemans AW, et al. Value of 11C-methionine PET in imaging brain tumours and metastases. Eur. J. Nucl. Med. Mol. Imag. 2013;40:615–635. doi: 10.1007/s00259-012-2295-5. [DOI] [PubMed] [Google Scholar]
- 14.Narayanan TK, et al. A comparative study on the uptake and incorporation of radiolabeled methionine, choline and fluorodeoxyglucose in human astrocytoma. Mol. Imag. Biol. 2002;4:147–156. doi: 10.1016/s1536-1632(01)00010-5. [DOI] [PubMed] [Google Scholar]
- 15.Maeda Y, et al. Rasmussen syndrome: multifocal spread of inflammation suggested from MRI and PET findings. Epilepsia. 2003;44:1118–1121. doi: 10.1046/j.1528-1157.2003.67602.x. [DOI] [PubMed] [Google Scholar]
- 16.Ito K, Matsuda H, Kubota K. Imaging spectrum and pitfalls of (11)C-Methionine positron emission tomography in a series of patients with intracranial lesions. Korean J. Radiol. 2016;17:424–434. doi: 10.3348/kjr.2016.17.3.424. [DOI] [PMC free article] [PubMed] [Google Scholar]
- 17.Deloar HM, et al. Estimation of internal absorbed dose of L-[methyl-11C]methionine using whole-body positron emission tomography. Eur. J. Nucl. Med. 1998;25:629–633. doi: 10.1007/s002590050265. [DOI] [PubMed] [Google Scholar]
- 18.Hayashi K, Anzai N. Novel therapeutic approaches targeting L-type amino acid transporters for cancer treatment. World J. Gastrointest. Oncol. 2017;9:21–29. doi: 10.4251/wjgo.v9.i1.21. [DOI] [PMC free article] [PubMed] [Google Scholar]
- 19.Jin SE, Jin HE, Hong SS. Targeting L-type amino acid transporter 1 for anticancer therapy: clinical impact from diagnostics to therapeutics. Expert Opin. Ther. Targets. 2015;19:1319–1337. doi: 10.1517/14728222.2015.1044975. [DOI] [PubMed] [Google Scholar]
- 20.Grosu AL, et al. An interindividual comparison of O-(2-[18F]fluoroethyl)-L-tyrosine (FET)- and L-[methyl-11C]methionine (MET)-PET in patients with brain gliomas and metastases. Int. J. Radiat. Oncol. Biol. Phys. 2011;81:1049–1058. doi: 10.1016/j.ijrobp.2010.07.002. [DOI] [PubMed] [Google Scholar]
- 21.Wiriyasermkul P, et al. Transport of 3-fluoro-L-alpha-methyl-tyrosine by tumor-upregulated L-type amino acid transporter 1: A cause of the tumor uptake in PET. J. Nucl. Med. 2012;53:1253–1261. doi: 10.2967/jnumed.112.103069. [DOI] [PubMed] [Google Scholar]
- 22.Nozaki S, et al. (18)F-FIMP: a LAT1-specific PET probe for discrimination between tumor tissue and inflammation. Sci. Rep. 2019;9:15718. doi: 10.1038/s41598-019-52270-x. [DOI] [PMC free article] [PubMed] [Google Scholar]
- 23.Nozaki S, et al. First-in-human assessment of the novel LAT1 targeting PET probe (18)F-FIMP. Biochem. Biophys. Res. Commun. 2022;596:83–87. doi: 10.1016/j.bbrc.2022.01.099. [DOI] [PubMed] [Google Scholar]
- 24.Capaccione KM, et al. Evaluating the combined anticancer response of checkpoint inhibitor immunotherapy and FAP-targeted molecular radiotherapy in murine models of melanoma and lung Cancer. Cancers (Basel) 2022 doi: 10.3390/cancers14194575. [DOI] [PMC free article] [PubMed] [Google Scholar]
- 25.Hoing, B. et al. Stromal versus tumoral inflammation differentially contribute to metastasis and poor survival in laryngeal squamous cell carcinoma. Oncotarget9, 8415–8426, 10.18632/oncotarget.23865 (2018). [DOI] [PMC free article] [PubMed]
- 26.Nikkuni O, et al. Expression of amino acid transporters (LAT1 and ASCT2) in patients with stage III/IV laryngeal squamous cell Carcinoma. Pathol. Oncol. Res. 2015;21:1175–1181. doi: 10.1007/s12253-015-9954-3. [DOI] [PubMed] [Google Scholar]
- 27.Ichinoe M, et al. L-Type amino acid transporter 1 (LAT1) expression in lymph node metastasis of gastric carcinoma: Its correlation with size of metastatic lesion and Ki-67 labeling. Pathol. Res. Pract. 2015;211:533–538. doi: 10.1016/j.prp.2015.03.007. [DOI] [PubMed] [Google Scholar]
- 28.Hashimoto H, et al. L-type amino acid transporter 1 expression in esophageal carcinogenesis according to WHO and Japanese classifications of intraepithelial neoplasia. Pathol. Int. 2017;67:247–255. doi: 10.1111/pin.12528. [DOI] [PubMed] [Google Scholar]
- 29.Kongpracha P, et al. Structure-activity relationship of a novel series of inhibitors for cancer type transporter L-type amino acid transporter 1 (LAT1) J. Pharmacol. Sci. 2017;133:96–102. doi: 10.1016/j.jphs.2017.01.006. [DOI] [PubMed] [Google Scholar]
- 30.Papin-Michault, C. et al. Study of LAT1 Expression in brain metastases: Towards a better understanding of the results of positron emission tomography using amino acid tracers. PLoS One11, e0157139, 10.1371/journal.pone.0157139 (2016). [DOI] [PMC free article] [PubMed]
- 31.Allen-Auerbach M, Weber WA. Measuring response with FDG-PET: Methodological aspects. Oncologist. 2009;14:369–377. doi: 10.1634/theoncologist.2008-0119. [DOI] [PubMed] [Google Scholar]
- 32.Koh WJ, et al. Imaging of hypoxia in human tumors with [F-18]fluoromisonidazole. Int. J. Radiat. Oncol. Biol. Phys. 1992;22:199–212. doi: 10.1016/0360-3016(92)91001-4. [DOI] [PubMed] [Google Scholar]
- 33.Dehdashti F, et al. Assessing tumor hypoxia in cervical cancer by positron emission tomography with 60Cu-ATSM: Relationship to therapeutic response-a preliminary report. Int. J. Radiat. Oncol. Biol. Phys. 2003;55:1233–1238. doi: 10.1016/S0360-3016(02)04477-2. [DOI] [PubMed] [Google Scholar]
- 34.Minamimoto, R. et al. Differentiation of Brain Tumor Recurrence from Post-Radiotherapy Necrosis with 11C-Methionine PET: Visual Assessment versus Quantitative Assessment. PLoS One10, e0132515, 10.1371/journal.pone.0132515 (2015). [DOI] [PMC free article] [PubMed]
- 35.Hoeben BA, et al. 18F-FLT PET during radiotherapy or chemoradiotherapy in head and neck squamous cell carcinoma is an early predictor of outcome. J. Nucl. Med. 2013;54:532–540. doi: 10.2967/jnumed.112.105999. [DOI] [PubMed] [Google Scholar]
- 36.Allen AM, et al. Assessment of response of brain metastases to radiotherapy by PET imaging of apoptosis with (1)(8)F-ML-10. Eur. J. Nucl. Med. Mol. Imag. 2012;39:1400–1408. doi: 10.1007/s00259-012-2150-8. [DOI] [PubMed] [Google Scholar]
- 37.Comar D, Cartron J, Maziere M, Marazano C. Labelling and metabolism of methionine-methyl-11 C. Eur. J. Nucl. Med. 1976;1:11–14. doi: 10.1007/BF00253260. [DOI] [PubMed] [Google Scholar]
- 38.Nitta Y, et al. Nimotuzumab enhances temozolomide-induced growth suppression of glioma cells expressing mutant EGFR in vivo. Cancer Med. 2016;5:486–499. doi: 10.1002/cam4.614. [DOI] [PMC free article] [PubMed] [Google Scholar]
- 39.Health, N. I. o. Image J Image Processing and Analysis in Java, https://imagej.nih.gov/ij/index.html
Associated Data
This section collects any data citations, data availability statements, or supplementary materials included in this article.
Supplementary Materials
Data Availability Statement
The datasets used and/or analysed during the current study available from the corresponding author on reasonable request.


