

Summary:
Dendritic spines can be directly connected to both inhibitory and excitatory presynaptic terminals, resulting in nanometer-scale proximity of opposing synaptic functions. While dually innervated spines (DiSs) are observed throughout the central nervous system, their developmental timeline and functional properties remain uncharacterized. Here we used a combination of serial section electron microscopy, live imaging and local synapse activity manipulations to investigate DiSs development and function in rodent hippocampus. Dual innervation occurred early in development, even on spines where the excitatory input was locally silenced. Synaptic NMDA receptor currents were selectively reduced at DiSs through tonic GABAB receptor signaling. Accordingly, spine enlargement normally associated with long-term potentiation on singly innervated spines (SiSs) was blocked at DiSs. Silencing somatostatin interneurons or pharmacologically blocking GABABRs restored NMDA receptor function and structural plasticity to levels comparable to neighboring SiSs. Thus, hippocampal DiSs are stable structures where function and plasticity are potently regulated by nanometer-scale GABAergic signaling.
Graphical Abstract

ETOC blurb
Kleinjan et al. demonstrate formation of hippocampal dually innervated spines (DiSs) occurs early in development and does not require excitatory input. NMDA receptor function and structural plasticity are impaired at DiSs. These effects are mediated through tonic GABAB receptor signaling and may contribute to long-term DiS stability.
Introduction:
A subset of dendritic spines, the primary sites of excitatory synaptic connectivity in the central nervous system, are contacted by both an excitatory and an inhibitory presynaptic terminal1,2. Dually innervated spines (DiSs) have been observed on principal neurons throughout the neocortex where they represent up to 25-30% of spine synapses and account for approximately one third of total dendritic inhibitory inputs1,3–6. While DiSs are widely observed, whether they are functionally distinct from neighboring, singly innervated spines (SiSs) is unclear. DiSs contain inhibitory and excitatory postsynaptic specializations responsible for anchoring GABA and glutamate receptors in closely spaced, but discrete spine subdomains. Longitudinal in vivo imaging revealed DiSs on cortical pyramidal neurons are larger and more stable than neighboring SiSs7,8. A different study demonstrated that the number of DiSs in the somatosensory cortex increases following whisker stimulation 9. Together, these observations suggest that DiSs may develop from SiSs following activity-dependent forms of plasticity such as long-term potentiation (LTP), hallmarks of which are spine growth and stabilization10,11. However, it is unclear whether synaptic activity and/or plasticity is required for DiS development or maintenance.
Once formed, DiSs are particularly well suited for synaptic crosstalk signaling between excitatory and inhibitory synapses. For example, GABAA receptors (GABAARs) and GABABRs can potently modulate excitatory function through signaling pathways regulating N-methyl-D-aspartic acid receptor (NMDAR) function12–14. While this type of synaptic crosstalk is likely to be amplified within the femtoliter confines of a dendritic spine, how spine function and plasticity is influenced by an adjoining inhibitory input remains unclear. Here we use a combination of three-dimensional reconstruction through serial section electron microscopy (3DEM), live imaging, single synapse silencing techniques and neurotransmitter uncaging to characterize the development, function and plasticity of DiSs.
Results:
DiSs form in hippocampus early during spinogenesis in vivo and in vitro
We characterized the development and activity dependence of DiS formation, focusing on CA1 pyramidal neurons of the hippocampus with their well-defined synaptic connectivity and plasticity mechanisms. DiSs were visualized by electroporating embryonic mice (age E15.5) with intrabody probes (FingRs) that label endogenous gephyrin (fused to mScarlet; GephFingR-mScar) and PSD95 (fused to green fluorescent protein; PSD95FingR-GFP)15. The plasma membrane marker pDisplay fused to Halotag (HT-pDisp) was used to visualize morphology with JF646 dye16 (Grimm et al., 2015). Electroporated hippocampal CA1 pyramidal neurons were imaged by confocal microscopy in perfusion-fixed sections prepared at different ages (P13, 17, 25 and 45) (Fig. 1A–D). At P45, spines harboring both GephFingR-mScar and PSD95FingR-GFP signal were observed in stratum oriens (SO; 4-7% of all spines stratum radiatum (SR; 3-6% of all spines) and stratum lacunosum moleculare (SLM; 6-9% of all spines) (Fig. 1B–D). DiSs accounted for a significant proportion of total dendritic gephyrin puncta (SO, 21-34%; SR, 9-16%; SLM, 13-19%) (Fig. 1E). Surprisingly, a similar fraction of DiSs were observed at P13, when dendritic spines are just beginning to form (Fig. 1D).
Figure 1. DiSs are present in all layers of hippocampus.

A. Shown is a coronal hippocampal brain section from a P45 mouse that was embryonically electroporated with HT-pDisp, GephFingR-mScar and PSD95FingR-GFP (only HT-pDisp channel is shown).
B. Image of hippocampal CA1 pyramidal cells expressing postsynaptic reporters GephFingR-mScar (red), PSD95FingR-GFP (green) and morphology reporter HTJF646-pDisp (grey). Abbreviations: stratum pyramidale (SP), stratum oriens (SO), stratum radiatum (SR), stratum lacunosum moleculare (SLM). Scale bar=20μm.
C. Zoomed images from (B) showing a dendritic branch with spines positive for both GephFingR-mScar (red) and PSD95FingR-GFP (green) (arrowheads). A magnified image of a DiS from a different dendrite is shown (bottom row). Scale bars=5μm, 1μm.
D. Example images of DiSs at different developmental timepoints. Percentages of total spines that are dually innervated are noted above. N=40-45 neurons from 10 slices from 6 mice. Scale bar=1μm.
E. Quantification (mean±SEM) of DiSs/10μm of dendrite (left); percent of total spines with both PSD95 and Geph signal (middle); and the fraction of total Geph puncta in spines (right) is plotted for each layer. Data are taken from P45 mice. N=35-40 neurons from 5 slices from 2 mice.
F. (a and a’) EM image from SR showing two DiSs (DiS1 and DiS2 in a; yellow highlighting in a’) making symmetric synapses (red arrowheads in a) with a presynaptic bouton containing pleomorphic vesicles (b1 in a; red in a’). Each DiS makes an asymmetric synapse (green arrowheads in a) with a bouton (green highlighting in a’) containing round vesicles. (b and b’) EM image showing a symmetric synapse (red arrowhead in b) on shaft of another dendrite (yellow in b’) with the same presynaptic axon as in a and a’ (b2 in b; red in b’). (c) 3D reconstruction of an axon (light red) forming symmetric synapses (red) with five different dendrites (Sh1-5; light yellow). Insets show 3D reconstructions of DiS1 and DiS2 seen in a and a’. DiS2 is a dually innervated branch of a branched of a branched spine (excitatory PSDs are rendered in green). The shaft (Sh1) symmetric synapse shown in b and b’ is indicated by the gray arrow (b2).
G. (a and a’) EM image from SLM showing a DiS (a; yellow in a’) forming a symmetric synapse (red arrowhead in a) with a presynaptic bouton containing pleomorphic vesicles (b2 in a; red in a’) and an asymmetric synapse (green arrowheads in a) with a bouton containing round vesicles (b1 in a; green in a’). (a’’) 3D reconstruction of the DiS shown in a and a’. (b and b’) EM image showing a symmetric synapse (red arrowhead in b) on dendritic shaft (yellow in b’) with a presynaptic bouton (b3 in b; red in b’). Scale bar in a applies to a’, b, and b’. Scale cube in b’’ also applies to a’’.
H. Quantification (mean±SEM) of DiSs in 3D EM reconstructions plotted as the number of DiSs/10μm of dendrite length (left), DiSs as a fraction of all spines in SR (0.53 ± 0.20%) and SLM (4.35 ± 1.22%) (middle), and the fraction of all symmetric synapses located on spines (right). N = 31 (SR) or 36 (SLM) dendrites from three rats for SR and two for SLM.
Since fluorescence imaging only reports postsynaptic specializations, DiSs were also characterized through 3DEM using datasets from adult rat hippocampal area CA1. Symmetric synapses (presumably inhibitory) were defined as having thin pre- and postsynaptic thickenings and pleomorphic presynaptic vesicles. Asymmetric synapses (presumably excitatory) had a thick postsynaptic density and round presynaptic vesicles. DiSs had both symmetric and asymmetric synapses (Figs. 1Fa–a’ and Ga–a’), although most symmetric synapses were located on dendritic shafts (Figs. 1Fb–b’ and Gb–b’). DiSs accounted for 0.53±0.20% of all spines along dendrites in SR and 4.35±1.22% in SLM (Fig. 1H). The high total spine density in SR of adult rat CA1 accounts for the small fraction of DiSs observed in this layer compared to the confocal imaging, where total spines are likely undercounted. Nevertheless, the density of DiSs in SLM and the overall fraction of symmetric synapses on spines in both SR and SLM, are remarkably similar to the confocal imaging data (Fig. 1E). In SR and SLM, asymmetric synapse size did not differ significantly between SiSs and DiSs, nor did the size of symmetric synapses located on spines or shafts (Fig. S1A,B).
We also investigated whether DiSs form in ex vivo preparations, which allow for more controlled experimental manipulations. Indeed, we observed Geph/PSD95-positive spines in organotypic hippocampal slices and dissociated cultures. Geph/PSD95-positive spines were associated with presynaptic vGAT, contained functional GABAA receptors and developed over a similar time course as in vivo. (Fig. S1C–H).
DiS formation in hippocampus does not require excitatory synaptic activity
In cortex, DiSs are dynamically regulated by experience8,9, but it remains unknown if excitatory input is required for DiS formation and/or maintenance. We generated an adeno-associated virus (AAV) encoding the catalytic light chain of tetanus neurotoxin (TeNTLC) to constitutively block presynaptic neurotransmitter release, along with synaptophysin-halotag (Sph-HT) to identify TeNTLC-expressing terminals. This general approach has been shown previously to disrupt presynaptic glutamate release, but does not prevent postsynaptic spine development17–22. The efficacy of our Sph-HT-T2A-TeNTLC AAV was confirmed in rat organotypic slices and primary cultured neurons by VAMP2 staining, FM dye loading and whole-cell recordings (Fig. S2A–D).
A subset of CA3 principal neurons in rat organotypic hippocampal slices were infected with Sph-HT-T2A-TeNTLC AAV immediately following dissection at P4-5 (Fig. 2A). At equivalent postnatal day (EP; postnatal day of slice preparation + days in vitro) 13-14, slices were biolistically transfected with GephFingR-GFP along with tdTomato (tdTom). CA1 pyramidal neurons expressing GephFingR-GFP/tdTom (the recipients of excitatory inputs from CA3) were imaged 1-2 days later (Fig. 2A). The low viral titer achieved sparse (<10%) infection of CA3 neurons such that spines with inactive or unperturbed terminals could be compared on the same cell (Fig. 2B). The number of DiSs was not significantly different in slices infected with Sph-HT-T2A-TeNTLC AAV vs. uninfected controls (Fig. 2Bi). Surprisingly, silenced terminals appeared directly associated with DiSs. The fraction of DiSs associated with a silenced presynaptic terminal was not significantly different from the fraction of total spines contacted by a silenced input (Fig. 2Bii). Likewise, spine GephFingR signal was not significantly different at DiSs associated with an active or inactive terminal (Fig. 2Biii).
Figure 2. DiS formation does not require excitatory input.
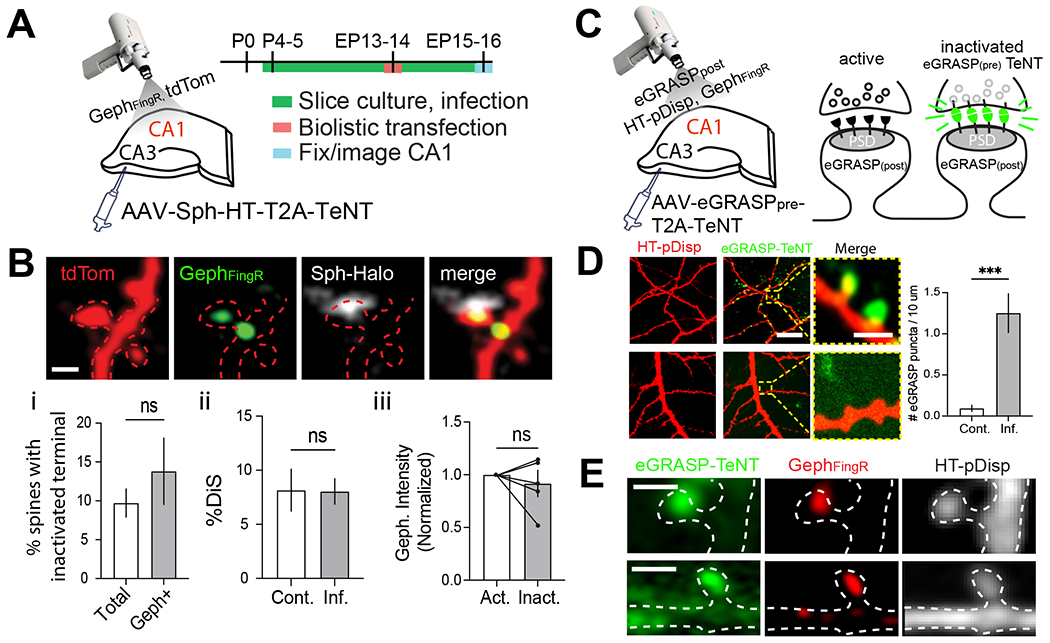
A. Experimental strategy for inactivation of CA3 inputs to CA1. Organotypic hippocampal slices were infected in CA3 with low titer AAV Sph-HT-T2A-TeNTLC immediately following preparation on P5. The slices were biolistically transfected on EP13-15 with tdTom and GephFingR-GFP. Transfected CA1 pyramidal neurons were imaged to identify DiSs and inactivated terminals.
B. Representative example of a spine (red) with Geph signal (green) associated with a TeNT-expressing presynaptic terminal (Sph-HT, grey). Graphs (bottom row) plot (i) the fraction of total or gephyrin-positive spines with an inactivated presynaptic terminal, n.s., not significant, Student’s t-test. (ii) % of total spines that were dually innervated in infected and non-infected slices. n.s., not significant, Student’s t-test (iii) GephFingR-GFP intensity at TeNT-inactivated DiSs normalized to active DiSs from the same neuron. n.s., not significant, paired Student’s t-test. n=5 slices from 2 different animals (Cont.); n=11 slices from 4 different animals (Inf.). Scale bar=1μm.
C. Strategy for TeNT modified eGRASP. Organotypic hippocampal slices were infected in CA3 with eGRASPpre-T2A-TeNTLC AAV immediately following preparation. Slices were then biolistically transfected on EP13-15 with eGRASPpost, GephFingR-mScar and HT-pDisp to visualize DiSs in CA1 neurons. GFP signal appears at contacts made between transfected postsynaptic cells and inactivated terminals from infected presynaptic cells.
D. GFP signal is observed in slices infected with eGRASPpre-T2A-TeNTLC and transfected with eGRASPpost (top row). No signal was detected in slices not infected with eGRASPpre-T2A-TeNTLC (bottom row, display was increased to highlight lack of eGRASP signal), ***p<0.001, Student’s t-test n=6 neurons from 6 slices from at least 2 different animals. Scale bars=20μm, 1μm magnified images.
E. Examples of eGRASP-labeled and GephFingR-positive spines. Scale bar=1μm.
To confirm inactivated terminals were directly connected to visualized postsynaptic spines, we used a modified “enhanced GFP reconstitution across synaptic partners” (eGRASP) approach23 (Fig. 2C). AAV was generated that expresses presynaptic eGRASP (eGRASPpre) along with TeNTLC (eGRASPpre-T2A-TeNTLC). CA3 pyramidal neurons were sparsely infected with eGRASPpre-T2A-TeNTLC at P5. At EP13-14 slices were transfected with GephFingR-mScar, HT-pDisp, Cre and postsynaptic eGRASP (eGRASPpost) and imaged 12-24 hours later. Reconstituted GFP signal only appears between silenced terminals and spines from cells expressing GephFingR-mScar/ HT-pDisp /Cre/eGRASPpost (Fig. 2C). In slices expressing both pre- and postsynaptic eGRASP, but not controls, reconstituted GFP signal was observed at gephyrin-containing spines (Fig. 2D–E). Together, these results indicate the formation and maintenance of DiSs does not require ongoing activity of the associated excitatory terminal.
Structural plasticity is impaired at DiSs
Previous data indicate cortical DiSs are remarkably stable compared to neighboring SiSs8. Thus, we tested whether DiSs are capable of morphological plasticity using a glutamate uncaging protocol10. Neurons were transfected with tdTom along with GephFingR-GFP. Spines with and without GephFingR-GFP signal were targeted for single-photon (rat cultures) or two-photon (mouse organotypic slices) glutamate uncaging-induced spine growth (Figs. 3A, S3A). These experiments were conducted in the presence of tetrodotoxin (TTX) to avoid possible dampening of excitatory responses by coincident phasic GABA release. In both preparations, glutamate uncaging (Glu HFU, 30 pulses at 1 Hz) elicited robust growth of SiSs (Fig. 3A,B, S3A). There was no relationship between the magnitude of SiS spine growth and distance to the nearest shaft inhibitory input (Fig. 3C). Surprisingly, structural plasticity did not occur at DiSs in response to the same stimuli (Fig. 3D,E, S3A). Note that we targeted DiS and SiS groups with similar initial sizes since the degree of plasticity-induced growth depends on initial spine size10 (Fig. 3F, S3A). These data reveal a specific impairment of structural plasticity at DiSs.
Figure 3. DiSs resist structural plasticity through attenuated NMDAR function.
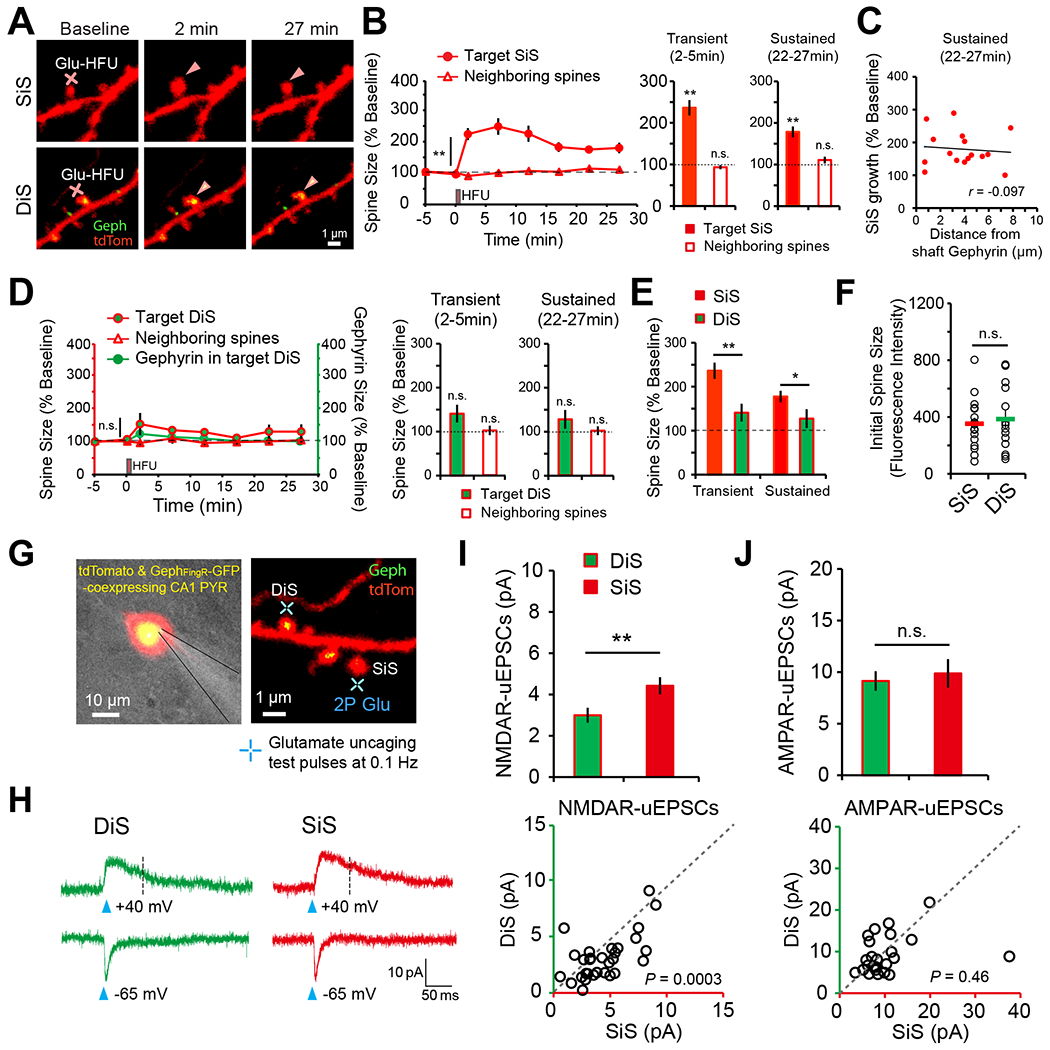
A. Time-lapse images of SLM dendrites from CA1 pyramidal neurons co-expressing tdTom (red) and GephFingR-GFP (green). A SiS or DiS was exposed to high frequency glutamate uncaging (Glu HFU) at locations indicated by the red crosses.
B. HFU triggered robust growth of SiSs (n=17 spines, 14 cells) compared with unstimulated neighboring spines (n=106 spines, 14 cells). Transient (left, 2-5 min post HFU) and sustained (right, 22-27 min post HFU) increases in SiSs volume (but not neighboring unstimulated spines) occurred following HFU. **p<0.01, Student’s t-test.
C. Growth of SiSs (n=16 spines, 13 cells) is plotted as a function of distance to the nearest shaft inhibitory input. Structural plasticity was not influenced by proximity to shaft inhibitory synapses. p=0.729, Pearson’s correlation.
D. Time course of DiS size or GephFingR-GFP intensity following HFU. Both transient and sustained structural plasticity were blocked at DiSs (HFU targeted DiS: n=14 spines, 13 cells, neighboring unstimulated control spines: n=69 spines, 13 cells). n.s. not significant, Student’s t-test.
E. Direct comparison between SiSs and DiSs for transient (2-5 min post HFU) and sustained (22-27 min post HFU) structural plasticity *p<0.05, **p<0.01, Student’s t-test.
F. The initial size of spines targeted for plasticity was indistinguishable between SiS and DiS groups. n.s. not significant, Student’s t-test.
G. DIC image of an organotypic hippocampal slice culture showing a CA1 pyramidal neuron transfected with tdTom and GephFingR-GFP targeted for whole cell recording. Blue crosses indicate two-photon glutamate uncaging spots at DiS and SiS on the same dendritic segment.
H. Uncaging evoked EPSCs (uEPSCs) from a DiS (green) and neighboring SiS (red) measured in whole-cell voltage-clamp mode at −65 mV for AMPARs and +40 mV for NMDARs. Black dotted lines (70 ms post-uncaging) indicate measuring points for NMDAR-uEPSC amplitudes.
I. Summary graph of NMDAR-uEPSC amplitudes from DiSs (n=30 spines, 11 cells) and SiSs (n=30 spines, 11 cells). **p<0.01, paired Student’s t-test. A scatter plot is shown below for NMDAR-uEPSCs from pairs of DiS and SiS from the same dendrite.
J. Summary graph of AMPAR-uEPSC amplitudes from DiSs (n=24 spines, 11 cells) and SiSs (n=25, 11 cells). A scatter plot showing the amplitude of AMPAR-uEPSCs from pairs of DiS and SiS from the same dendrite. n.s. not significant, paired Student’s t-test.
Because structural plasticity is driven by NMDAR activation, NMDAR function at DiSs and neighboring SiSs was compared using simultaneous whole-cell patch clamp recordings and two-photon glutamate uncaging in organotypic hippocampal slices. Uncaging-evoked NMDAR currents were reduced in amplitude at DiSs compared to nearby SiSs (Fig. 3G–I). In contrast, alpha-amino 3-hydroxy-5-methyl-4 isoxazole propionic acid receptor (AMPAR) currents were comparable (Fig. 3J). NMDAR-dependent Ca2+ entry in response to glutamate uncaging was directly monitored using the genetically encoded Ca2+ indicator GCaMP6s24. These experiments were performed using confocal imaging of dissociated hippocampal cultures, which also exhibit plasticity impairment selectively at DiSs, to overcome the challenges of 3 color 2P uncaging/imaging (Fig. S3A,B). We observed a significant decrease in 1P uncaging-evoked NMDAR-mediated Ca2+ transients at DiSs compared to neighboring SiSs (Fig. S3C,D). To test if differences were due to NMDAR subunit composition, Ca2+ influx at individual spines was measured in response to either glutamate uncaging or spontaneous, quantal neurotransmitter release before and after inhibiting GluN2B-containing NMDARs with ifenprodil25. Ifenprodil blocked a similar fraction of Ca2+ entry at DiSs and SiSs and Ca2+ entry at DiSs remained significantly impaired relative to neighboring SiSs even in the continued presence of ifenprodil (Fig. S3C–F). Therefore, differences in Ca2+ entry are unlikely to arise from differences in the number or function of GluN2B-containing NMDARs.
NMDARs at DiSs are modulated by inhibitory input and GABABR signaling
We next investigated the origin of the inhibitory inputs onto DiSs. Somatostatin-expressing interneurons (SST-INs) preferentially innervate pyramidal cell dendrites. Thus, we infected organotypic slices from SST-Cre mice with cre-dependent (flip excision, FLEX) Sph-HT AAV to visualize SST-IN terminals. Slices were subsequently transfected with tdTom and GephFingR-GFP to identify DiSs on CA1 pyramidal neurons. Sph-HT signal was observed closely associated with DiSs (Fig. S4A,B). To assess whether GABA release from SST-INs was responsible for reduced NMDAR function at DiSs, organotypic slices from SST-Cre mice were infected with FLEX TeNTLC AAV (Fig. 4A)26. The efficacy of TeNTLC silencing was confirmed by co-infecting slices from SST-Cre mice with high titer FLEX channelrhodopsin-2 (ChR2) AAV. Light-evoked IPSCs recorded from CA1 neurons were nearly eliminated in slices infected with FLEX ChR2 and TeNTLC AAVs (Fig. S4C,D). Glutamate uncaging-evoked NMDAR currents were next measured at DiSs and SiSs of CA1 pyramidal neurons in SST-Cre slices infected with FLEX-TeNTLC AAV. With GABA release blocked from SST interneurons, DiS NMDAR currents were indistinguishable from neighboring SiSs (Fig. 4B,C). Importantly, TeNTLC expression in SST-interneurons did not affect NMDAR currents at SiSs (Fig. 4C). Next, organotypic slices were preincubated with either GABAAR antagonist, bicuculline, or GABABR antagonist, CGP55845, for varying times before measuring NMDAR function (Fig. 4D, S4E). Uncaging-evoked NMDAR currents at DiSs remained significantly impaired relative to SiSs in slices treated with bicuculline (Fig. S4E). However, either long-term (36-48hrs, Fig. S4E) or short-term (3-4hrs, Fig. 4E) blockade of GABABRs with CGP55845 rescued NMDAR currents at DiSs to levels indistinguishable from neighboring SiSs. CGP55845 treatment did not affect NMDAR currents at SiSs, overall development or morphology of DiSs or SiSs (Fig. S4E–H). Blocking GABABRs with CGP55845 for shorter times (2-12mins) was ineffective in restoring NMDAR currents or Ca2+ entry at DiSs (Figs. 4F, S4I). Thus, reversal of the GABABR impact on NMDAR function at DiSs is relatively slow, taking tens of minutes to hours.
Figure 4. NMDAR function and structural plasticity are attenuated at DiSs through GABABR signaling.

A. Schematic showing AAV-Flex-TeNTLC infection of SST-Cre hippocampal organotypic slices at EP7 and two-photon imaging and recording at EP21.
B. Two-photon image of a dendrite from a CA1 pyramidal neuron co-expressing tdTom (red) and GephFingR-GFP (green) in AAV-Flex-TeNTLC-expressing SST-Cre hippocampal slices. A DiS and a SiS were targeted with glutamate uncaging test pulses (blue crosses).
C. NMDAR-uEPSCs evoked by glutamate uncaging from DiS (green) and SiS (red). Black dotted lines (70 ms post-uncaging) indicate measuring points for NMDAR-uEPSC amplitudes. Summary graph of NMDAR-uEPSC amplitudes from DiSs (n=18 spines, 5 cells) and SiSs (n=23 spines, 5 cells). SiS data without TeNTLC (open red) are from Fig. 3I. The scatter plot shows the amplitude of NMDAR-uEPSCs from pairs of DiS and SiS from the same dendrites. n.s., not significant, paired Student’s t-test.
D. Schematic of the experimental timeline of CGP55845 treatment and 2P imaging/uncaging at DiSs and SiSs of CA1 pyramidal neurons in organotypic slices at EP14-17.
E. NMDAR-uEPSCs evoked by glutamate uncaging from DiS (green) and SiS (red) in CGP55845 (4μM, 3-4hrs) treated hippocampal slices. Black dotted lines (70 ms post-uncaging) indicate measuring points for NMDAR-uEPSC amplitudes. Summary graphs of NMDAR-uEPSC amplitudes (DiS, n=14 spines, 8 cells; SiS, n=14 spines, 8 cells). A scatter plot showing the amplitude of NMDAR-uEPSCs from pairs of DiS and SiS. n.s., not significant, paired Student’s t-test.
F. A time course plot of NMDAR-uEPSC amplitudes from DiSs (n=14-15 spines, 14 cells) and SiSs (n=14-15 spines, 14 cells) before and during CGP55845 bath application (4μM, 2-12mins). 3-4hrs data (gray shade) are from Fig. 4E. *p<0.05, **p<0.01, n.s., not significant, paired Student’s t-test.
G. Schematic showing AAV-Flex-TeNTLC infection at EP7 and two-color, 2P uncaging of glutamate and GABA at EP20-23.
H. Time-lapse images of dendrites from CA1 pyramidal neurons co-expressing tdTom (red) and GephFingR-GFP (green). Blue and green crosses indicate glutamate uncaging test pulses (2P Glu) and high frequency GABA uncaging (GABA HFU), respectively.
I. NMDAR-uEPSC traces from DiS (green) and SiS (red) before and 4-5 min after GABA HFU.
J. Decreased NMDAR-uEPSCs at DiSs following GABA HFU is mediated through GABABRs (DiS, n=14 spines, 10 cells; SiS, n=19 spines; +CGP bath, n=21 spines, 8 cells; 4μM CGP55845). *p<0.05, n.s., not significant, paired Student’s t-test.
K. Schematic showing CGP55845 treatment and two-photon imaging/uncaging in hippocampal organotypic slices at EP15-17. Time-lapse images of dendrites from CA1 pyramidal neurons co-expressing tdTom (red) and GephFingR-GFP (green). SiS and DiS (arrowheads) were exposed to glutamate HFU in the presence of CGP55845 (4μM).
L. HFU increased the volume of SiSs (n=12 spines, 11 cells) and DiSs (n=13 spines, 10 cells) compared with unstimulated neighboring spines (SiS neighbors, n=79 spines, 11 cells; DiS neighbors, n=65 spines, 10 cells) in the presence of CGP55845. **p<0.01, Student’s t-test.
M. HFU increased both transient (left, changes over 2-5 min) and sustained (right, changes over 22-27 min) volume of SiS and DiS, but not unstimulated spines, compared with baseline in CGP55845. **p<0.01, *p<0.05, n.s. not significant, Student’s t-test.
To confirm whether GABABR activation directly decreases NMDAR currents at DiSs, two-color, two-photon photolysis of caged glutamate and GABA was used. Natural GABAergic transmission was blocked with FLEX-TeNTLC AAV using SST-Cre mice to restore NMDAR function at DiSs (Fig. 4G). Repetitive 2P GABA uncaging (GABA HFU, 60 pulses at 10Hz) significantly reduced uncaging-evoked NMDAR currents at DiSs but not at nearby SiSs on the same dendritic segment, even though GABABRs were observed by immunostaining at both DiSs and SISs (Figs. 4H–J; S4J). This effect was completely inhibited by bath application of CGP55845 (Fig. 4J), further supporting a role for DiS-specific regulation of NMDAR function by GABABR signaling. Importantly, inhibiting GABABRs not only restored NMDAR function but also rescued structural plasticity of DiSs with no effect on neighboring SiSs (Fig. 4K–M). Together, these data demonstrate tonic GABABR signaling reduces NMDAR function and plasticity specifically at DiSs, revealing the importance of inhibitory signaling for DiS structural stability.
Discussion:
While inhibitory synaptic contacts occur directly on dendritic spines throughout the neocortex, the development and functional properties of DiSs have remained largely uncharacterized. Why does dual innervation occur to begin with? One possibility is that inhibition is recruited to mature spines in an activity-dependent manner to dampen overactive sites of excitation. For example, a recent study in cortex report that DiS excitatory PSDs are larger than SiS PSDs, suggesting the excitatory input had been potentiated4. However, in hippocampus no difference was observed. Their comparable size distribution to neighboring SiSs is consistent with their resistance to potentiation and growth. In fact, DiSs in hippocampus form even when glutamate release from the associated excitatory terminal was blocked. While excitatory function may not be required for DiS development, it could play a role in subsequent DiS dynamics. For example, in the visual cortex of adult mice the rate of gephyrin disassembly and reassembly at DiSs depends on sensory input8. Whether similar dynamics occur in hippocampus and whether plasticity could occur during periods of gephyrin disassembly remain unknown.
While the inhibitory component of dual innervation most certainly plays a powerful role in dampening plasticity during coincident GABAAR activation3,13, our experiments reveal an additional layer of regulation through tonic GABABR signaling. This finding was surprising since DiSs were identified based on the postsynaptic marker gephyrin, yet GABABRs do not appear enriched at the inhibitory postsynaptic membrane27. Previous studies demonstrate potent GABABR regulation of NMDAR function12,14. However, these studies relied on global pharmacological activation of GABABRs, leaving it unclear precisely where this regulation naturally occurs and its functional consequences. We found that NMDARs are suppressed specifically at DiSs and this regulation is sufficient to impair structural plasticity. While GABABRs may be broadly distributed, our GABA uncaging data indicate they play a selective role in regulating NMDAR function at DiSs, perhaps due to select localization of specific GABABR isoforms and/or activation of downstream signaling molecules only present at DiSs28,29. Their proximity to the excitatory PSD, along with spatial boundaries imposed by the spine membrane result in highly localized crosstalk signaling sufficient to impair nearby NMDARs and structural plasticity without influencing neighboring SiSs. More experiments are needed to delineate the downstream mechanisms, but previous studies using global pharmacological activation of GABABRs reported reduced NMDAR-mediated Ca2+ entry, but not total current through regulation of a phosphorylation site on GluN2B14,30. However, the GABABR-dependent regulation of NMDARs that we observed in hippocampus appears distinct. First, we observed that both Ca2+ entry and overall current were reduced at DiSs compared to neighboring SiSs. Furthermore, selectively blocking GluN2B-containing NMDA receptors reduced Ca2+ entry to a similar extent at both DiSs and SiSs and did not normalize their respective Ca2+ responses. Instead, NMDAR function could be regulated through a distinct signaling mechanism. Multiple kinase pathways can regulate NMDAR channel properties, clustering and localization through direct phosphorylation or indirect mechanisms31–33.
While the role of DiSs in circuit function remains unclear, previous longitudinal in vivo imaging studies in cortex demonstrate DiSs are much less dynamic in shape and size compared to SiSs, suggesting they could act as stable points of circuit connectivity in the face of ongoing plasticity and turnover at neighboring singly innervated inputs7,8. A subset of immutable synaptic connections could maintain a stable thread of circuit connectivity, which may be especially important in brain regions with high synapse turnover and plasticity. Indeed, complete turnover of dendritic spines could take place within weeks on CA1 hippocampal pyramidal neurons34. The relatively slow reversal of NMDAR impairment at DiSs upon GABABR antagonism suggests these synapses are unlikely to revert to a plastic state during brief pauses in GABA release, contributing to their long-term stability.
Star Methods
Resource Availability
Lead contact
Requests for materials and reagents related to this study will be fulfilled by lead contact Matthew J. Kennedy (matthew.kennedy@cuanschutz.edu)
Materials Availability
Plasmids generated in this study will be made available through Addgene plasmid repository. Until Addgene catalog numbers are assigned, plasmids will be made available upon request without restriction.
Data and Code Availability
All data necessary to assess the conclusions of this work are available in the text and supplemental materials. Any additional information or raw data files are available from the lead author upon request.
Original ImageJ code for automating dually-innervated spine detections has been deposited at: https://github.com/mjkennedylab/DualSynapse
Any additional information required to reanalyze the data reported in this paper is available from the lead contact upon request.
Experimental model and subject details
We used wild-type and C57BL/6 mice (Jackson Laboratory), somatostatin-Cre mice (Jackson Laboratory, Sst-IRES-Cre 13044) and Sprague Dawley rats (Charles River). Mice were used at postnatal day 5-7 (organotypic slices) or 13-25 (perfusion fixed brains). In all experiments, data were obtained from both male and female animals in equal proportions. No influence from sex was determined. All animals were group-housed with free access to food/water in accordance with the University of Colorado Institutional Animal Care and Use Committee. 3-dimensional electron microscopy reconstructions and quantifications were performed on tissue samples prepared for previously published studies using Long-Evans rats (60-170 days old)35,36.
Method Details:
3D reconstruction from serial section electron microscopy
Animals.
All animal procedures for 3DEM were performed in accordance with the Guide for the Care and Use of Laboratory Animals of the National Institutes of Health. The animal protocols were approved by animal care and use committees at Children’s Hospital (Boston, MA), Medical College of Georgia (Augusta, GA), The University of Texas at Austin, or the Otago University Animal Ethics Committee.
All 3DEM data were collected from adult male Long-Evans rats (Charles River or Animal Breeding Station at the University of Otago). We prepared two acute hippocampal slices from two rats aged 60-61 days old that were anesthetized with halothane and decapitated. The slices (400 μm thickness) were collected from the middle third of the hippocampus and recovered in an interface chamber in artificial cerebrospinal fluid for electrophysiology recordings to induce long-term potentiation (LTP) at Schaffer collateral synapses in area CA1 as described previously37. Hippocampal slices were fixed within 1 min of the last recording in fixative (6% glutaraldehyde and 2% paraformaldehyde in 0.1 M sodium cacodylate buffer with 2 mM CaCl2 and 4 mM MgSO4), enhanced by microwave irradiation for 10 sec38. We obtained and analyzed four 3DEM data sets (two control and two LTP) from these slices. Another SR data set was collected from a rat (68 days old) that was perfusion-fixed transcardially with the same fixative under pentobarbital anesthesia. Three 3DEM data sets were obtained from SLM of two rats that were perfusion-fixed under halothane anesthesia with 2.5% glutaraldehyde and 2% formaldehyde in 0.1 M sodium cacodylate buffer with 2 mM CaCl2 and 4 mM MgSO4. One of the two animals (170 days old) underwent in vivo electrophysiology recordings to induce long-term potentiation in the middle molecular layer of the hippocampal dentate gyrus in one hemisphere, as described previously35,36. From this animal, we used a data set obtained from SLM of the control hemisphere that received only test pulses delivered to medial perforant path and did not exhibit long-term plasticity. The remaining animal (162 days old) did not undergo any prior experiments and was used to generate two SLM data sets.
Tissue Processing and Serial Sectioning.
After vibratome sectioning to 70 μm thickness, the fixed tissue containing the regions of interest underwent staining with reduced osmium (1.5% K4Fe(CN)6 and 1% OsO4 in 0.1 M sodium cacodylate buffer), followed by 1% OsO4 in the same buffer. The tissue was then stained en bloc with 1% uranyl acetate and dehydrated in a series of ethanol and propylene oxide, or in acetone. The dehydrated tissue was infiltrated with and embedded into LX-112 resin or mixture of Epon and Spurr’s resin. The resin blocks containing the tissue were trimmed to regions of interest in area CA1. Serial ultrathin sections were cut with a diamond knife (DiATOME Ultra35 or Ultra45) on a ultramicrotome and collected on Synaptek slot grids coated with Pioloform or polyetherimide substrate. Sections were stained with uranyl acetate, followed by lead citrate39 for 5 min each.
EM Imaging and Alignment.
The serial ultrathin sections from SR were imaged, blind as to condition, with a JEOL JEM-1230 transmission electron microscope (TEM) with a Gatan UltraScan4000 CCD camera at 5,000× magnification. Serial section series from SLM were imaged with a transmission-mode scanning electron microscope40 (tSEM; Zeiss Supra40) at 1.8-2.0 nm/pixel. A diffraction grating replica (Ernest Fullam, Inc., Latham, NY or Electron Microscopy Sciences, Hatfield, PA) was imaged along with the serial section series to calibrate pixel size.
SR data set from the perfusion-fixed rat was imaged as two-tile mosaics, which were then stitched using Adobe Photoshop. All SR data sets were imported into and aligned with the Reconstruct software41 (RRID:SCR_002716; https://synapseweb.clm.utexas.edu/software-0). SLM data sets were aligned first using Fiji with the TrakEM2 plugin42–44 (RRID:SCR_002285; RRID:SCR_008954; http://fiji.sc, http://www.ini.uzh.ch/~acardona/trakem2.html) and then imported into Reconstruct for analysis. Mean section thickness was calculated for each serial section series using the cylindrical diameters method by dividing the diameters of longitudinally sectioned mitochondria by the number of sections they spanned45.
Unbiased Reconstructions and Statistical Analyses.
3DEM data sets were given a five-letter code to mask the identity of experimental conditions in subsequent analyses. We used the Reconstruct software to identify and trace manually dendrites and synapses in the 3DEM data sets. Dendrites were sampled from SR and SLM based on microtubule count. We analyzed 31 oblique dendrites from SR containing 9-48 microtubules and ranging 1.83-21.41 μm in length. From SLM, we analyzed 36 dendrites with 6-48 microtubules and 6.34-21.01 μm in length. Putative inhibitory axons contacting dendritic spines were confirmed by tracing them to another symmetric synapse along the same axon. Of the 67 dendrites analyzed, 6 in SR and 12 in SLM contained one or more DiSs and 39 of 48 symmetric synapses in SR and 102 of 122 in SLM were located on dendritic shafts.
Statistical analyses were performed with GraphPad Prism, with statistical significance set at p < 0.05. We checked data for normality with Kolomogorov-Smirnov test and found only the size of symmetric synapses in SLM to be consistent with normal distribution. Thus, we used unpaired two-tailed t-test to compare DiS and shaft in this layer (Fig. S1B, SLM - symmetric). Synapse sizes in other categories were not distributed normally, so we used Kruskal-Wallis test for asymmetric synapses in SR and SLM, and Mann-Whitney test for symmetric synapses in SR (Fig. S1A,B). We pooled together the dendrite and synapse size data from all conditions in SR (i.e., control, LTP, and perfusion-fixed) since DiSs were rare in this layer in adult rat CA1. Figures and Supplemental Movie. For 3DEM data in Fig. 1, graphs were generated with Microsoft Excel or GraphPad Prism. 3D reconstructions of the traced objects were generated as Boissonnat surface in Reconstruct. Adobe Photoshop was used to adjust brightness and contrast, and in some cases sharpness, of EM images. Adobe Illustrator was used to assemble all figures.
Rotating 3D scenes of reconstructed objects (dendrites, spines, synapses, and presynaptic axons) were rendered in Reconstruct, and screen recordings were made using Open Broadcaster Software (OBS). Recorded clips were then edited together and captions were added using Adobe Premiere.
In utero electroporation, perfusion, slice preparation
All animal procedures were carried out in accordance with a protocol approved by the University of Colorado Denver Institutional Animal Care and Use Committee. Timed pregnant CD-1 IGS mice were ordered from Charles River (Strain Code 022). On gestation day 15.5, pregnant mice were anesthetized with vaporized isoflurane and administered analgesia (subcutaneous injection of meloxicam, 2 mg/kg). A small vertical midline incision was made in the skin and peritoneum, approximately 1.5-2.5 cm in length, to expose the uterine horns. Bevelled glass micropipettes were used to inject 1-2 μL of endotoxin-free plasmid DNA into the embryos’ lateral ventricles at 1 mg/mL each. For electroporation, 5 pulses separated by 950 ms were applied at 45 V, using tweezer-type electrodes connected to a square-wave electroporator (BTX ECM 830). Electrodes were oriented to direct the current toward the midline to target the hippocampal primordium. Embryos were placed back in the dam and the peritoneal and skin incisions were closed with sterile, single-use sutures (6-0 thread size with P-1 Reverse Cutting needle). Embryos were allowed to develop in utero and postnatally until the indicated ages. At the indicated ages postnatal mice were anesthetized with vaporized isoflurane and transcardially perfused with 4% PFA with additional post fix in 4% PFA overnight at 4°C. Brains were cryoprotected in 30% sucrose at 4°C overnight and sectioned on a cryostat at 20 μm.
Organotypic and dissociated culture preparation
Organotypic cultures and dissociated neurons were prepared from Sprague Dawley rats or mice as previously described46. Dissociated hippocampal neurons were prepared from P0-P1 pups. Dissociated hippocampal neurons were transfected between 14 and 18 days in vitro (DIV) with lipofectamine 2000 according to the manufacturer’s protocol. Organotypic cultures, prepared from P5-P7 rats or P2-P3 mice, were cultured for 7-18 days before biolistic transfection with plasmids encoding synaptic/morphology markers. Subsequent imaging/uncaging/whole cell patch clamp recordings were performed within 24-50 hours following biolistic transfection (between 9 and 18 days in vitro). Biolistic transfection and gold particle preparation was carried out as previously described47. In some cases, slices were infected with AAV encoding TeNT or presynaptic eGRASP components to (1) silence a subset of CA3 neurons by introducing 0.5uL of virus directly on CA3 immediately following plating or (2) to abolish GABA release from somatostatin positive interneurons by injecting 1uL of AAV-Flex-TeNTLC (gift from Hiroki Taniguchi, Max Planck Florida Institute for Neuroscience) into EP7 culture from SST-Cre mice26. Note that eGRASPpost expression is cre-dependent and a plasmid encoding cre recombinase was included in our biolistic transfections23. To achieve expression of channelrhodopsin-2, AAV1-EF1-dflox-hChR2(H134R)-mCherry-WPRE-hGH (gift from Karl Deisseroth; Addgene plasmid # 20297) was used. The age of slice culture is reported as equivalent postnatal (EP) day; postnatal day at slice culturing + days in vitro.
Adeno associated virus preparation
Sph-HT-T2A-TeNT, Flex-Sph-HT and eGRASPpre-T2A-TeNT AAV-DJ were generated as previously described48. Briefly, HEK293T cells were co-transfected with the AAV vector along with helper plasmids (pDJ and pHelper) using calcium phosphate transfection. 72 hours post-transfection cells were harvested, lysed and purified over an iodixanol gradient column (2 hours at 63,500 r.p.m. in a Beckman Type80Ti rotor). Virus was dialyzed to remove excess iodixanol and aliquoted and stored at −80°C until use.
Confocal Ca2+ imaging and 1-photon MNI-glutamate uncaging
Live cell imaging of dissociated hippocampal neurons was carried out at 34°C on an Olympus IX71 equipped with a spinning disc scan head (Yokogawa) with a 60x NA1.4 objective. Standard imaging buffer contained (mM) 10 HEPES, 130 NaCl, 5 KCl, 30 d-glucose, 2 CaCl2 and 1 MgCl2 supplemented with 1 μM TTX. For uncaging-induced spine growth and Ca2+ imaging the same buffer was used, but lacked Mg2+ to relieve NMDAR block. Excitation illumination was delivered from an AOTF controlled laser launch (Andor) and images were collected on a 1024x1024 pixel Andor iXon EM-CCD camera. Data acquisition and analysis were performed with Metamorph (Molecular Devices), Andor IQ and ImageJ software. All quantification was performed on raw images, but some images were expanded, using the smooth function in ImageJ for display only.
For glutamate uncaging experiments, we included 2 mM MNI-glutamate in the bath solution and focally stimulated the preparation using galvanometric mirrors (FRAPPA, Andor technologies) to steer a diffraction-limited 405 nm spot. An AOTF was used to gate a 500 μs pulse of 405 nm light, with the intensity adjusted to trigger an approximately quantal (10-30pA) AMPAR current. Intensities ranged from 3-4% of total laser power from a 100mW 405 nm laser that was fiber coupled to a FRAPPA laser scanning unit. NMDAR Ca2+ responses were monitored with GCaMP6s (addgene clone #40753). Cells were also transfected with GephFingRm-mScar and HT-pDisp labeled with JaneliaFluor 646 to identify DiSs. For optical quantal analysis, the frequency and amplitude of spontaneous quantal Ca2+ transients were measured at individual DiSs and SiSs as previously described25. Briefly, neurons were imaged at 5-7Hz for 2 min before and 5 min following ifenprodil (5μM, Tocris Bioscience) or at various times (30 sec to 30 min) following CGP55845 (4μM, Tocris Bioscience) addition. Quantal events measured at the same spine before and after ifenprodil treatment were averaged (anywhere between 2 and 15 events were averaged, depending on the event frequency at a given spine). For 1-photon (1P) MNI-glutamate induced spine growth, cells expressing mCh along with GephFingR-GFP were imaged to identify DiSs and neighboring SiSs. Targeted spines were stimulated with 30 uncaging pulses delivered at 1Hz (in Mg2+-free media). Spine growth was monitored in the GFP channel by imaging z-stacks every 30 sec pre- and post-uncaging.
FM dye loading
For FM4-64 experiments, dissociated hippocampal neurons (DIV 17-20) that had been sparsely infected (<50%) with AAV Sph-HT-2A-TeNT were incubated with 5μM FM4-64FX (fixable FM dye, Molecular Probes/Thermo) for 1-2 min in normal ACSF containing 10μM NBQX and 50μM APV, followed by a 30 sec exposure to ACSF containing 50mM KCl, 5μM FM4-64FX, 10μM NBQX and 50μM APV (NaCl was reduced to 80mM in this solution to maintain appropriate osmolarity). Cells were returned to normal ACSF containing 10μM NBQX, 5μM FM4-64 and 50μM APV, incubated for 5 min and then washed with ACSF lacking FM4-64FX but containing 1mM ADVASEP-7 (Sigma). Cells were fixed and processed for VAMP2 staining.
Electrophysiology
Whole-cell recordings (electrode resistance, 5-8 MΩ; series resistance, 20-40 MΩ) were performed at 30°C on gene-gun-transfected CA1 pyramidal neurons within 40 μm of the slice surface using a MultiClamp 700B amplifier (Molecular Devices). To record uncaging-evoked excitatory postsynaptic currents (uEPSCs), CA1 neurons were patched in voltage-clamp configuration (Vhold of −65 mV and +40 mV for AMPAR-mediated and NMDAR-mediated uEPSCs, respectively) using a cesium-based internal solution (135 mM Cs-methanesulfonate, 10 mM HEPES, 10 mM Na2 phosphocreatine, 4 mM MgCl2, 4 mM Na2-ATP, 0.4 mM Na-GTP, 3 mM Na L-ascorbate, 0.2 mM Alexa-Fluor 488, ~300 mOsm, ~pH 7.25) in ACSF containing 2 mM CaCl2, 1 mM MgCl2, 0.001 mM TTX, and 2.5 mM MNI-glutamate. uEPSC amplitudes from individual spines were quantified as the average (6-10 test pulses of 1 ms duration at 0.1 Hz) from a 2-ms window centered on the maximum current amplitude after uncaging pulse delivery for AMPA currents and from a 10-ms window between 70 and 80 ms after stimulus for NMDA currents. Laser pulses for uEPSCs were delivered by parking the beam at a point ~0.5 μm from the center of the spine head (720 nm; 14-15 mW at the sample). Inhibitory postsynaptic currents evoked by two-photon GABA uncaging (uIPSCs) were recorded by patching CA1 pyramidal neurons in the voltage-clamp configuration (Vhold of + 10 mV) using a cesium-based internal solution in ACSF containing 2 mM CaCl2, 1 mM MgCl2, 0.001 mM TTX, and 0.35 mM RuBi-GABA. Two-photon laser (810 nm) was delivered at a distance of ~0.5 μm from the center of the spine head at a power of 18-20 mW for a duration of 3 ms with a pulsed Ti::sapphire laser (MaiTai HP, Spectra-Physics). uIPSC amplitudes were quantified as the average (6-10 test pulses at 0.1 Hz) from a 2-ms window centered on the maximum current amplitude within 50 ms after delivery of an uncaging pulse. To assess the role of GABABRs in the reduction of NMDAR currents at DiSs, two-color, two-photon uncaging was employed. NMDAR-uEPSCs were acquired in ACSF (2 mM CaCl2, 1 mM MgCl2, 0.001 mM TTX, 2.5 mM MNI-glutamate, and 0.35 mM RuBi-GABA; Vhold of +40 mV) from one DiS and one neighboring SiS on the same cell. After a short baseline of NMDAR-uEPSCs, GABA HFU was delivered at the DiS and SiS while the cell was stepped from +40 to −65 mV. Post-GABA HFU NMDAR-uEPSCs were recorded at +40 mV from both DiS and SiS 4-5 min after GABA HFU. GABA high-frequency uncaging (GABA HFU) stimuli consisted of 60 pulses (810 nm; 14-15 mW at the sample) of 2 ms duration delivered at 10 Hz by parking the beam at a point ~0.5 μm from the center of the spine head. Signals were digitized at 10 kHz and responses were analyzed using Clampfit 10.3 (Molecular Devices) and OriginPro 8.5 software (OriginLab).
Two-photon imaging and high-frequency glutamate uncaging
Imaging was performed at 11-18 days in vitro (DIV) on transfected CA1 pyramidal neurons within 40 μm of the slice surface at 30°C in recirculating artificial CSF (ACSF) (127 mM NaCl 25 mM NaHCO3, 1.25 mM NaH2PO4, 2.5 mM KCl, 25 mM D-glucose, aerated with 95% O2/5% CO2) with 2 mM CaCl2, 1 mM MgCl2 and 0.001 mM tetrodotoxin (TTX). For each neuron, image stacks (512 × 512 pixels; 0.047 μm / pixel) with 1-μm z-steps were collected from one segment of secondary or tertiary distal apical dendrites using a two-photon (2P) microscope (Bruker Nano, Inc) with a pulsed Ti::sapphire laser (MaiTai HP; Spectra Physics) tuned to 920 nm (4-5 mW at the sample). For time-lapse imaging, slices were imaged at 2 or 5 min intervals at 30°C in recirculating ACSF. All images shown are maximal projections of three-dimensional image stacks after applying a median filter (2 × 2) to the raw image data. Two-photon uncaging was achieved as described26. In brief, LTP-inducing high-frequency 2P glutamate uncaging stimulus (Glu HFU) consisted of 30 pulses (720 nm; 15-18 mW at the sample) of 5 ms duration delivered at 1 Hz by parking the beam at a point ~0.5 μm from the center of the spine head with a pulsed Ti::sapphire laser (MaiTai HP, Spectra-Physics) in at 30 °C in ACSF containing (in mM): 3 Ca2+, 0 Mg2+, 0.001 TTX, and 2.5 mM MNI-glutamate49. No more than two Glu HFU trials were performed from the same neuron.
Optogenetic IPSCs
Optically evoked IPSCs (oIPSCs) were recorded by patching CA1 pyramidal neurons in SST-Cre hippocampal slices infected with AAV1-EF1-dflox-hChR2(H134R)-mCherry-WPRE-hGH or co-infected with AAV1-EF1-dflox-hChR2(H134R)-mCherry-WPRE-hGH and AAV-Flex-TeNTLC. Voltage-clamp configuration (Vhold of +10 mV) was achieved using a cesium-based internal solution in ACSF containing 2 mM CaCl2, 1 mM MgCl2. oIPSCs were evoked by full-field illumination (100ms, 470nm, 7-8mW, Thorlabs) and quantified as the average (10 pulses at 0.2 Hz) of maximum current amplitude within 50ms after delivery of a blue light pulse.
Pharmacology
Stocks were prepared at 1,000 × (or greater) by dissolving Tetrodotoxin citrate, (R)-CPP, and Bicuculline methochloride in water; CGP55845 in DMSO. All drugs were from Tocris unless otherwise noted.
Quantification and Statistical Analyses
Image analysis and quantification
Estimated spine volume and gephyrin enrichment on dendritic spines were measured in fluorescence images from red (tdTomato) and green (GFP) channels using ImageJ (NIH). Integrated fluorescence intensities were calculated from background-subtracted and bleed-through-corrected red and green fluorescence using the integrated pixel intensity of a boxed region (ROI) surrounding the spine head, as described previously8,26. Gephyrin enrichment in DiS was calculated by normalizing GFP-gephyrin fluorescence intensities (as described above) for each punctum to the mean GFP fluorescence intensity determined from four background ROIs on the same dendritic shaft. GFP-gephyrin enrichment was considered to be a gephyrin punctum when the ratio of green from a punctum of DiS to green from dendritic background (Gs/Gd) was > 1. “DiS” (expression level > mean; Gs/Gd > 1) versus “SiS” (expression level < mean; Gs/Gd < 1). https://github.com/mjkennedylab/DualSynapse
Uncaging evoked IPSCs and EPSCs
uEPSC amplitudes from individual spines were quantified as the average (6-10 test pulses of 1 ms duration at 0.1 Hz) from a 2-ms window centered on the maximum current amplitude after uncaging pulse delivery for AMPA currents and from a 10-ms window between 70 and 80 ms after stimulus for NMDA currents. uIPSC amplitudes were quantified as the average (6-10 test pulses at 0.1 Hz) from a 2-ms window centered on the maximum current amplitude within 50 ms after delivery of an uncaging pulse.
Optogenetically evoked IPSCs
oIPSCs were evoked by full-field illumination (100ms, 470nm, 7-8mW, Thorlabs) and quantified as the average (10 pulses at 0.2 Hz) of maximum current amplitude within 50ms after delivery of a blue light pulse. Data from at least three independent slice culture preparations were used for two-photon imaging experiments.
Statistical analyses
All electrophysiology, staining and calcium imaging data were analyzed in Graphpad Prism. Generally, we used Student’s t-test for comparisons between groups unless otherwise noted in figure legends with statistical significance set at p < 0.05. In cases where data were compared from the same cell/synapse pre/post treatment, we used paired Student’s t-test, as noted in the figure legends. Values for technical and experimental replicates are listed in the figure legends. For serial reconstruction EM data, we checked data for normality with Kolomogorov-Smirnov test and found only the size of symmetric synapses in SLM to be consistent with normal distribution. Thus, we used unpaired two-tailed t-test to compare DiS and shaft in this layer (Fig. S1B, SLM - symmetric). Synapse sizes in other categories were not distributed normally, so we used Kruskal-Wallis test for asymmetric synapses in SR and SLM, and Mann-Whitney test for symmetric synapses in SR (Fig. S1A,B). We pooled together the dendrite and synapse size data from all conditions in SR (i.e., control, LTP, and perfusion-fixed) since DiSs were rare in this layer in adult rat CA1.
Supplementary Material
Supplementary Video 1: Segmented serial reconstruction of dually innervated spines in hippocampus stratum radiatum, Related to Figure 1.
Key resources table
| REAGENT or RESOURCE | SOURCE | IDENTIFIER |
|---|---|---|
| Antibodies | ||
| Guinea pig polyclonal anti-vGAT | Synaptic Systems | Cat #131004; RRID:AB_887873 |
| Mouse monoclonal anti-Synaptobrevin 2 (Vamp2) | Synaptic Systems | Cat #; 104211 RRID:AB_2619758 |
| Guinea pig polyclonal anti-GABAAR γ2 | Synaptic Systems | Cat #; 224004 RRID:AB_10594245 |
| Mouse monoclonal anti GABAB receptor | Neuromab | Cat #N39A/49 |
| Goat anti-Mouse IgG H&L Alexa Fluor 647 | Invitrogen | Cat #; A-21236 RRID:AB_2535805 |
| Goat anti-Guinea pig IgG H&L Alexa Fluor 647 | Abcam | Cat #; ab150187 RRID:AB_2827756 |
| Goat anti-Guinea pig IgG H&L Alexa Fluor 405 | Abcam | Cat #; ab175678 RRID:AB_2827755 |
| Bacterial and virus strains | ||
| AAV DJ-Sph-HT-T2A-TeNTLC | This paper | N/A |
| AAV DJ-Flex-Sph-HT | This paper | N/A |
| AAV DJ-eGRASPpre-T2A-TeNTLC | This paper | N/A |
| AAV 1-EF1-dflox-hChR2(h134R)-mCherry-WPRE-hGH | Gift from Karl Deisseroth | Addgene Viral prep #20297-AAV1 |
| AAV DJ-Flex-TeNTLC | Oh, W.C. et al 26 | N/A |
| Biological samples | ||
| Chemicals, peptides, and recombinant proteins | ||
| JF646-Halotag ligand | HHMI Janelia Materials | https://janeliamaterials.azurewebsites.net/ |
| Ifenprodil | Tocris Bioscience | #0545 |
| CGP55845 | Tocris Bioscience | #1248 |
| Tetrodotoxin citrate | Tocris Bioscience | #1069 |
| (R)-CPP | Tocris Bioscience | #0247 |
| Bicuculline methochloride | Tocris Bioscience | #2503 |
| NBQX disodium salt | Tocris Bioscience | #0373 |
| DL-AP5 sodium salt | Tocris Bioscience | #3693 |
| Advasep-7 | Sigma | #A3723 |
| MNI-glutamate | Tocris Bioscience | #1490 |
| RuBi-GABA | Tocris Bioscience | #3574 |
| FM4-64 | Molecular Probes/Thermo | Invitrogen #F34653 |
| Critical commercial assays | ||
| Deposited data | ||
| Experimental models: Cell lines | ||
| Experimental models: Organisms/strains | ||
| Mouse: C57BL/6J | Jackson Laboratory | Strain 000664 RRID:IMSR_JAX:000664 |
| Mouse: Somatostatin-Cre | Jackson Laboratory | Sst-IRES-Cre, strain 13044 RRID:IMSR_JAX:013044 |
| Rat: Sprague Dawley | Charles River | Cr1:CD(SD)BR; RRID: RGD_734476 |
| Mouse: CD-1 IGS | Charles River | Crl:CD1(ICR) Strain Code 022 |
| Oligonucleotides | ||
| Recombinant DNA | ||
| pGP-CMV-GCaMP6s | Chen et al. 24 | Addgene Cat #40753 |
| PSD95-FingR-GFP | Gross et al. 15 | Addgene Cat #46295 |
| Gephyrin-FingR-mScarlet | This paper | N/A |
| HaloTag-pDisplay | This paper | N/A |
| EWB-DIO-myrTagRFP-T-P2A-post-eGRASP | Choi et al. 23 | Addgene Cat #111581 |
| Gephyrin-FingR-GFP | Gross et al. 15 | Addgene Cat #46296 |
| FCtdT-Cre | This paper | N/A |
| Software and algorithms | ||
| Reconstruct Software | Fiala, J.C. 41 | https://synapseweb.clm.utexas.edu/software-0 |
| Fiji | Schindelin, J. et al. 43 | RRID:SCR_002285 |
| Metamorph | Molecular Devices | https://www.moleculardevices.com/systems/metamorph-research-imaging/metamorph-microscopy-automation-and-image-analysis-software |
| ImageJ | National Institute of Health | https://imagej.nih.gov/ij/ |
| DualSynapse analysis software | This paper | https://github.com/mjkennedylab/DualSynapse |
| TrakEM2 | Cardona, A. et al. 42 | RRID:SCR_008954 |
| GraphPad Prism | www.graphpad.com | Prism Version 9.0.1 |
| Clampfit 10.3 | Molecular Devices | https://www.moleculardevices.com/ |
| OriginPro 8.5 | OriginLab | https://www.originlab.com/ |
| Open Broadcaster Software | OBS Studio Contributors | https://obsproject.com |
| Other | ||
| 1.6μm gold particles | Biorad | #1652264 |
Highlights:
DiSs develop early in spinogenesis, independent of excitatory input
DiSs have reduced structural plasticity compared to SiSs
Reduced DiS plasticity is mediated through GABABR/NMDAR crosstalk
Reduced plasticity may contribute to long term stability of DiSs
Acknowledgements:
We thank Mark Dell’Acqua and Christopher Ford for critical discussions; Jonathan E. Tullis for script development; Hannah Actor-Engel for 3D reconstructions, John Mendenhall, Clayton Smith, Libby Perry, and Robert Smith for preparation of 3DEM data sets; Jennifer Bourne, Michael Chirillo, Katherine Dembny, Corey Haines, Alyssa Herbort, Matthew Hooper, Zean Luna, Jordan Mackey, Patrick Parker, and Kyle Zatyko for manual tracing 3DEM datasets. Funding sources include NIGMS T32GM007635 (D.K.); NIA F32 AG071073 (O.P.); NINDS R35NS116879, UF1NS107710, NS110383 (M.J.K), T32NS099042 (R.O.); NICHD F31HD106632 (R.O.); NIMH R01MH124778 and R21MH126073 (W.C.O.), 5R56MH095980-07 (K.M.H.); Brain and Behavioral Research Foundation (W.C.O.); Brain Research Foundation (W.C.O.); CSU/CU-Pilot Collaboration Award (W.C.O.); National Center for Advancing Translational Sciences UL1TR002535, Boettcher Foundation and Children’s Hospital Colorado Program in Pediatric Stem Cell Biology (S.F.); NSF 1707356 and 2014862 (K.M.H.).
Footnotes
Publisher's Disclaimer: This is a PDF file of an unedited manuscript that has been accepted for publication. As a service to our customers we are providing this early version of the manuscript. The manuscript will undergo copyediting, typesetting, and review of the resulting proof before it is published in its final form. Please note that during the production process errors may be discovered which could affect the content, and all legal disclaimers that apply to the journal pertain.
Declaration of Interests
The authors declare no competing interests.
Inclusion and Diversity
We support inclusive, diverse and equitable conduct of research.
Bibliography
- 1.Kubota Y, Hatada S, Kondo S, Karube F, and Kawaguchi Y (2007). Neocortical inhibitory terminals innervate dendritic spines targeted by thalamocortical afferents. The Journal of neuroscience : the official journal of the Society for Neuroscience 27, 1139–1150. 10.1523/JNEUROSCI.3846-06.2007. [DOI] [PMC free article] [PubMed] [Google Scholar]
- 2.Wilson CJ, Groves PM, Kitai ST, and Linder JC (1983). Three-dimensional structure of dendritic spines in the rat neostriatum. The Journal of neuroscience : the official journal of the Society for Neuroscience 3, 383–388. 10.1523/JNEUROSCI.03-02-00383.1983. [DOI] [PMC free article] [PubMed] [Google Scholar]
- 3.Chiu CQ, Lur G, Morse TM, Carnevale NT, Ellis-Davies GCR, and Higley MJ (2013). Compartmentalization of GABAergic inhibition by dendritic spines. Science (New York, N.Y.) 340, 759–762. 10.1126/science.1234274. [DOI] [PMC free article] [PubMed] [Google Scholar]
- 4.Gemin O, Serna P, Zamith J, Assendorp N, Fossati M, Rostaing P, Triller A, and Charrier C (2021). Unique properties of dually innervated dendritic spines in pyramidal neurons of the somatosensory cortex uncovered by 3D correlative light and electron microscopy. PLoS biology 19, e3001375–e3001375. 10.1371/journal.pbio.3001375. [DOI] [PMC free article] [PubMed] [Google Scholar]
- 5.Iascone DM, Li Y, Sümbül U, Doron M, Chen H, Andreu V, Goudy F, Blockus H, Abbott LF, Segev I, et al. (2020). Whole-Neuron Synaptic Mapping Reveals Spatially Precise Excitatory/Inhibitory Balance Limiting Dendritic and Somatic Spiking. Neuron 106, 566–578.e568. 10.1016/j.neuron.2020.02.015. [DOI] [PMC free article] [PubMed] [Google Scholar]
- 6.Isshiki M, Tanaka S, Kuriu T, Tabuchi K, Takumi T, and Okabe S (2014). Enhanced synapse remodelling as a common phenotype in mouse models of autism. Nature communications 5, 4742–4742. 10.1038/ncomms5742. [DOI] [PubMed] [Google Scholar]
- 7.Chen JL, Villa KL, Cha JW, So PTC, Kubota Y, and Nedivi E (2012). Clustered dynamics of inhibitory synapses and dendritic spines in the adult neocortex. Neuron 74, 361–373. 10.1016/j.neuron.2012.02.030. [DOI] [PMC free article] [PubMed] [Google Scholar]
- 8.Villa KL, Berry KP, Subramanian J, Cha JW, Oh WC, Kwon H-B, Kubota Y, So PTC, and Nedivi E (2016). Inhibitory Synapses Are Repeatedly Assembled and Removed at Persistent Sites In Vivo. Neuron 89, 756–769. 10.1016/j.neuron.2016.01.010. [DOI] [PMC free article] [PubMed] [Google Scholar]
- 9.Knott GW, Quairiaux C, Genoud C, and Welker E (2002). Formation of dendritic spines with GABAergic synapses induced by whisker stimulation in adult mice. Neuron 34, 265–273. 10.1016/s0896-6273(02)00663-3. [DOI] [PubMed] [Google Scholar]
- 10.Matsuzaki M, Honkura N, Ellis-Davies GC, and Kasai H (2004). Structural basis of long-term potentiation in single dendritic spines. Nature 429, 761–766. 10.1038/nature02617 nature02617 [pii]. [DOI] [PMC free article] [PubMed] [Google Scholar]
- 11.Yang Y, Wang XB, Frerking M, and Zhou Q (2008). Spine expansion and stabilization associated with long-term potentiation. J Neurosci 28, 5740–5751. 28/22/5740 [pii] 10.1523/JNEUROSCI.3998-07.2008. [DOI] [PMC free article] [PubMed] [Google Scholar]
- 12.Chalifoux JR, Neuron, A.G.C., and Undefined (2010). GABAB receptors modulate NMDA receptor calcium signals in dendritic spines. Elsevier 66, 101–113. [DOI] [PMC free article] [PubMed] [Google Scholar]
- 13.Hayama T, Noguchi J, Watanabe S, Takahashi N, Hayashi-Takagi A, Ellis-Davies GCR, Matsuzaki M, and Kasai H (2013). GABA promotes the competitive selection of dendritic spines by controlling local Ca2+ signaling. Nature neuroscience 16, 1409–1416. 10.1038/nn.3496. [DOI] [PMC free article] [PubMed] [Google Scholar]
- 14.Lur G, and Higley MJ (2015). Glutamate Receptor Modulation Is Restricted to Synaptic Microdomains. Cell reports 12, 326–334. 10.1016/j.celrep.2015.06.029. [DOI] [PMC free article] [PubMed] [Google Scholar]
- 15.Gross GG, Junge JA, Mora RJ, Kwon H-B, Olson CA, Takahashi TT, Liman ER, Ellis-Davies GCR, McGee AW, Sabatini BL, et al. (2013). Recombinant probes for visualizing endogenous synaptic proteins in living neurons. Neuron 78, 971–985. 10.1016/j.neuron.2013.04.017. [DOI] [PMC free article] [PubMed] [Google Scholar]
- 16.Grimm JB, English BP, Chen J, Slaughter JP, Zhang Z, Revyakin A, Patel R, Macklin JJ, Normanno D, Singer RH, et al. (2015). A general method to improve fluorophores for live-cell and single-molecule microscopy. Nature Methods 12, 244–250. 10.1038/nmeth.3256. [DOI] [PMC free article] [PubMed] [Google Scholar]
- 17.Hazan L, and Ziv NE (2020). Activity dependent and independent determinants of synaptic size diversity. Journal of Neuroscience 40. 10.1523/JNEUROSCI.2181-19.2020. [DOI] [PMC free article] [PubMed] [Google Scholar]
- 18.Lee MC, Yasuda R, and Ehlers MD (2010). Metaplasticity at single glutamatergic synapses. Neuron 66, 859–870. 10.1016/j.neuron.2010.05.015. [DOI] [PMC free article] [PubMed] [Google Scholar]
- 19.Liu Q, Sinnen BL, Boxer EE, Schneider MW, Grybko MJ, Buchta WC, Gibson ES, Wysoczynski CL, Ford CP, Gottschalk A, et al. (2019). A Photoactivatable Botulinum Neurotoxin for Inducible Control of Neurotransmission. Neuron 101, 863–875.e866. 10.1016/j.neuron.2019.01.002. [DOI] [PMC free article] [PubMed] [Google Scholar]
- 20.Sando R, Bushong E, Zhu Y, Huang M, Considine C, Phan S, Ju S, Uytiepo M, Ellisman M, and Maximov A (2017). Assembly of Excitatory Synapses in the Absence of Glutamatergic Neurotransmission. Neuron 94, 312–321.e313. 10.1016/j.neuron.2017.03.047. [DOI] [PMC free article] [PubMed] [Google Scholar]
- 21.Sigler A, Oh WC, Imig C, Altas B, Kawabe H, Cooper BH, Kwon H-B, Rhee J-S, and Brose N (2017). Formation and Maintenance of Functional Spines in the Absence of Presynaptic Glutamate Release. Neuron 94, 304–311.e304. 10.1016/j.neuron.2017.03.029. [DOI] [PMC free article] [PubMed] [Google Scholar]
- 22.Zhu Y, Uytiepo M, Bushong E, Haberl M, Beutter E, Scheiwe F, Zhang W, Chang L, Luu D, Chui B, et al. (2021). Nanoscale 3D EM reconstructions reveal intrinsic mechanisms of structural diversity of chemical synapses. Cell Reports 35. 10.1016/j.celrep.2021.108953. [DOI] [PMC free article] [PubMed] [Google Scholar]
- 23.Choi J-H, Sim S-E, Kim J-I, Choi DI, Oh J, Ye S, Lee J, Kim T, Ko H-G, Lim C-S, and Kaang B-K (2018). Interregional synaptic maps among engram cells underlie memory formation. Science (New York, N.Y.) 360, 430–435. 10.1126/science.aas9204. [DOI] [PubMed] [Google Scholar]
- 24.Chen T-W, Wardill TJ, Sun Y, Pulver SR, Renninger SL, Baohan A, Schreiter ER, Kerr RA, Orger MB, Jayaraman V, et al. (2013). Ultrasensitive fluorescent proteins for imaging neuronal activity. Nature 499, 295–300. 10.1038/nature12354. [DOI] [PMC free article] [PubMed] [Google Scholar]
- 25.Sinnen BL, Bowen AB, Gibson ES, and Kennedy MJ (2016). Local and use-dependent effects of β-Amyloid oligomers on NMDA receptor function revealed by optical quantal analysis. Journal of Neuroscience 36. 10.1523/JNEUROSCI.1603-16.2016. [DOI] [PMC free article] [PubMed] [Google Scholar]
- 26.Oh WC, Lutzu S, Castillo PE, and Kwon H-B (2016). De novo synaptogenesis induced by GABA in the developing mouse cortex. Science (New York, N.Y.) 353, 1037–1040. 10.1126/science.aaf5206. [DOI] [PMC free article] [PubMed] [Google Scholar]
- 27.Kulik A, Vida I, Luján R, Haas CA, López-Bendito G, Shigemoto R, and Frotscher M (2003). Subcellular localization of metabotropic GABA(B) receptor subunits GABA(B1a/b) and GABA(B2) in the rat hippocampus. The Journal of neuroscience : the official journal of the Society for Neuroscience 23, 11026–11035. 10.1523/JNEUROSCI.23-35-11026.2003. [DOI] [PMC free article] [PubMed] [Google Scholar]
- 28.Bettler B, Kaupmann K, Mosbacher J, and Gassmann M (2004). Molecular structure and physiological functions of GABA(B) receptors. Physiol Rev 84, 835–867. 10.1152/physrev.00036.2003. [DOI] [PubMed] [Google Scholar]
- 29.Xu C, Zhang W, Rondard P, Pin JP, and Liu J (2014). Complex GABAB receptor complexes: how to generate multiple functionally distinct units from a single receptor. Front Pharmacol 5, 12. 10.3389/fphar.2014.00012. [DOI] [PMC free article] [PubMed] [Google Scholar]
- 30.Murphy JA, Stein IS, Lau CG, Peixoto RT, Aman TK, Kaneko N, Aromolaran K, Saulnier JL, Popescu GK, Sabatini BL, et al. (2014). Phosphorylation of Ser1166 on GluN2B by PKA Is Critical to Synaptic NMDA Receptor Function and Ca 2+ Signaling in Spines. The Journal of Neuroscience 34, 869–879. 10.1523/JNEUROSCI.4538-13.2014. [DOI] [PMC free article] [PubMed] [Google Scholar]
- 31.Tingley WG, Ehlers MD, Kameyama K, Doherty C, Ptak JB, Riley CT, and Huganir RL (1997). Characterization of protein kinase A and protein kinase C phosphorylation of the N-methyl-D-aspartate receptor NR1 subunit using phosphorylation site-specific antibodies. The Journal of biological chemistry 272, 5157–5166. 10.1074/jbc.272.8.5157. [DOI] [PubMed] [Google Scholar]
- 32.Lin Y, Jover-Mengual T, Wong J, Bennett MV, and Zukin RS (2006). PSD-95 and PKC converge in regulating NMDA receptor trafficking and gating. Proc Natl Acad Sci U S A 103, 19902–19907. 10.1073/pnas.0609924104. [DOI] [PMC free article] [PubMed] [Google Scholar]
- 33.Zheng X, Zhang L, Wang AP, Bennett MV, and Zukin RS (1999). Protein kinase C potentiation of N-methyl-D-aspartate receptor activity is not mediated by phosphorylation of N-methyl-D-aspartate receptor subunits. Proc Natl Acad Sci U S A 96, 15262–15267. 10.1073/pnas.96.26.15262. [DOI] [PMC free article] [PubMed] [Google Scholar]
- 34.Attardo A, Fitzgerald JE, and Schnitzer MJ (2015). Impermanence of dendritic spines in live adult CA1 hippocampus. Nature 523, 592–596. 10.1038/nature14467. [DOI] [PMC free article] [PubMed] [Google Scholar]
- 35.Bowden JB, Abraham WC, and Harris KM (2012). Differential effects of strain, circadian cycle, and stimulation pattern on LTP and concurrent LTD in the dentate gyrus of freely moving rats. Hippocampus 22, 1363–1370. 10.1002/hipo.20972. [DOI] [PMC free article] [PubMed] [Google Scholar]
- 36.Bromer C, Bartol TM, Bowden JB, Hubbard DD, Hanka DC, Gonzalez PV, Kuwajima M, Mendenhall JM, Parker PH, Abraham WC, et al. (2018). Long-term potentiation expands information content of hippocampal dentate gyrus synapses. Proceedings of the National Academy of Sciences of the United States of America 115, E2410–E2418. 10.1073/pnas.1716189115. [DOI] [PMC free article] [PubMed] [Google Scholar]
- 37.Bourne JN, and Harris KM (2011). Coordination of size and number of excitatory and inhibitory synapses results in a balanced structural plasticity along mature hippocampal CA1 dendrites during LTP. Hippocampus 21, 354–373. 10.1002/hipo.20768. [DOI] [PMC free article] [PubMed] [Google Scholar]
- 38.Jensen FE, and Harris KM (1989). Preservation of neuronal ultrastructure in hippocampal slices using rapid microwave-enhanced fixation. Journal of Neuroscience Methods 29, 217–230. 10.1016/0165-0270(89)90146-5. [DOI] [PubMed] [Google Scholar]
- 39.Reynolds ES (1963). THE USE OF LEAD CITRATE AT HIGH pH AS AN ELECTRON-OPAQUE STAIN IN ELECTRON MICROSCOPY. Journal of Cell Biology 17, 208–212. 10.1083/jcb.17.1.208. [DOI] [PMC free article] [PubMed] [Google Scholar]
- 40.Kuwajima M, Mendenhall JM, Lindsey LF, and Harris KM (2013). Automated Transmission-Mode Scanning Electron Microscopy (tSEM) for Large Volume Analysis at Nanoscale Resolution. PLoS ONE 8, e59573–e59573. 10.1371/journal.pone.0059573. [DOI] [PMC free article] [PubMed] [Google Scholar]
- 41.Fiala JC (2005). Reconstruct: a free editor for serial section microscopy. Journal of Microscopy 218, 52–61. 10.1111/j.1365-2818.2005.01466.x. [DOI] [PubMed] [Google Scholar]
- 42.Cardona A, Saalfeld S, Schindelin J, Arganda-Carreras I, Preibisch S, Longair M, Tomancak P, Hartenstein V, and Douglas RJ (2012). TrakEM2 Software for Neural Circuit Reconstruction. PLoS ONE 7, e38011–e38011. 10.1371/journal.pone.0038011. [DOI] [PMC free article] [PubMed] [Google Scholar]
- 43.Schindelin J, Arganda-Carreras I, Frise E, Kaynig V, Longair M, Pietzsch T, Preibisch S, Rueden C, Saalfeld S, Schmid B, et al. (2012). Fiji: an open-source platform for biological-image analysis. Nature Methods 9, 676–682. 10.1038/nmeth.2019. [DOI] [PMC free article] [PubMed] [Google Scholar]
- 44.Saalfeld S, Fetter R, Cardona A, and Tomancak P (2012). Elastic volume reconstruction from series of ultra-thin microscopy sections. Nature Methods 9, 717–720. 10.1038/nmeth.2072. [DOI] [PubMed] [Google Scholar]
- 45.Fiala JC, and Harris KM (2001). Cylindrical diameters method for calibrating section thickness in serial electron microscopy. Journal of Microscopy 202, 468–472. 10.1046/j.1365-2818.2001.00926.x. [DOI] [PubMed] [Google Scholar]
- 46.Stoppini L, Buchs PA, and Muller D (1991). A simple method for organotypic cultures of nervous tissue. Journal of Neuroscience Methods 37, 173–182. 10.1016/0165-0270(91)90128-M. [DOI] [PubMed] [Google Scholar]
- 47.Woods G, and Zito K (2008). Preparation of gene gun bullets and biolistic transfection of neurons in slice culture. Journal of visualized experiments : JoVE. 10.3791/675. [DOI] [PMC free article] [PubMed] [Google Scholar]
- 48.Aoto J, Martinelli DC, Malenka RC, Tabuchi K, and Sudhof TC (2013). Presynaptic neurexin-3 alternative splicing trans-synaptically controls postsynaptic AMPA receptor trafficking. Cell 154, 75–88. 10.1016/j.cell.2013.05.060. [DOI] [PMC free article] [PubMed] [Google Scholar]
- 49.Kim J, Lee S, Jung K, Oh WC, Kim N, Son S, Jo Y, Kwon H-B, and Heo WD (2019). Intensiometric biosensors visualize the activity of multiple small GTPases in vivo. Nature Communications 10, 211–211. 10.1038/s41467-018-08217-3. [DOI] [PMC free article] [PubMed] [Google Scholar]
Associated Data
This section collects any data citations, data availability statements, or supplementary materials included in this article.
Supplementary Materials
Supplementary Video 1: Segmented serial reconstruction of dually innervated spines in hippocampus stratum radiatum, Related to Figure 1.
Data Availability Statement
All data necessary to assess the conclusions of this work are available in the text and supplemental materials. Any additional information or raw data files are available from the lead author upon request.
Original ImageJ code for automating dually-innervated spine detections has been deposited at: https://github.com/mjkennedylab/DualSynapse
Any additional information required to reanalyze the data reported in this paper is available from the lead contact upon request.