

Abstract
Objective
To evaluate the clinical characteristics and prognosis of systemic lupus erythematosus (SLE) with persistent inflammation–immunosuppression–catabolism syndrome (PICS).
Methods
We retrospectively analyzed patients with SLE who were admitted to the renal intensive care unit (ICU) for over 14 days at Jinling Hospital from July 2010 to July 2018. According to the diagnostic criteria of PICS, we divided the SLE patients into a PICS group and a non-PICS group. We performed a multivariate Cox regression analysis on the risk factors for death in these two groups by comparing the clinical features and prognosis.
Results
A total of 96 SLE patients met the inclusion and exclusion criteria of this study, including 61 patients in the PICS group and 35 patients in the non-PICS group. The PICS group patients required a longer length of stay in ICU with higher inflammatory indicators (such as C-reactive protein, procalcitonin and interleukin-6) and lower immune levels (such as total, CD3 + , CD4 + , CD8 + and CD20 + lymphocytes) compared to the non-PICS group patients (P < 0.01). Hemoglobin, platelets, serum creatinine, serum blood urea nitrogen and SLE Disease Activity Index (SLE-DAI) score in the PICS group were lower than those in the non-PICS group (P < 0.05), suggesting severe hematological injury in the PICS group and relatively severe renal damage in the non-PICS group. The rates of PICS combined with sepsis, acute respiratory distress syndrome, mechanical ventilation, gram-positive bacteria, gram-negative bacteria, fungi and double infections were higher than those in the non-PICS group (P < 0.05). The 3-year survival rate was 50.82% in the PICS group and 85.71% in the non-PICS group. The 3-year renal survival rate was 32.79% in the PICS group and 51.43% in the non-PICS group. Multivariate Cox regression found that the total lymphocyte count during ICU admission was an independent risk factor for death in SLE patients with PICS.
Conclusion
Patients with SLE complicated with PICS had longer ICU stays, a lower level of SLE activity, a higher risk of secondary infection and a significantly lower survival rate than non-PICS patients.
Keywords: Systemic lupus erythematosus, Persistent inflammation–immunosuppression–catabolism syndrome, Chronic critical illness
Introduction
Severe systemic lupus erythematosus (SLE) progresses rapidly and involves multiple organs, requiring treatments such as high-dose glucocorticoids, combined immunosuppressants [1], plasma exchange [2] and even stem cell transplantation [3, 4]. These patients are a high-risk group for secondary immune deficiency and infection [5], and they usually undergo anti-infection, anti-shock, continuous blood purification, mechanical ventilation and parenteral nutrition during ICU treatment. When lupus is active again after the infection has improved, immunosuppressant induction therapy is resumed, requiring long-term medical support and care. With the progress of critical care treatment, most ICU patients can survive early critical illness, and the 28-day mortality rate decreases significantly. However, long-term follow-up shows that some patients develop chronic critical illness, and the 1-year mortality rate exceeds 50% [6]. The clinical features of these patients have been described in the literature as ICU-acquired weakness, immune paralysis and chronic critical illness. In 2012, a new concept of persistent inflammation–immunosuppression–catabolism syndrome (PICS) was proposed to summarize the characteristics of these patients in surgical ICU [7]. Since the application of immunosuppressants in SLE patients, the remission rates have increased and renal relapse has decreased, but there is no improvement in overall and cause-specific mortality [8]. SLE patients are at an increased risk of mortality from infection and cardiovascular disease [9]. Similar to those surgical ICU patients with severe acute pancreatitis, trauma, and tumors, recurrent organ injuries and infections in severe SLE patients can also prolong ICU stay, leading to malnutrition and difficulty in returning to functional life. Patients with PICS in the course of SLE treatment are complicated with multiple organ dysfunction, thus requiring the risk of SLE control and secondary infection to be considered. Treatment is difficult, and the prognosis is poor, which requires urgent attention in clinical practice. Therefore, the present study retrospectively analyzed the clinical characteristics and prognosis of SLE complicated with PICS, as well as the risk factors affecting prognosis.
Materials and methods
Patients
Among 4668 patients admitted to the renal ICU of our center from July 2010 to July 2018, 96 SLE patients with ICU duration > 14 days were involved. All patients met the diagnostic criteria of SLE as revised by the American College of Rheumatology (ACR) in 1997 and had renal damage. The exclusion criteria were as follows: (1) age < 18 or > 70; (2) regular dialysis started in CKD5 stage; and (3) loss to follow-up. The following diagnostic criteria for PICS were developed based on previous literature [10]: (1) length of ICU stays > 14 days; (2) C-reactive protein (CRP) > 50 mg/L; (3) total lymphocyte count (TLC) < 0.8 × 10⁹/L; (4) serum albumin (Alb) < 30 g/L; and (5) weight loss > 10% or body mass index (BMI) < 18 kg/m2 during hospitalization. The enrolled patients were divided into two groups as follows: PICS group (61 SLE patients with PICS) and non-PICS group (35 SLE patients without PICS) (Fig. 1). This study was conducted in compliance with the Declaration of Helsinki principles and approved by the Ethical Committee of Nanjing Jinling Hospital. Informed consent from the patients was waived due to the retrospective nature of the study.
Fig. 1.
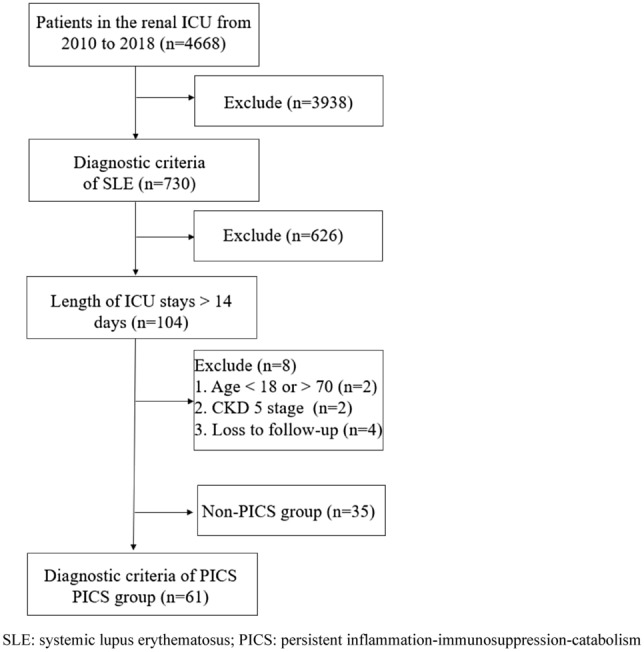
Screening process for SLE patients with PICS. SLE systemic lupus erythematosus, PICS persistent inflammation–immunosuppression–catabolism syndrome, ICU intensive care unit
Clinical and laboratory data
Age, sex, length of ICU stay, history of SLE, renal biopsy pathology, organ damage (including skin, serositis, arthritis, heart, kidney, blood, central nervous and other system damage) and type and dose of immunosuppressants in the 2 months before ICU admission were recorded. Laboratory indicators included CRP, TLC, CD3 + , CD4 + , CD8 + , CD20 + lymphocyte count, albumin, globulin, procalcitonin (PCT), interleukin-6 (IL-6), hemoglobin (Hgb), platelet (PLT), N-terminal B-type natriuretic peptide (NT-proBNP), serum creatinine (Scr), blood urea nitrogen (BUN), complement C3, complement C4, antinuclear antibody (ANA), anti–double-stranded DNA antibody (anti-dsDNA), anticardiolipin antibody (ACL), lupus anticoagulant factor (LA), and proteinuria. The SLE Disease Activity Index (SLE-DAI) and Acute Physiology and Chronic Health Assessment (APACHE) II scores were calculated. The diagnosis of pulmonary infection and severe pulmonary infection was based on diagnostic criteria developed by the Infectious Diseases Society of America/American Thoracic Society (IDSA/ATS) [11]. Sepsis was defined according to the diagnostic criteria Sepsis 3.0 [12]. ARDS was defined according to the Berlin diagnostic criteria [13].
Statistical analysis
SPSS 19.0 statistical software was used for analysis. Normal data are expressed as the mean ± standard deviation, and non-normal data are expressed as median and interquartile range. The t test was used for comparison between the two groups; the Mann–Whitney nonparametric test was used for the comparison between groups that did not obey the normal distribution. The counting data were expressed as a constituent ratio (%), and analyzed by χ2 test or Fisher's exact test. Survival rate was analyzed with Kaplan–Meier survival analysis. Potentially significant factors (P < 0.1) in the univariate Cox regression model were included in a multivariate Cox regression model.
Results
Patient information
A total of 96 SLE patients with ICU stays > 14 days were included in this study, and the incidence of PICS was 63.54%. The length of ICU stay in the PICS group was longer than that in the non-PICS group (P = 0.012). The general clinical data of the two groups were compared. CRP, PCT, IL-6 and other inflammatory indicators in the PICS group were significantly higher than those in the non-PICS group, while the lymphocyte counts of CD3 + , CD4 + , CD8 + and CD20 + were significantly lower than those in the non-PICS group (P < 0.01). However, there were no significant differences in Alb, globulin or IgG between the two groups. The levels of Hgb, PLT, Scr and BUN in the PICS group were lower than those in the non-PICS group (P < 0.05), suggesting that the hematological injury in the PICS group was more serious following the more serious renal injury in the non-PICS group. The levels of complement C3 and C4 in the PICS group were higher than those in the non-PICS group (P < 0.05), and the positive proportion of anti-dsDNA (P = 0.01) and the SLE-DAI score (P = 0.027) in the PICS group were lower than those in the non-PICS group. There were no significant differences in the number of organs affected by SLE, ANA, LA, positive ratio of anti-C1q antibody and proteinuria between the two groups. The cumulative prednisone dose in the PICS group was higher than that in the non-PICS group 2 months before ICU admission (P = 0.025). However, there was no significant difference in the proportion of high-dose prednisone, other immunosuppressant types, plasma exchange and stem cell transplantation before ICU admission. The proportion of patients complicated with sepsis, ARDS and mechanical ventilation in the PICS group was significantly higher than that in the non-PICS group (P < 0.01). There were no significant differences in age, sex, course of SLE, NT-proBNP, continuous renal replacement therapy (CRRT), APACHE-II score, neuropsychiatric lupus or thrombotic microangiopathy between the two groups (Table 1).
Table 1.
Clinical and laboratory findings of patients in the PICS group and non-PICS group
| Variables | SLE with PICS (n = 61) | SLE with non-PICS (n = 35) | P |
|---|---|---|---|
| Sex (male/female) | 6/55 | 8/27 | 0.131 |
| Age (years) | 37.13 ± 12.04 | 35.18 ± 11.62 | 0.442 |
| Course of SLE (years) | 4.00 (0.79, 9.50) | 2.00 (0.33, 8.00) | 0.127 |
| Length of ICU stay (days) | 19.00 (16.50, 26.00) | 17.00 (15.00, 20.00) | 0.012 |
| CRP (mg/l) | 140.70 (86.35, 203.35) | 38.00 (7.00, 83.30) | < 0.001 |
| PCT (ug/l) | 2.19 (0.58, 9.18) | 0.68 (0.26, 1.97) | 0.002 |
| IL-6 (ng/l) | 224.30 (64.22, 618.30) | 39.07 (22.70, 84.57) | < 0.001 |
| WBC (× 109/l) | 13.80 (8.20, 19.45) | 11.80 (8.60, 15.20) | 0.474 |
| TLC (× 109/l) | 0.32 ± 0.15 | 0.60 ± 0.41 | < 0.001 |
| CD3 (/ul) | 296.00 (146.00, 459.50) | 472.00 (387.00, 750.00) | 0.001 |
| CD4 (/ul) | 91.00 (42.50, 142.50) | 196.00 (94.00, 273.00) | < 0.001 |
| CD8 (/ul) | 170.00 (84.00, 308.00) | 280.00 (208.00, 408.00) | 0.008 |
| CD20 (/ul) | 33.00 (8.00, 100.00) | 96.00 (30.00, 251.00) | 0.009 |
| CD4/CD8 | 0.49 (0.30, 0.87) | 0.61 (0.44, 1.17) | 0.042 |
| Alb (g/l) | 22.72 ± 4.96 | 24.55 ± 6.02 | 0.112 |
| Glb (g/l) | 21.66 ± 6.47 | 20.76 ± 6.61 | 0.515 |
| IgG (g/l) | 9.82 ± 5.43 | 10.52 ± 5.41 | 0.558 |
| Hgb (g/l) | 59.13 ± 12.73 | 66.57 ± 15.38 | 0.012 |
| PLT (× 109/l) | 47.64 ± 41.81 | 84.66 ± 64.79 | 0.001 |
| NT-proBNP (pmol/L) | 1883.00 (444.33, 4138.00) | 1141.00 (336.53, 3676.00) | 0.231 |
| Scr (μmol/L) | 291.56 ± 226.09 | 466.31 ± 338.04 | 0.003 |
| BUN(mmol/L) | 27.94 ± 14.25 | 34.23 ± 15.33 | 0.046 |
| C3 (g/l) | 0.59 (0.41, 0.78) | 0.39 (0.28, 0.55) | 0.002 |
| C4 (g/l) | 0.12 (0.10, 0.20) | 0.10 (0.06, 0.17) | 0.013 |
| ANA positive (%) | 45 (73.77) | 31 (88.57) | 0.118 |
| Anti-dsDNA positive (%) | 8 (13.11) | 13 (37.14) | 0.010 |
| LAC positive (%) | 8 (13.11) | 3 (8.57) | 0.741 |
| ACL positive (%) | 8 (13.11) | 8 (22.86) | 0.218 |
| C1q positive (%) | 12 (19.67) | 10 (28.57) | 0.318 |
| Proteinuria (g/24 h) | 3.68 ± 3.31 | 4.14 ± 3.30 | 0.523 |
| Organs affected by SLE | 3 (3, 4) | 3 (3, 4) | 0.610 |
| SLE-DAI | 12.80 ± 6.84 | 15.97 ± 6.33 | 0.027 |
| APACHE-II | 21.28 ± 7.25 | 19.14 ± 6.44 | 0.152 |
| CRRT (%) | 34 (55.74) | 22 (62.86) | 0.526 |
| Sepsis (%) | 13 (21.31) | 0 (0.00) | 0.002 |
| ARDS (%) | 21 (34.43) | 3 (8.57) | 0.006 |
| MV (%) | 28 (45.90) | 3 (8.57) | < 0.001 |
| NPSLE (%) | 14 (22.95) | 7 (20) | 0.802 |
| TMA (%) | 8 (13.11) | 6 (17.14) | 0.765 |
| Kinds of immunosuppressant | 2 (1, 3) | 2 (1, 2) | 0.065 |
| High dose prednisone therapy (%) | 26 (42.62) | 14 (40) | 0.802 |
| Cumulative prednisone dose nearly 2 months (mg) | 2607.95 ± 1725.53 | 1822.50 ± 1423.25 | 0.025 |
| Cyclophosphamide | 19 (31.15) | 5 (14.29) | 0.066 |
| Mycophenolate mofetil | 15 (24.59) | 5 (14.29) | 0.231 |
| Tacrolimus | 14 (22.95) | 5 (14.29) | 0.305 |
| Triptergium wilfordii | 9 (14.75) | 7 (20.00) | 0.507 |
| Ciclosporin | 5 (8.20) | 1 (2.86) | 0.411 |
| Leflunomide | 3 (4.92) | 1 (2.86) | 1.000 |
| Rituximab | 2 (3.28) | 1 (2.86) | 1.000 |
| Plasma exchange | 7 (11.48) | 7 (20.00) | 0.255 |
| Renal pathological pattern | |||
| III | 1 | 2 | |
| IV | 17 | 10 | |
| V | 4 | 2 | |
| IV + V | 15 | 4 | |
| V + III | 3 | ||
| No renal biopsy | 24 | 14 |
SLE systemic lupus erythematosus, PICS persistent inflammation–immunosuppression–catabolism syndrome, ICU intensive care unit, CRP C-reactive protein, PCT procalcitonin, IL-6 interleukin-6, WBC white blood cells, TLC total lymphocyte count, Alb albumin, Glb globulin, Hgb hemoglobin, PLT platelet, NT-proBNP N-terminal B-type natriuretic peptide, Scr serum creatinine, BUN blood urea nitrogen, ANA antinuclear antibody, anti-dsDNA anti–double-stranded DNA antibody, LAC lupus anticoagulant, ACL anticardiolipin antibody, SLE-DAI SLE Disease Activity Index, APACHE acute physiology and chronic health evaluation, CRRT continuous renal replacement therapy, ARDS acute respiratory distress syndrome, MV mechanical ventilation, NPSLE neuropsychiatric SLE, TMA thrombotic microangiopathy
Etiology of infection
PICS patients were significantly more likely to suffer from severe pulmonary infections compared to non-PICS patients (24.0% vs. 3.0%; P = 0.001). In contrast to the non-PIC group, the proportion of gram-positive bacteria, gram-negative bacteria, fungi, and double infections was significantly higher in the PICS group (P < 0.05). No significant difference was found between the groups in terms of virus and Mycobacterium tuberculosis infection. A significant difference did not exist in the areas of the lungs, urinary tract, skin, soft tissues, cerebrum, oral cavity, central venous catheter, or any other infection sites (Table 2).
Table 2.
Comparison of infection sites and pathogens between the PICS and non-PICS groups
| Variables | SLE with PICS (n = 61) | SLE with non-PICS (n = 35) | P |
|---|---|---|---|
| Infection sites | |||
| Lung (%) | 44 (72.13) | 22 (62.86) | 0.368 |
| Urinary tract (%) | 3 (4.92) | 0 (0.00) | 0.298 |
| Skin and soft tissue (%) | 4 (6.56) | 0 (0.00) | 0.293 |
| Cerebrum (%) | 3 (4.92) | 1 (2.86) | 1.000 |
| Oral cavity (%) | 3(4.92) | 1 (2.86) | 1.000 |
| Central venous catheter (%) | 4 (6.56) | 1 (2.86) | 0.650 |
| Pathogens | |||
| Gram-positive bacteria (%) | 15 (24.59) | 0 (0.00) | 0.001 |
| Staphylococcus aureus | 6 | 0 | |
| Enterococcus faecium | 4 | 0 | |
| Staphylococcus epidermidis | 1 | 0 | |
| Staphylococcus haemolyticus | 1 | 0 | |
| Streptococcus pneumoniae | 1 | 0 | |
| Streptococcus agalactiae | 1 | 0 | |
| Listeria monocytogenes | 1 | 0 | |
| Gram-negative bacteria (%) | 31 (50.82) | 6 (17.14) | 0.001 |
| Acinetobacter baumannii | 7 | 2 | |
| Klebsiella pneumoniae | 7 | 1 | |
| Pseudomonas aeruginosa | 5 | 1 | |
| Escherichia coli | 4 | 0 | |
| Enterobacter cloacae | 3 | 2 | |
| Stenotrophomonas maltophilia | 2 | 0 | |
| Klebsiella oxytoca | 2 | 0 | |
| Corynebacterium | 1 | 0 | |
| Fungus (%) | 23 (37.70) | 5 (14.29) | 0.015 |
| Pneumocystis carinii | 9 | 3 | |
| Candida albicans | 8 | 1 | |
| Aspergillus | 3 | 0 | |
| Cryptococcus neoformans | 3 | 1 | |
| Virus (%) | 2 (3.28) | 3 (8.57) | 0.351 |
| Varicella-zoster virus | 2 | 2 | |
| Cytomegalovirus | 0 | 1 | |
| Mycobacterium tuberculosis (%) | 3 (4.92) | 1 (2.86) | 1.000 |
| Double infections (%) | 22 (36.07) | 2 (5.71) | 0.001 |
SLE systemic lupus erythematosus, PICS persistent inflammation–immunosuppression–catabolism syndrome
Clinical prognosis
In this study, all 96 patients were followed up. The 28-day and 1-year survival rates in the PICS group were 73.77% and 55.74% respectively, whereas in the non-PICS group they were 100.00% and 88.57%, respectively. During the 3-year follow-up in the PICS group, the cumulative survival rate was 50.82%, and the renal survival rate was 32.79%. Moreover, the median renal survival time was 3.0 (1.0, 36.0) months. In the non-PICS group, the cumulative survival rate was 85.71%, and the renal survival rate was 51.43%. In addition, the median renal survival time was 36.0 (1.0, 36.0) months. The survival curves of the two groups are shown in Fig. 2A, and the clinical follow-up outcomes are shown in Fig. 2B.
Fig. 2.

A Comparison of survival curves between the PICS group and the non-PICS group. B Comparison of clinical outcomes between the PICS group (a) and the non-PICS group (b)
Prognostic factor analysis
We analyzed the prognostic factors of the patients in this study. Univariate Cox regression analysis showed that APACHE-II score, TLC, PLT, BUN and CRP during ICU admission were risk factors for death in SLE patients with PICS. A multivariate Cox model showed that TLC was an independent risk factor for death in SLE patients with PICS (Table 3A). In SLE patients without PICS, a univariate Cox regression analysis showed that organ involvement and the SLE-DAI score were risk factors for death. According to the multivariate Cox model, the number of organs affected by SLE is an independent risk factor for death in patients without PICS (Table 3B).
Table 3.
A Risk factors for death in SLE patients with PICS. B Risk factors for death in SLE patients with non-PICS
| A Risk factors for death in SLE patients with PICS | ||||
|---|---|---|---|---|
| Variables | Univariate | P | Multivariate | P |
| HR (95% CI) | HR (95% CI) | |||
| APACHE-II | 1.067 (1.020, 1.115) | 0.004 | 1.038 (0.990, 1.089) | 0.122 |
| TLC (× 109/l) | 0.013 (0.001, 0.298) | 0.007 | 0.029 (0.001, 0.658) | 0.026 |
| PLT (× 109/l) | 0.988 (0.976, 0.999) | 0.036 | 0.989 (0.977, 1.001) | 0.082 |
| BUN (mmol/l) | 1.025 (1.000, 1.051) | 0.046 | 1.014 (0.988, 1.041) | 0.305 |
| CRP (mg/l) | 1.006 (1.001, 1.011) | 0.013 | 1.002 (0.997, 1.008) | 0.421 |
| B Risk factors for death in SLE patients with non-PICS | ||||
|---|---|---|---|---|
| Variables | Univariate | P | Multivariate | P |
| HR (95% CI) | HR (95% CI) | |||
| Organs affected by SLE | 7.850 (1.482, 41.589) | 0.015 | 6.891 (1.217, 39.016) | 0.029 |
| SLE-DAI | 1.287 (1.046, 1.582) | 0.017 | 1.247 (0.927, 1.677) | 0.145 |
SLE systemic lupus erythematosus, PICS persistent inflammation–immunosuppression–catabolism syndrome, APACHE acute physiology and chronic health evaluation, TLC total lymphocyte count, PLT platelet, BUN blood urea nitrogen, CRP C-reactive protein, SLE-DAI SLE Disease Activity Index
Discussion
In 2012, Gentile proposed the concept of PICS to describe the clinical characteristics of chronic critically ill patients in surgical ICU [7]. PICS refers to a group of clinical syndromes caused by multiple injury factors, such as burns, trauma and infection, and it is characterized by a long ICU stay, persistent inflammatory response, immunosuppression and hypercatabolism. Symptoms of PICS usually manifest as malnutrition, repeated nosocomial infections, ventilator dependence and mental disorder. Patients with PICS have a high mortality rate [14]. Previous studies have reported that the cumulative survival rates of PICS patients with severe pancreatitis or intestinal fistula are 57.48% [15] and 71.71% [16], respectively. Recurrent organ injuries and infections in patients with SLE during immunosuppressant therapy will also lead to chronic critical illness and worsen prognosis [17]. The characteristics of such PICS patients with SLE need to be explored. The three-year PICS survival rate of SLE patients in the present study was 50.82%, and the prognosis was worse than that of patients with the other diseases mentioned above.
During prolonged stays in the ICU, patients become chronically ill. Persistent organ dysfunction and tissue cell damage lead to a steady release of damage-associated molecular patterns (DAMPs) that induce sustained proinflammatory responses. At the same time, infection and other factors can prevent immature bone marrow cells from differentiating into immune cells and accumulating into myeloid-derived suppressor cells (MDSCs). Immunosuppression is induced by promoting T cell apoptosis, inhibiting T cell reactivity, expressing IL-10 and inducing Treg cell activation. The subsequent inflammatory response and immune suppression lead to an imbalance of cytokines and the release of many inflammatory mediators, catecholamines and other stress hormones, which leads to high catabolism, resulting in weight loss, muscle decomposition and malnutrition [10].
In the present study, severe pulmonary infection was the prominent manifestation of SLE with PICS. There were a high proportion of patients with ARDS, sepsis, receiving mechanical ventilation, infected with multiple pathogens and opportunistic infections. In contrast to other critically ill studies, our patients received long-term immunosuppressant therapy, including high-dose glucocorticoids or multiple immunosuppressant combinations. Glucocorticoids inhibit the activation, proliferation, differentiation and survival of macrophages, T lymphocytes and other inflammatory cells, and they promote T cell apoptosis [18]. Long-term application of the above therapies reduces the clearance capacity of fungi and bacteria, and it increases the risk of infection [5, 19]. SLE activity leads to a vicious cycle in which immunosuppressants are difficult to reduce or SLE recurs and immunosuppressants have to be increased again. Eventually, SLE is in remission but with an increased risk of infection. The subsequent increase in MDSCs, macrophage dysfunction and further reduction in T lymphocytes with severe infection cause patients to enter immune paralysis and increase the incidence of opportunistic infection [20]. In addition, the use of large doses of glucocorticoids and a continuous inflammatory response can lead to a high catabolic state of muscle proteins throughout the body [21]. Excessive immunosuppression in SLE patients is often counterproductive. The combination of the above factors leads to the abnormal outcomes of reduced SLE activity, less renal impairment and worse prognosis in SLE patients with PICS compared to those without PICS.
Our study found that SLE patients with PICS not only had a lower survival rate but also had a significantly lower renal survival rate than those without PICS. Same as the study in surgical sepsis patients with PICS [22], a univariate Cox regression model showed that TLC and CRP in the PICS diagnostic criteria could affect the long-term prognosis of SLE patients, and BUN levels also reflected the catabolic status of patients to a certain extent. The PICS diagnostic criteria were further validated in the SLE population and can be applied to identify patients with poor prognosis in SLE. Only TLC during ICU admission was an independent risk factor affecting the death of SLE patients with PICS, suggesting the important role of immune levels, especially lymphocyte changes, in influencing the prognosis of SLE patients with PICS [23].
In the treatment of SLE, the relationship between SLE activity and immunosuppression should be evaluated, and the side effects of glucocorticoids and other immunosuppressants should be closely monitored [24]. In this study, the non-PICS group had higher SLE activity and severe kidney injury, but the human and kidney survival rates were better than those of the PICS group, suggesting that whether to conduct high-dose glucocorticoids and adjust the type of immunosuppressant should not only consider the current degree of SLE activity. The risk of secondary infection also needs to be assessed, taking into account the patient's immunological and nutritional levels [25]. Inflammatory markers other than CRP and PCT appear to be more associated with SLE activity than with infection risk [26]. Lymphopenia is associated with increased risk of infection-related hospitalization and death in the general population [27]. Whether immunological monitoring in SLE patients can also predict the risk of infection requires further investigation [23, 28].
Our research is the first study on SLE patients and the first study on immunosuppressant users in the current PICS literature, laying a foundation for subsequent studies on other patients with severe kidney disease. Importantly, our study also suggests that stronger clinical research evidence is needed for guidance to avoid PICS in the treatment of SLE patients [29]. The disadvantage of the study was that it was a single-center retrospective study with a small sample size. Due to the lack of complete and standardized clinical data from the onset of SLE to PICS, it was difficult to determine the independent factors related to PICS in SLE patients because most patients were treated in different hospitals in the early stage. However, SLE patients are mostly complicated with hypoproteinaemia [30]. Moreover, lymphocyte levels decrease [31], and CRP levels slightly increase during SLE activity [32]. The use of immunosuppressants may also affect lymphocyte and CRP levels. All these factors suggest that the values of the current PICS diagnostic criteria may not be completely applicable to SLE patients. The enrolled patients in this study were all patients with ICU stays > 14 days, and the overall characteristics of severe SLE in our ICU need to be further studied.
In conclusion, patients with SLE complicated with PICS had longer ICU stays, a lower level of SLE activity, a higher risk of secondary infection and a significantly lower survival rate than non-PICS patients. The treatment of SLE requires the formulation of immunosuppressive treatment regimens according to the immune and nutritional levels, and the risk of various infections should be closely monitored.
Funding
This work was supported by the Special Program of National Clinical Research Center for Kidney Diseases (JD20200820).
Declarations
Conflict of interest
The authors declared no potential conflicts of interest with respect to the research, authorship, and/or publication of this article.
Footnotes
Publisher's Note
Springer Nature remains neutral with regard to jurisdictional claims in published maps and institutional affiliations.
References
- 1.Liu ZH, Zhang HT, Liu ZS, et al. Multitarget therapy for induction treatment of lupus nephritis: a randomized trial. Ann Intern Med. 2015;162(1):18–26. doi: 10.7326/M14-1030. [DOI] [PubMed] [Google Scholar]
- 2.Kronbichler A, Brezina B, Quintana LF, et al. Efficacy of plasma exchange and immunoadsorption in systemic lupus erythematosus and antiphospholipid syndrome: a systematic review. Autoimmun Rev. 2016;15(1):38–49. doi: 10.1016/j.autrev.2015.08.010. [DOI] [PubMed] [Google Scholar]
- 3.Huang XH, Chen WC, Ren GS, et al. Autologous hematopoietic stem cell transplantation for refractory lupus nephritis. Clin J Am Soc Nephrol. 2019;14(5):719–727. doi: 10.2215/CJN.10570918. [DOI] [PMC free article] [PubMed] [Google Scholar]
- 4.Yang L, Ren GS, Chen WC, et al. Long-term follow-up of autologous peripheral blood hematopoietic stem cell transplantation for refractory lupus nephritis-a series study of 20 patients. Lupus. 2022;31(13):1586–1594. doi: 10.1177/09612033221126848. [DOI] [PubMed] [Google Scholar]
- 5.Yang SC, Lai YY, Huang MC, et al. Corticosteroid dose and the risk of opportunistic infection in a national systemic lupus erythematosus cohort. Lupus. 2018;27(11):1819–1827. doi: 10.1177/0961203318792352. [DOI] [PubMed] [Google Scholar]
- 6.Lamas D. Chronic critical illness. N Engl J Med. 2014;370(2):175–177. doi: 10.1056/NEJMms1310675. [DOI] [PubMed] [Google Scholar]
- 7.Gentile LF, Cuenca AG, Efron PA, et al. Persistent inflammation and immunosuppression: a common syndrome and new horizon for surgical intensive care. J Trauma Acute Care Surg. 2012;72(6):1491–1501. doi: 10.1097/TA.0b013e318256e000. [DOI] [PMC free article] [PubMed] [Google Scholar]
- 8.Barber MRW, Drenkard C, Falasinnu T, et al. Global epidemiology of systemic lupus erythematosus. Nat Rev Rheumatol. 2021;17(9):515–532. doi: 10.1038/s41584-021-00668-1. [DOI] [PMC free article] [PubMed] [Google Scholar]
- 9.Moghaddam B, Marozoff S, Li LY, et al. All-cause and cause-specific mortality in systemic lupus erythematosus: a population-based study. Rheumatology (Oxford) 2021;61(1):367–376. doi: 10.1093/rheumatology/keab362. [DOI] [PMC free article] [PubMed] [Google Scholar]
- 10.Mira JC, Gentile LF, Mathias BJ, et al. Sepsis pathophysiology, chronic critical illness, and persistent inflammation-immunosuppression and catabolism syndrome. Crit Care Med. 2017;45(2):253–262. doi: 10.1097/CCM.0000000000002074. [DOI] [PMC free article] [PubMed] [Google Scholar]
- 11.Mandell LA, Wunderink RG, Anzueto A, et al. Infectious diseases society of America/American thoracic society consensus guidelines on the management of community-acquired pneumonia in adults. Clin Infect Dis. 2007;44(S2):S27–S72. doi: 10.1086/511159. [DOI] [PMC free article] [PubMed] [Google Scholar]
- 12.Rhodes A, Evans LE, Alhazzani W, et al. Surviving sepsis campaign: international guidelines for management of sepsis and septic shock: 2016. Intensive Care Med. 2017;43(3):304–377. doi: 10.1007/s00134-017-4683-6. [DOI] [PubMed] [Google Scholar]
- 13.Definition Task Force ARDS, Ranieri VM, Rubenfeld GD, et al. Acute respiratory distress syndrome: the berlin definition. JAMA. 2012;307(23):2526–2533. doi: 10.1001/jama.2012.5669. [DOI] [PubMed] [Google Scholar]
- 14.Hawkins RB, Raymond SL, Stortz JA, et al. Chronic critical illness and the persistent inflammation, immunosuppression, and catabolism syndrome. Front Immunol. 2018;9:1511. doi: 10.3389/fimmu.2018.01511. [DOI] [PMC free article] [PubMed] [Google Scholar]
- 15.Yang N, Li BQ, Ye B, et al. The long-term quality of life in patients with persistent inflammation-immunosuppression and catabolism syndrome after severe acute pancreatitis: a retrospective cohort study. J Crit Care. 2017;42:101–106. doi: 10.1016/j.jcrc.2017.07.013. [DOI] [PubMed] [Google Scholar]
- 16.Hu D, Ren JA, Wang GF, et al. Persistent inflammation-immunosuppression catabolism syndrome, a common manifestation of patients with enterocutaneous fistula in intensive care unit. J Trauma Acute Care Surg. 2014;76(3):725–729. doi: 10.1097/TA.0b013e3182aafe6b. [DOI] [PubMed] [Google Scholar]
- 17.Feng XB, Pan WY, Liu L, et al. Prognosis for hospitalized patients with systemic lupus erythematosus in China: 5-year update of the Jiangsu cohort. PLoS One. 2016;11(12):e0168619. doi: 10.1371/journal.pone.0168619. [DOI] [PMC free article] [PubMed] [Google Scholar]
- 18.Boumpas DT, Chrousos GP, Wilder RL, et al. Glucocorticoid therapy for immune-mediated diseases: basic and clinical correlates. Ann Intern Med. 1993;119(12):1198–1208. doi: 10.7326/0003-4819-119-12-199312150-00007. [DOI] [PubMed] [Google Scholar]
- 19.Sun YS, Huang DF, Lin FC, et al. Cytomegaloviral or pneumocystis jiroveci pneumonia increases mortality in systemic lupus erythematosus patients with pulmonary hemorrhage: Evidence from bronchoalveolar lavage fluid. J Rheumatol. 2019;46(3):251–258. doi: 10.3899/jrheum.180104. [DOI] [PubMed] [Google Scholar]
- 20.Mathias B, Delmas AL, Ozrazgat BT, et al. Human myeloid-derived suppressor cells are associated with chronic immune suppression after severe sepsis/septic shock. Ann Surg. 2017;265(4):827–834. doi: 10.1097/SLA.0000000000001783. [DOI] [PMC free article] [PubMed] [Google Scholar]
- 21.Buttgereit F, Burmester GB, Lipworth BJ. Optimised glucocorticoid therapy: the sharpening of an old spear. Lancet. 2005;365(9461):801–803. doi: 10.1016/S0140-6736(05)17989-6. [DOI] [PubMed] [Google Scholar]
- 22.Zhong M, Pan TT, Sun NN, et al. Early prediction for persistent inflammation-immunosuppression catabolism syndrome in surgical sepsis patients. Int J Gen Med. 2021;14:5441–5448. doi: 10.2147/IJGM.S331411. [DOI] [PMC free article] [PubMed] [Google Scholar]
- 23.Merayo CJ, Gomez MD, Pineirua MA, et al. Lymphopenia as risk factor for development of severe infections in patients with systemic lupus erythematosus: a case-control study. QJM. 2013;106(5):451–457. doi: 10.1093/qjmed/hct046. [DOI] [PubMed] [Google Scholar]
- 24.An Y, Zhang HT, Liu ZH. Individualizing therapy in lupus nephritis. Kidney Int Rep. 2019;4(10):1366–1372. doi: 10.1016/j.ekir.2019.08.005. [DOI] [PMC free article] [PubMed] [Google Scholar]
- 25.Rosenthal MD, Vanzant EL, Moore FA. Chronic critical illness and PICS nutritional strategies. J Clin Med. 2021;10(11):2294. doi: 10.3390/jcm10112294. [DOI] [PMC free article] [PubMed] [Google Scholar]
- 26.Aringer M. Inflammatory markers in systemic lupus erythematosus. J Autoimmun. 2020;110:102374. doi: 10.1016/j.jaut.2019.102374. [DOI] [PubMed] [Google Scholar]
- 27.Warny M, Helby J, Nordestgaard BG, et al. Lymphopenia and risk of infection and infection-related death in 98,344 individuals from a prospective Danish population-based study. PLoS Med. 2018;15(11):e1002685. doi: 10.1371/journal.pmed.1002685. [DOI] [PMC free article] [PubMed] [Google Scholar]
- 28.Yao RQ, Ren C, Zheng LY, et al. Advances in immune monitoring approaches for sepsis-induced immunosuppression. Front Immunol. 2022;13:891024. doi: 10.3389/fimmu.2022.891024. [DOI] [PMC free article] [PubMed] [Google Scholar]
- 29.Shao SJ, Hou JH, Xie GT, et al. Improvement of outcomes in patients with lupus nephritis: management evolution in Chinese patients from 1994 to 2010. J Rheumatol. 2019;46(8):912–919. doi: 10.3899/jrheum.180145. [DOI] [PubMed] [Google Scholar]
- 30.Davidson A. What is damaging the kidney in lupus nephritis? Nat Rev Rheumatol. 2016;12(3):143–153. doi: 10.1038/nrrheum.2015.159. [DOI] [PMC free article] [PubMed] [Google Scholar]
- 31.Carli L, Tani C, Vagnani S, et al. Leukopenia, lymphopenia, and neutropenia in systemic lupus erythematosus: prevalence and clinical impact–a systematic literature review. Semin Arthritis Rheum. 2015;45(2):190–194. doi: 10.1016/j.semarthrit.2015.05.009. [DOI] [PubMed] [Google Scholar]
- 32.Gaitonde S, Samols D, Kushner I. C-reactive protein and systemic lupus erythematosus. Arthritis Rheum. 2008;59(12):1814–1820. doi: 10.1002/art.24316. [DOI] [PubMed] [Google Scholar]