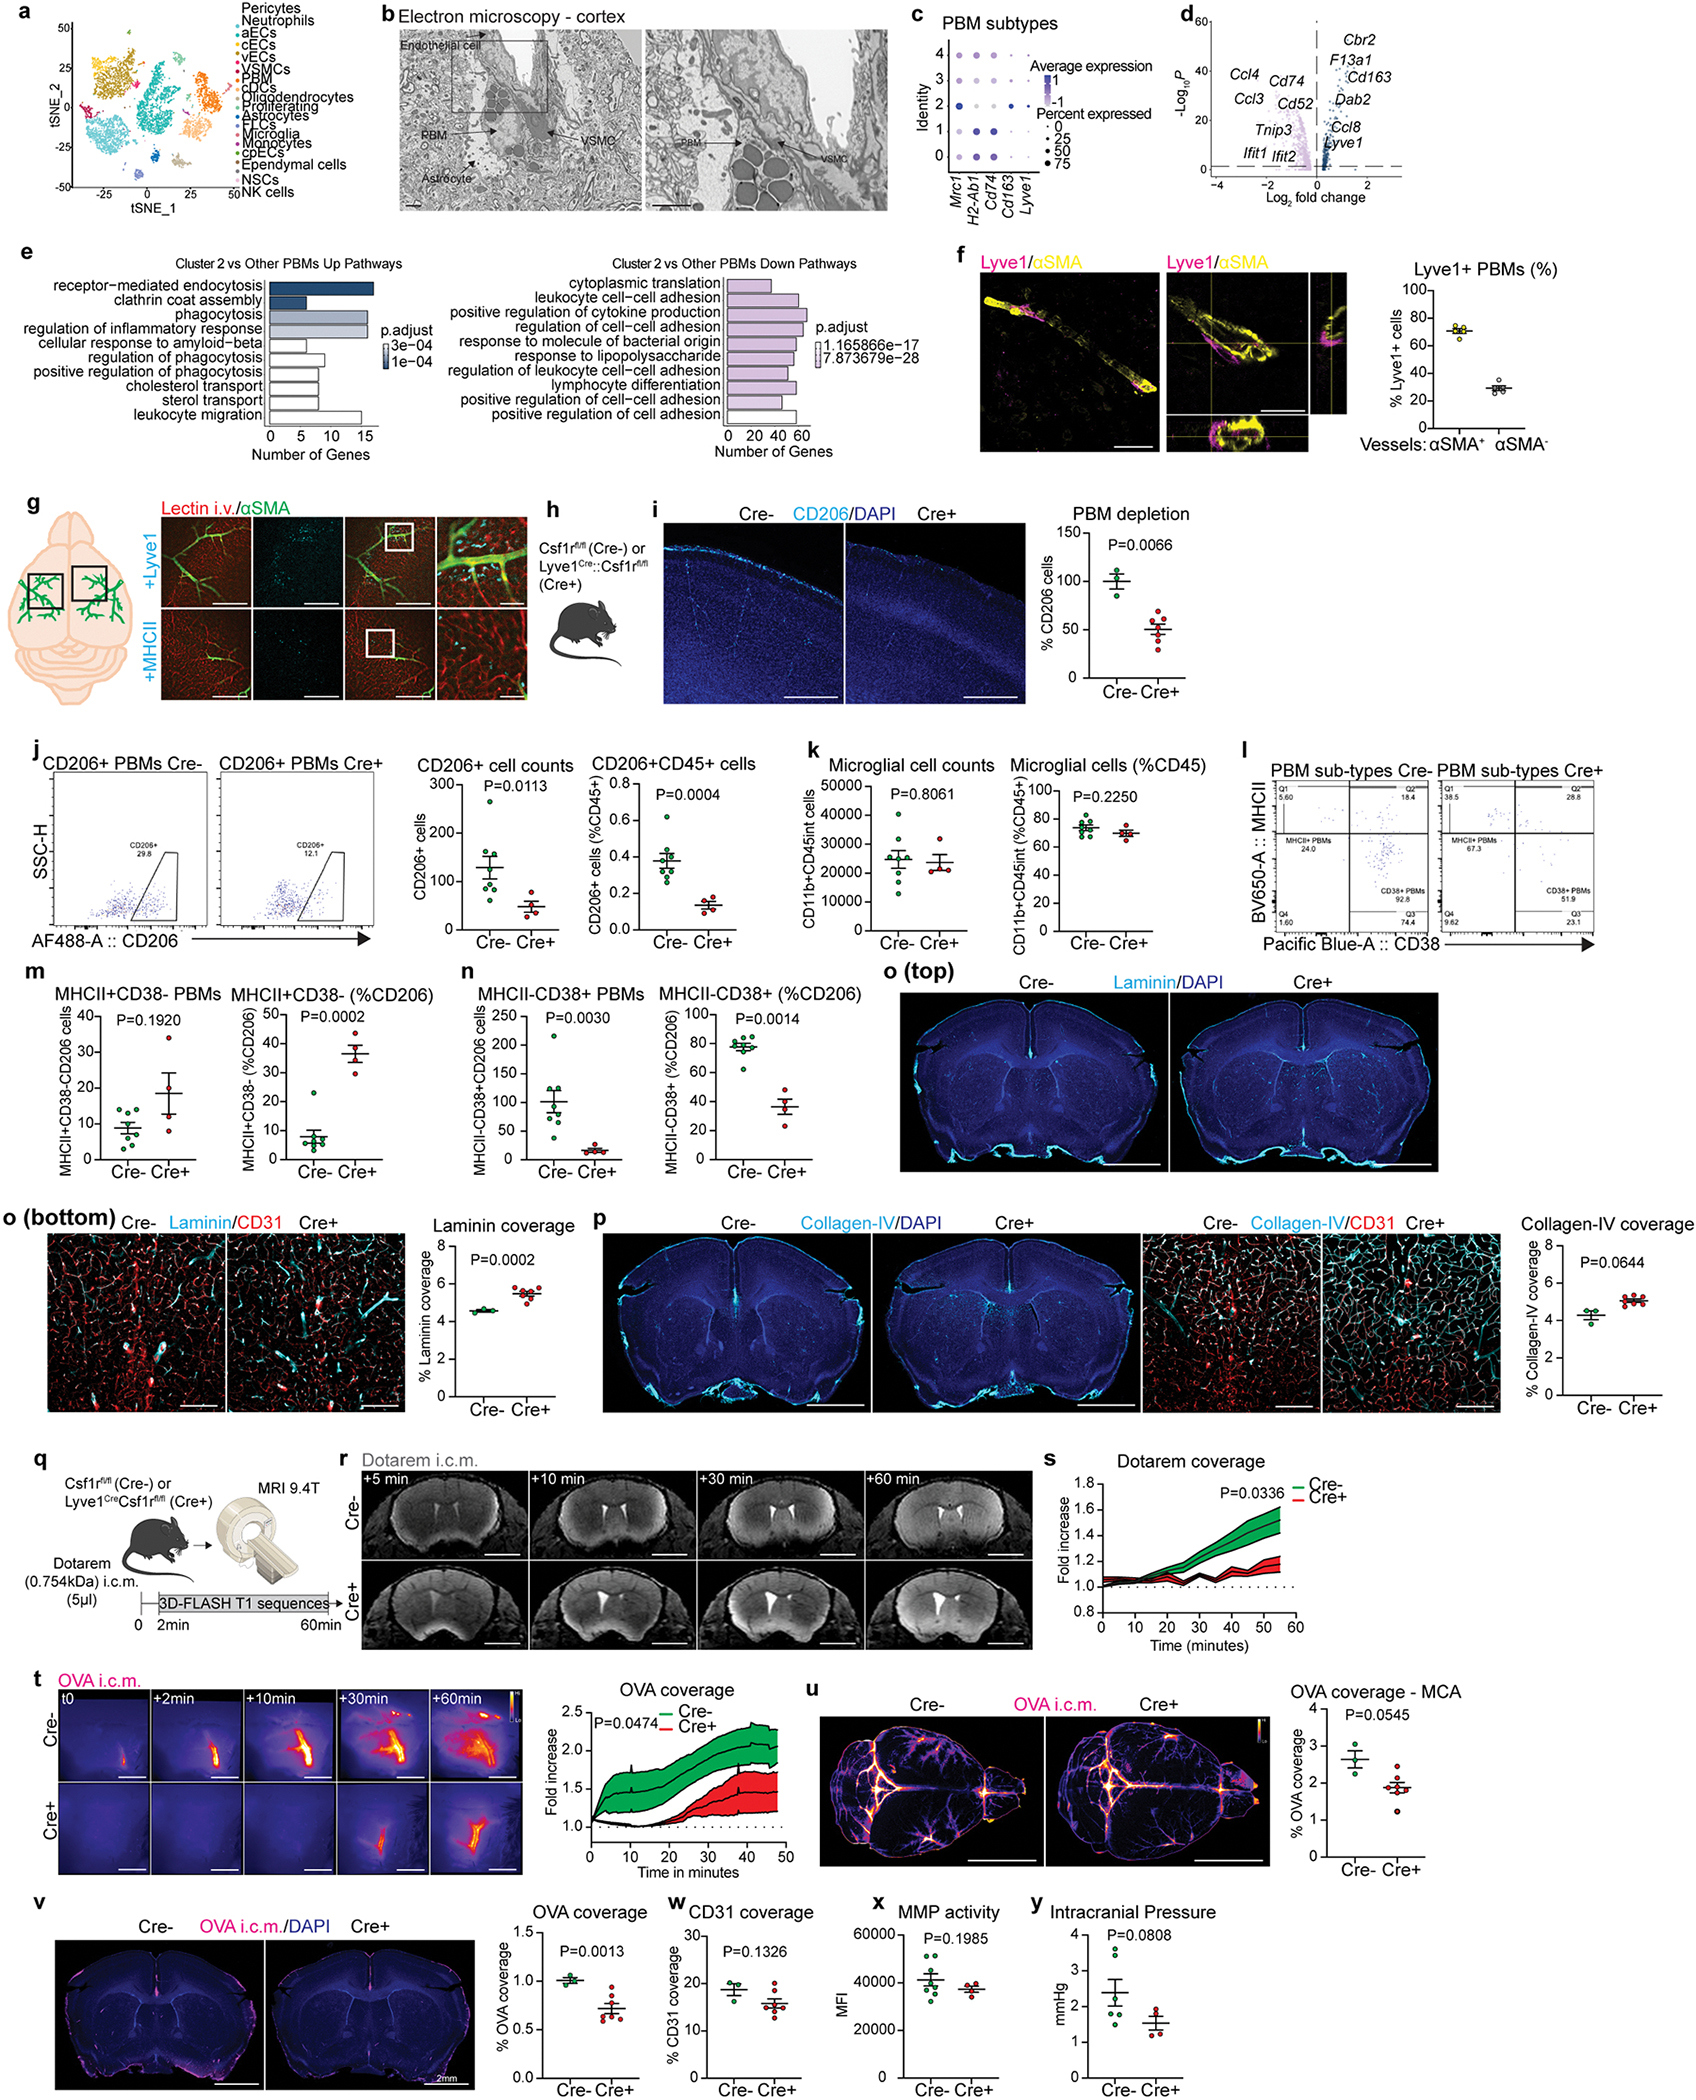
Extended Data Fig 7. Lyve1+ PBMs drive CSF flow dynamics.

a, Single-cell RNA sequencing of the whole brain was performed. Eighteen cell types were identified based on canonical markers. b, Scanning electron microscopy image from a mouse cortex suggesting interactions between a PBM and a vascular smooth muscle cell (VSMC). Scale bars, 2μm. c, Dot plot for Mrc1 (CD206), H2-Ab1 (MHCII), Cd74, Cd163 and Lyve1 expression in each PBM cluster. d and e, Volcano plot and GO pathway analysis showing up- and down-regulated pathways in PBM cluster 2 versus other PBM clusters. Volcano plots: F-test with adjusted degrees of freedom based on weights calculated per gene with a zero-inflation model and Benjamini-Hochberg adjusted P values; GO-pathways analyses: over-representation test. f, Representative images suggesting interactions between Lyve1+ PBMs (magenta) and αSMA+ (yellow) VSMC. Scale bar, 200μm and 50μm (inset). g, Quantification of Lyve1+ cells associated or not with αSMA+ blood vessels. n = 5 mice. h, Mice received an i.v. injection of lectin and were perfused few minutes later. Whole brains were extracted, post-fixed with 4% PFA, and stained for anti-αSMA (green) and anti-Lyve1 (top panels) or anti-MHCII (bottom panels) (cyan). Scale bars: 1mm and 200μm (insets). i, Characterization of PBM depletion in Lyve1Cre::Csf1rfl/fl mice (Cre+) in brain coronal sections using CD206 staining (co-stained for DAPI) versus control littermates not expressing Cre (Csf1rfl/fl; Cre−). Scale bar, 500μm; n = 7 Cre− mice, and 3 Cre+ mice; two-tailed unpaired Welch’s t-test. j, Flow cytometry panels showing CD206+ cells in Csf1rfl/fl mice (Left; Cre−) and Lyve1Cre::Csf1rfl/fl mice (Right; Cre+), and quantifications of CD206+ PBM cell numbers (left), and frequency of CD206+ PBMs from total CD45+ cells (right). k, Quantification of CD11b+CD45int microglial cell numbers (left), and frequency of CD11b+CD45int microglial cells from total CD45+ cells (right). l, Flow cytometry panels showing CD38+ and/or MHCII+ CD206+ PBMs in Csf1rfl mice (Left; Cre−) and Lyve1Cre::Csf1rfl mice (Right; Cre+). m, Quantification of MHCII+CD38− PBMs (left), and frequency of MHCII+CD38− PBMs from total CD206+ cells (right). n, Quantification of MHCII-CD38+ PBMs (left), and frequency of MHCII-CD38+ PBMs from total CD206+ cells (right). For i-n: n = 8 Cre− mice, and 4 Cre+ mice; two-tailed unpaired Welch’s t-test. o, (Top) Representative images of coronal brains sections from Lyve1Cre::Csf1rfl/fl (Cre+) and Csf1rfl/fl (Cre−) mice co-stained for anti-Laminin (cyan) and DAPI. (Bottom) High magnification images showing Laminin location at the vicinity of CD31+ blood vessels (red), and corresponding quantification. Scale bars, 2mm (top) and 200μm (bottom). p, (Left) Representative images of coronal brains sections from Lyve1Cre::Csf1rfl/fl (Cre+) and Csf1rfl/fl (Cre−) mice co-stained for anti-Collagen-IV (cyan, right panels) and DAPI. (Right) High magnification images showing Collagen-IV location at the vicinity of CD31+ blood vessels (red), and corresponding quantification. Scale bars, 2mm (left) and 200μm (Right). q, Three-month-old Cre+ and Cre− mice received an i.c.m. injection of Dotarem (0.754kDa; 5μl) and were immediately placed in prone position into the MRI device for dynamic imaging. r, Representative brain coronal images showing Dotarem distribution over an hour. Scale bar, 3mm. s, Quantification of Dotarem signal fold increase over time, n = 8 Cre− mice, and 5 Cre+ mice; repeated measures 2-way ANOVA with Geisser-Greenhouse correction. t, In vivo imaging of OVA coverage at the MCA level in Lyve1Cre::Csf1rfl/fl (Cre+) and Csf1rfl/fl (Cre−) mice, with corresponding representative images and quantification. Scale bar, 1mm; n = 7 Cre− mice, and 5 Cre+ mice; repeated measures 2-way ANOVA with Geisser-Greenhouse correction. u, Representative images showing OVA distribution in whole brains in Lyve1Cre::Csf1rfl/fl (Cre+) and Csf1rfl/fl (Cre−) mice. Scale bar, 5mm. v, OVA coverage in coronal sections of Lyve1Cre::Csf1rfl/fl (Cre+) and Csf1rfl/fl (Cre−) mice. Scale bar, 2mm. For u and v: n = 7 Cre− mice, and 3 Cre+ mice; two-tailed unpaired Welch’s t-test. x, Quantification of CD31 coverage in Lyve1Cre::Csf1rfl/fl (Cre+) and Csf1rfl/fl (Cre−) mouse brain sections. n = 7 Cre− mice, and 3 Cre+ mice; two-tailed unpaired Welch’s t-test. y, Quantification of MMP activity from Lyve1Cre::Csf1rfl/fl (Cre+) and Csf1rfl/fl (Cre−) mice measured by fluorescence spectrometry after 15 min of incubation. n = 8 Cre− mice, and 4 Cre+ mice; two-tailed unpaired Welch’s t-test. z, Quantification of intracranial pressure from Lyve1Cre::Csf1rfl/fl (Cre+) and Csf1rfl/fl (Cre−) mice. n = 6 Cre− mice, and 4 Cre+ mice; two-tailed unpaired Welch’s t-test. All data are presented as mean values +/− SEM.
