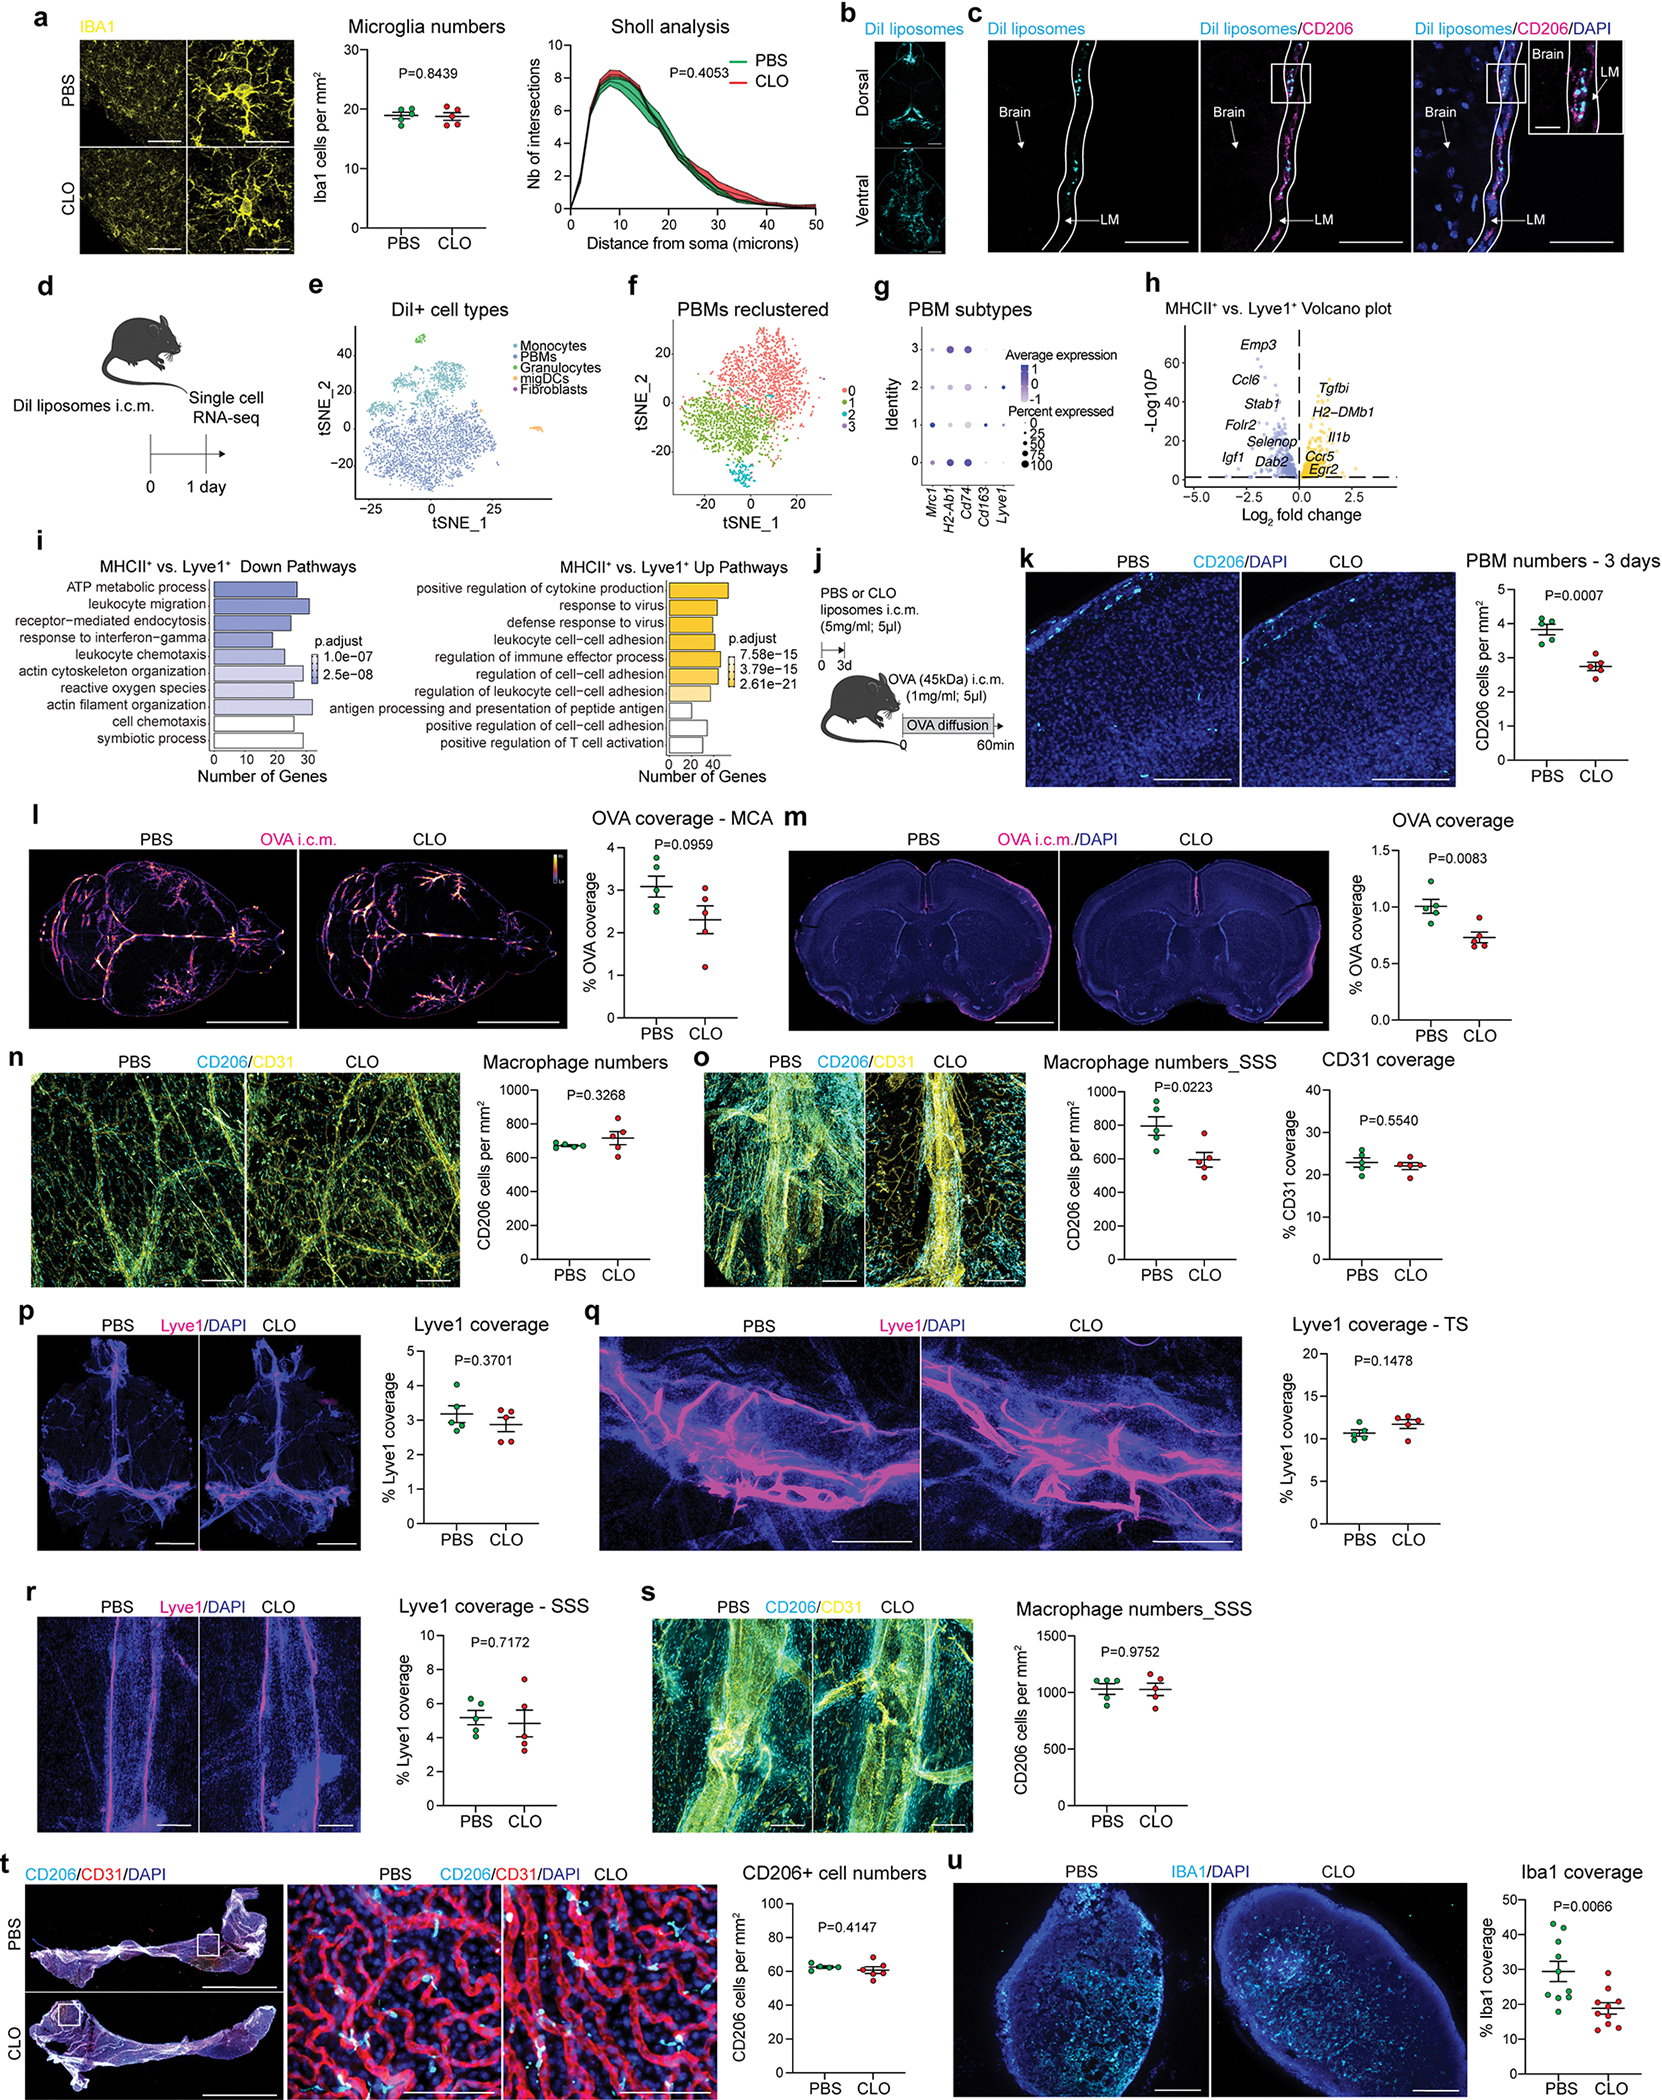
Extended Data Fig 2. Effect of PBM depletion.

a, WT mice received an i.c.m. injection of clodronate-loaded liposomes (CLO) or PBS-loaded liposomes (PBS). Microglial cells were identified using anti-IBA1 staining (yellow). Cells that were not in the leptomeninges and CD206− were used for quantifications of cell numbers and Sholl analysis. Scale bars, 100μm and 20μm. n = 5 mice/group, two-tailed unpaired Welch’s t-test; repeated measures 2-way ANOVA with Geisser-Greenhouse correction. b, WT mice received an i.c.m. injection of DiI-liposomes (5mg/ml; 5μl) and mice were perfused 24 hours later. Representative images showing DiI-liposome coverage in whole brains. Scale bar: 2mm. c, Representative images showing Dil-liposome (cyan) uptake by CD206+ PBMs (magenta) in leptomeninges (LM) co-stained for DAPI. Scale bars: 50μm and 10μm (inset). d, Experimental schematic: Twenty-four hours after i.c.m. injection of DiI-liposomes, leptomeninges were harvested, DiI-positive cells were sorted and single-cell RNA sequencing was performed. e, tSNE plot showing Dil-positive cells: monocytes, PBMs, granulocytes, migratory dendritic cells (migDCs), fibroblasts and NK/T cells. f, Single-cell RNA sequencing demonstrating 4 PBM clusters. g, Dot plots showing Mrc1, H2-Ab1, Cd74, Cd163 and Lyve1 gene expression in the 4 PBM subtypes. h, Volcano plot corresponding to down- and up-regulated genes comparing MHCIIhi vs. Lyve1hi PBMs. F-test with adjusted degrees of freedom based on weights calculated per gene with a zero-inflation model and Benjamini-Hochberg adjusted P values. i, GO Pathway analysis showing up- and down-regulated pathways comparing MHCIIhi vs. Lyve1hi PBMs. Over-representation test. j. Experimental schematic: WT mice received an i.c.m. injection of CLO or PBS liposomes. OVA was injected i.c.m. three days later and mice were perfused one hour later. k. Representative images showing CD206+ PBMs (cyan) on brain coronal section co-stained for DAPI, and corresponding quantification. Scale bar, 200μm. n = 5 mice/group; two-tailed unpaired Welch’s t-test. l, Representative images and quantification of OVA distribution in whole brains one hour after OVA injection. Scale bar, 5mm. m, Representative images and quantification of OVA coverage in brain coronal sections. Scale bar, 2mm. For l and m: n = 5 mice/group; two-tailed unpaired Welch’s t-test. n, Representative images from non-superior sagittal sinus region of the dura mater three days after CLO treatment co-stained for anti-CD206 (cyan) and anti-CD31 (yellow) and corresponding quantifications. o, Representative images from the superior sagittal sinus region from the dura mater three days after CLO treatment co-stained for anti-CD206 (cyan) and anti-CD31 (yellow), and corresponding quantifications. For n and o: Scale bars, 200μm; n = 5 mice/group; two-tailed unpaired Welch’s t-test. p-u, WT mice received an i.c.m. injection of CLO or PBS liposomes. Tissues were harvested one week later. p, Representative images of total Lyve1 (magenta) coverage in the dura mater co-stained for DAPI and corresponding quantification. Scale bar, 3mm. q, High magnification images showing Lyve1 staining at the transverse sinus level co-stained for DAPI and corresponding quantification. Scale bar, 500μm. r, High magnification images showing Lyve1 staining at the superior sagittal sinus level co-stained for DAPI and corresponding quantification. Scale bar, 200μm. s, High magnification images showing CD206 staining (cyan) co-stained for anti-CD31 (yellow) and corresponding quantification. Scale bar, 500μm. For p-s: n = 5 mice/group; two-tailed unpaired Welch’s t-test. t, Representative images from lateral choroid plexuses whole mounts co-stained for anti-CD206 (cyan), anti-CD31 (red) and DAPI with corresponding high magnifications and quantification. Scale bars, 2mm and 200μm (insets). n = 5 mice treated with PBS, and 6 mice treated with CLO; two-tailed unpaired Welch’s t-test. u, Representatives images from deep cervical lymph nodes co-stained for anti-IBA1 (cyan) and DAPI and corresponding quantification. Scale bar, 200μm. n = 10 mice/group; two-tailed unpaired Welch’s t-test. All data are presented as mean values +/− SEM.
