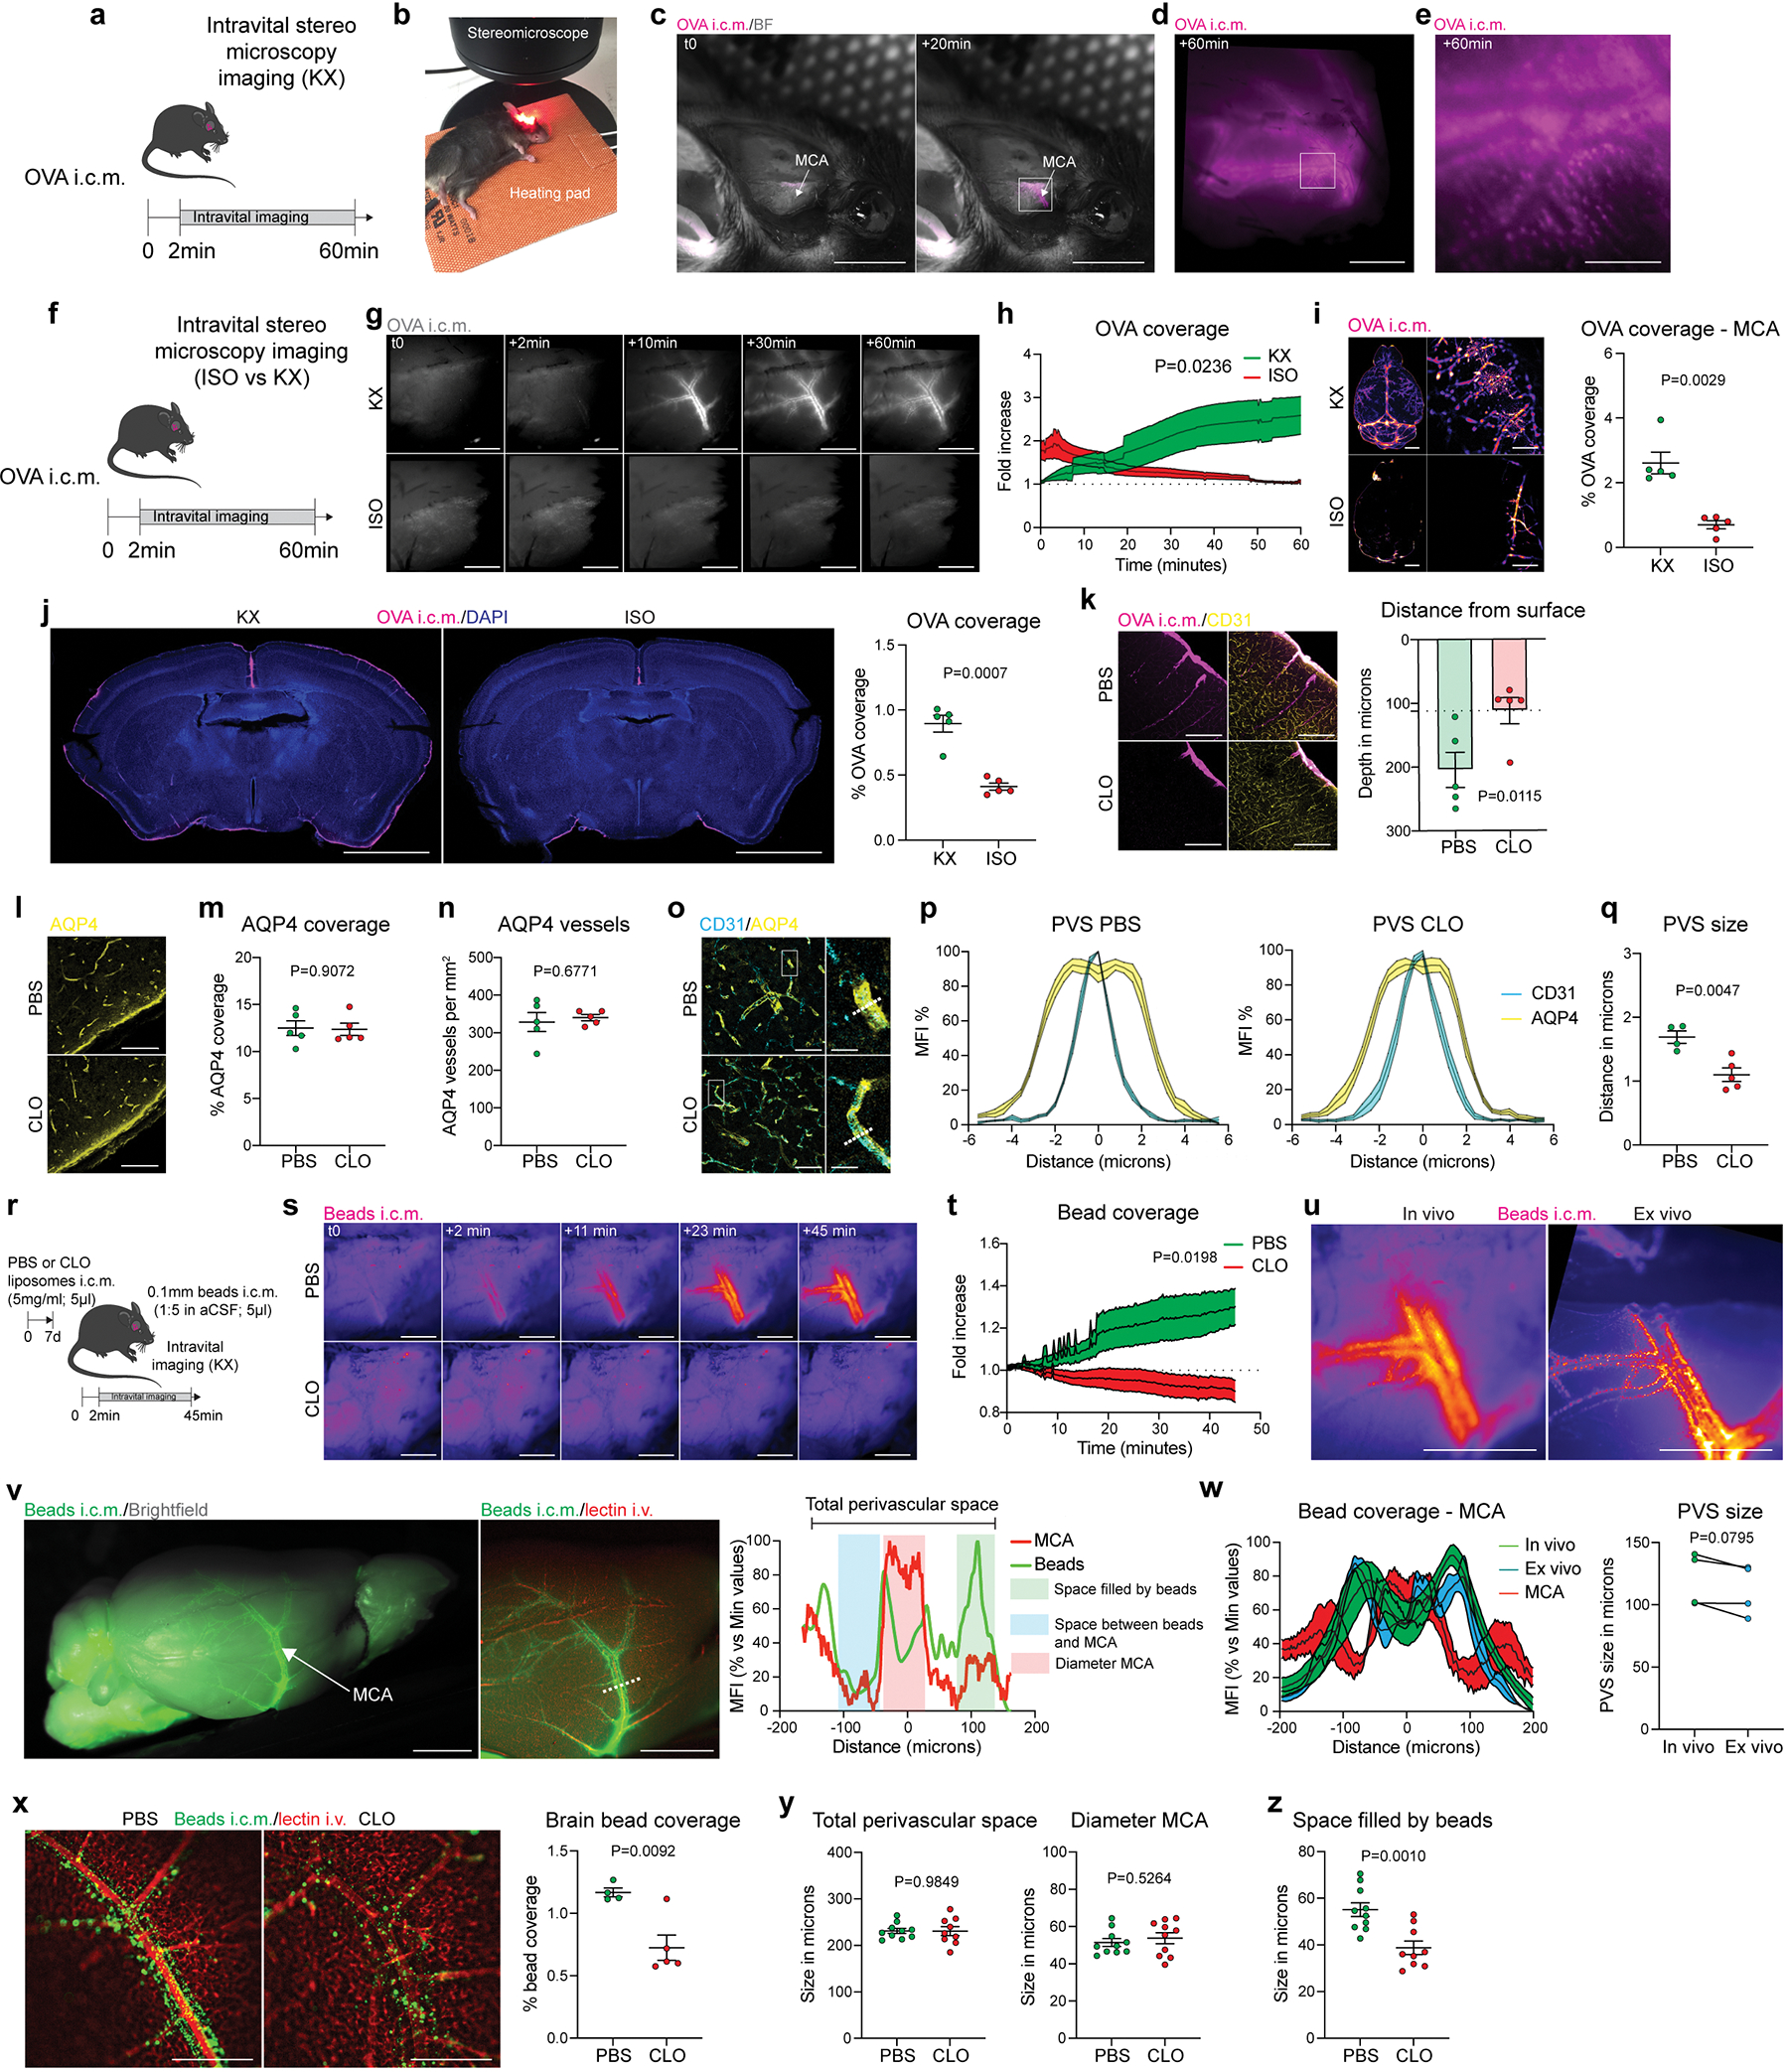
Extended Data Fig 4. In vivo recording of tracer diffusion at the middle cerebral artery (MCA) level and evaluation of the perivascular space.

A, Experimental schematic: One week after CLO or PBS liposome injection, mice were placed in a stereotaxic frame, the top and the right side of the head were shaved, the skin was incised, and the right temporalis muscle was gently removed. b, After cleaning the area with a cotton bud, mice received an i.c.m. injection of OVA and were immediately placed on their side under the stereomicroscope. c, Example of OVA distribution at the middle cerebral artery level (MCA) before and 20min after injection. Scale bar, 5mm. d, Inset of c. Higher magnification image showing OVA distribution one hour after injection. The tracer is located around the vessel, at the perivascular level. Scale bar, 1mm. e, High magnification from d showing that OVA can be sampled by perivascular cells. Scale bar, 100μm. f, Experimental schematic: mice were anesthetized with either KX or isoflurane (4% induction, 1–2% during dynamic imaging) and received an i.c.m. injection of OVA. Mice were maintained with the same anesthesia regime during the dynamic imaging. g, Representative images showing OVA distribution over time. Scale bar, 1mm. h, Quantification of OVA coverage over time. n = 5 mice/group; two-way ANOVA mixed-effects analysis (30 last min only). i and j, Mice were then perfused and whole brains were imaged by stereomicroscopy, then the brains were sliced and analyses were made on brain coronal sections. i, Representative images showing OVA distribution and quantification in whole brains and a zoom on the middle cerebral artery. Scale bars, 2mm (left panels) and 1mm (right panels). j, Representative images showing OVA coverage on brain coronal sections. Scale bar, 2mm. For i and j, n = 5 mice/group; two-tailed unpaired Welch’s t-test. k, One week after PBM depletion and one hour after i.c.m. injection of OVA, mice were perfused, brains were extracted, and OVA distribution was analyzed on coronal sections stained for DAPI, and corresponding quantification of OVA depth distribution from the brain surface. Scale bars, 100μm and 50μm (insets). n = 5 mice/group; two-tailed unpaired Welch’s t-test. l, Representative images showing anti-aquaporin 4 (AQP4) staining. Scale bar, 50μm. m, Quantification of AQP4 coverage. n, Quantification of AQP4+ blood vessels. For m and n, n = 5 mice/group; two-tailed unpaired Welch’s t-test. o, Brain sections were co-stained for anti-AQP4 (yellow) and anti-CD31 (cyan), and perpendicular lines to blood vessels were used to measure the perivascular space. Scale bars, 50μm and 10μm (insets). p, Representation of the perivascular space (PVS) in PBS (left) and CLO (right) treated mice. q, Quantification of perivascular space. n = 4 mice treated with PBS, and 5 mice treated with CLO; two-tailed unpaired Welch’s t-test. r, One week after PBM depletion, mice received an i.c.m. injection of fluorescent beads (0.1μm thick; 5μl) and then were immediately placed on their side under the stereomicroscope for dynamic bead imaging at the MCA level. s, Representative images showing bead distribution over an hour at the proximal part of the MCA. Scale bar, 1mm. t, Quantification of bead coverage at the MCA level over time. n = 4 mice treated with PBS, and 7 mice treated with CLO; repeated measures 2-way ANOVA with Geisser-Greenhouse correction. u, Representative images showing beads located at the MCA perivascular space in vivo (left) and ex vivo after perfusion with PBS and post-fixation in 4% PFA (right) from the same mouse. Scale bar, 1mm. v, Representative images from extracted whole brain showing bead repartition at low (left image) and higher magnification (right image) and corresponding plot profile. The beads (green line) are located outside of the MCA (red line), at the perivascular level. Scale bar, 2mm. w, Measure of the perivascular space (PVS) between in vivo and ex vivo from the same mice. n = 4 mice; Two-tailed paired t-test. x, Representative images showing ex vivo bead repartition at the MCA level in PBM-depleted mice and PBS-treated control mice, and corresponding quantification of bead coverage. Scale bar, 500μm; n = 4 mice treated with PBS, and 5 mice treated with CLO; two-tailed unpaired Welch’s t-test. y, Quantifications of total perivascular space (space between the two sides of the MCA where beads were found to accumulate) and MCA diameter (identified by the i.v. lectin injection). z, Quantification of the functional space where beads were found to be accumulated. For y and z: n = 10 mice treated with PBS, and 9 mice treated with CLO; two-tailed unpaired Welch’s t-test. All data are presented as mean values +/− SEM.
