Abstract
Resveratrol (Res) has anti-inflammation and antiosteoporosis functions. We evaluated the effect of Res on osteoclast differentiation by releasing inflammatory cytokines from osteoclast precursor RAW 264.7 cells stimulated by lipopolysaccharide (LPS). In the study, LPS (1 ng/L) was used to induce the Raw 264.7 inflammatory injury model in vitro. A total of 25 ng/mL M-CSF + 30 ng/mL RANKL or plus 1 μg/L LPS was used to induce osteoclastogenesis in the experiments. We utilized the Cell Counting Kit-8 assay to measure the relative cell survival of RAW 264.7 cells. Then, enzyme-linked immunosorbent assays were utilized to measure the abundance of inflammatory markers, such as interleukin-1 beta (IL-1β), tumor necrosis factor-alpha (TNF-α), and IL-6. Subsequently, Western blot analysis was applied to assess the abundance of phosphorylated transforming growth factor beta-activated kinase 1 (P-TAK1) protein, TNF receptor-associated factor 6 (TRAF6), nuclear factor-κB inhibitor protein (IκB), phosphorylated IκB-α (P-IκB-α), and nuclear factor κB65 (NF-κB65). mRNA expression levels of miR-181a-5p, TRAF6, specific gene calcitonin receptor (CTR), activated T nuclear factor 1 (NFATC1), cathepsin K (CTSK), and matrix metalloproteinase (MMP)-9 were determined via a real-time polymerase chain reaction. Osteoclast bone resorption function was determined. Finally, tartrate-resistant acid phosphatase (TRAP) staining was performed.The results found that Compared with the model group, the degrees of expressions of supernatant inflammatory factors TNF-α, IL-1β, and IL-6 were substantially attenuated in the Res treatment group (p < 0.05). Furthermore, the extent of miR-181a-5p expression in the RAW 264.7 cells significantly increased, whereas P-IκB-α, P-TAK1, NF-κB65, and TRAF6 expressions significantly decreased in the Res treatment group as opposed to the model group (p < 0.05). The CTR, NFATC1, MMP-9, CTSK, and TRAP mRNA expression levels were substantially reduced during osteoclast differentiation and bone resorption in the Res treatment group.The results suggest that Res can reduce the RAW 264.7 cell differentiation into osteoclasts and relieve LPS-stimulated osteoporosis, and the underlying mechanism may be associated with the Res-inhibited activity of the TRAF6/TAK1 pathway through the increased miR-181a-5p expression.
Keywords: raw 264.7 cells, osteoclast, resveratrol, miR-181a-5p, lipopolysaccharide
Introduction
As a common bone metabolic disease related to inflammation, primary osteoporosis is a systemic and metabolic illness whose characteristics include progressive bone loss, bone microstructure degeneration, and increased fragility and fracture susceptibility. This condition is caused by an increase in bone absorption or a decrease in bone formation. Furthermore, primary osteoporosis is mostly related to the maintenance of balance mediated by osteoblasts and osteoclasts. Osteoporosis is correlated with the risk factors of numerous other diseases. Osteoclasts, which are composed of multinucleated giant cells, are mainly distributed on bone surfaces and around vascular channels in bones. They perform an integral function in bone development, absorption, formation, and mass regulation. When activated, osteoclasts absorb organics and minerals from the bone matrix, which causes irregularities on the surface of the matrix and formation of cell-like lacunae.1 Tumor necrosis factor-α (TNF-α) and interleukin-1 (IL-1) suppress the production of osteoblast collagen and promote the synthesis of collagenase and matrix-degrading enzymes, thereby inhibiting the osteogenic function of osteoblasts and promoting osteoclast formation, bone absorption,2 and osteoporosis occurrence and development.
MicroRNAs (miRNAs) are endogenic, noncoding single-stranded RNAs with lengths between 19 and 22 nucleotides. At the post-transcription level, the binding of miRNAs to the supplementary sequence in the 3ʹ-untranslated region (3ʹ-UTR) of the target gene results in the degradation of this gene or suppression of its translation. Hence, mRNAs cannot be translated to produce the corresponding proteins, thereby reducing protein expression.3 miRNAs perform an integral function in cell proliferation, inflammation, differentiation, and apoptosis.3 In alveolar epithelial cells receiving macrophage treatment, miR-20b can reduce pyroptosis and inflammatory responses.4 miR-34c can inhibit neuropathic pain in mice with chronic sciatic nerve injury by inhibiting NLR family pyrin domain containing 3-mediated neuroinflammation.5 By downregulating the expression of toll-like receptor (TLR) 4 in human myeloid leukemia mononuclear cell (THP-1) macrophages, miRNA-21 may aid in minimizing the lipid buildup caused by BDE-209 exposure.6 Overexpressed microRNA-181a downregulates the nuclear factor kappa B (NF-κB)/TLR pathway by binding to cryptochrome-1, which alleviates renal tubular epithelial damage and glomerulosclerosis in rats suffering from chronic kidney disease.7 miR-181a inhibits the lipopolysaccharide (LPS)-elicited inflammatory reaction by blocking the TLR4–NF-κB activity and synthesis of reactive oxygen species (ROS). Within dendritic cells, miR-181a can suppress the inflammation caused by oxidative low-density lipoprotein stimulation by targeting c-FOS.8 Therefore, we hypothesized that miR-181a may also be implicated in the regulation of the capacity of RAW 264.7 cells to differentiate into osteoclasts. The underlying mechanism warrants further research.
TNF receptor-associated factor 6 (TRAF6) has been identified as the downstream protein of several receptor families with immunomodulatory functions, including the TNFR superfamily, TLR family, tumor growth factor-β receptor, and T cell receptor. Aside from the NF-κB pathway, TRAF6 activates mitogen-activated protein kinase (MAPK), phosphotidylinositol 3 kinase (PI3K), and interferon (IFN) regulatory factor pathways.9 LPS stimulation can cause TRAF6 ubiquitin, activated kinase 1 (TAK1), and growth factor β formed by compounds to activate further the NF-κB inhibitor protein (IκB) kinase family (IκB kinases and IκKs). As a result, NF-κB is prompted to migrate into the cell nucleus, causing inflammation reaction, including the elevation of the levels of inflammatory factors TNF-α and IL-6.10 Inhibition of the TRAF6/TAK1 signaling pathway may attenuate the synthesis of inflammatory markers and inflammatory damage of cells.
Resveratrol (Res) (3,5,4ʹ-trihydroxystilbene) is a natural polyphenolic chemical whose structural orientation is comparable to that of estrogen diethylstilbene; it is abundantly present in Polygonum cuspidatum, peanuts, grapes, and other plants.11 Res, which is considered a phytoestrogen, competitively binds to estrogen receptors in vitro with estrogen and exerts estrogen/antiestrogen-like functions.12 Res has antitumor, anticardiovascular disease, antioxidant, antibacterial, anti-inflammatory, and phytoestrogen functions, and it can protect the liver and regulate the immune system.13–16 Res inhibits the occurrence or reduces the degree of inflammation and shortens its duration by reducing cytokine production. Moreover, Res can promote the differentiation of bone marrow stromal cells into osteoblasts. Furthermore, it can increase the activity of alkaline phosphatase and proline light enzymes in a dosage-dependent manner. Res not only can promote the differentiation of osteoblasts but also inhibit the differentiation of adipocytes.17
Inflammation can enhance bone resorption and osteoclast formation and aggravate the osteoporosis induced by various causes. Inhibiting the development of inflammation may inhibit osteoclast formation and improve the osteoporosis induced by multiple causes. TRAF6 and miR-181a-5p can regulate endotoxin-induced inflammatory responses, whereas Res can inhibit anti-inflammatory effects. On the basis of TargetScan results, we suggested that TRAF6 may serve as a regulatory target of miR-181a-5p. Therefore, we speculated that miR-181a-5p can perform a regulatory function in the osteoporosis incidence and progression caused by inflammation. We investigated further whether Res suppresses the TRAF6 expression by enhancing miR-181A-5p expression, reducing endotoxin-mediated inflammation and differentiation of osteoclasts, and enhancing the osteoporosis due to multiple reasons.
Materials and methods
Drugs
Resveratrol (purity: 0.99, CAS:501-36-0) was obtained from Shaanxi Pioneer Biotech Co., Ltd. Shaanxi, China. RAW 264.7 cells were purchased from the China Cell Bank (Beijing, China). C25-140 (CAS NO. 1358099-18-9) was acquired from Nanjing Baixin Denuo Biotechnology Co., Ltd. Nanjing, China.
Cell culture and grouping
Mouse RAW 264.7 cells (China Cell Bank, Beijing, China) were subjected to incubation in a high-glucose Dulbecco’s Modified Eagle Medium that contained 10% fetal bovine serum in a cell incubator comprising 5% CO2 at a temperature of 37°C. Every 2–3 days, the medium was replenished and passed once every 3–4 days. The cells were resuscitated and passed every 2–3 generations after resuscitation. The experimental cells were classified into five groups, which included the following: a negative group with a complete culture medium containing only the same dose of dimethyl sulfoxide (DMSO) (as the solvent) and which served as the drug group; a model group with complete culture medium of 1 μg/mL LPS or 25 ng/mL M-CSF + 30 ng/mL RANKL plus 1 μg/L LPS or 100 nmol/L 1,25(OH)2D3 introduced on the basis of DMSO; a low-Res-concentration group with a complete culture medium containing 5 mol/L Res and 1 μg/L LPS; a middle-Res-concentration group with a complete culture medium containing 10 mol/L RES and 1 μg/L LPS; a high-Res-concentration group with a complete culture medium containing 20 mol/L Res and 1 μg/L LPS. This study was conducted at the Trauma Center of the First Affiliated Hospital of Kunming Medical University from June 2017 to May 2020.
Cell transfection
A proper amount of RAW 264.7 cells in the exponential growth phase was inoculated in a six-well plate. After 60% of the cells have attached to the plate wall overnight, the Lipofectamine 2000 transfection reagent was applied to transfect the miR-181a-5p inhibitor, miR-181a-5p mimic, mimic control, and inhibitor control into the RAW 264.7 cells in accordance with the package specifications. Subsequently, we changed the medium with new media at 6 h following transfection, and incubation was subjected to another 24 h. The cells were collected, and relevant indicators were identified via Western blot and real-time polymerase chain reaction (RT-PCR).
Cell viability
First, 96-well plates were employed to inoculate the cell suspension (100 μL) at a density of 1 × 10⁶/L and incubated at 37°C and 5% CO2. After excellent cell growth was achieved, the cells were classified at random into Res-treatment, model, and blank control subgroups. The experimental groups had three compound well plates each. In the treatment group, different concentrations of Res (5, 10, 15, 20, 30, 40, and 60 μmol/L) were administered for 1 h, followed by 24 h of LPS stimulation (1 μg/L). The model group was stimulated by LPS (1 μg/L) alone for 24 h. Once the treatment was completed, each well was supplied with 50 mL 3-(4,5-dimethythiazol-2-yl)-2,5-diphenyl tetrazolium bromide solution (5 g/L) and subsequently subjected to 2 h of incubation with 5% CO2. Then, we discarded the medium before adding 150 mL DMSO. The crystal particles were gently shaken for 5–10 min. After the crystal particles were fully dissipated, the absorbance (A) per group was detected at 540 nm with an enzyme micrometer. Each experimental test was carried out for a minimum of 3 times. The equation below was utilized to determine cell viability:
Cell viability (%) = (experimental group A − blank group A)/(negative control group A − blank group A) × 100%.
Tartrate-resistant acid phosphatase staining
RAW 264.7 cell lines that grew well were inoculated at a density of 2.5 × 10⁷/L into 48-well plates, with each well receiving 150 μL. Each experimental group had three compound well plates. Receptor activator of nuclear factor (NF)-kappa B ligand (RANKL) (100 g/L, Innovent Biopharmaceutical [Suzhou] Co., Ltd. Suzhou, China) and recombinant human macrophage colony stimulating factor (M-CSF) (25 ng/mL, Santa Cruz Biotechnology, Santa Cruz, CA) were cultured, followed by changing of the solution on the second day. At 5 days after the induction, the cells were stained with TRAP stain. Cell images were immediately observed under an inverted microscope. TRAP-positive multinucleated cells (five fields were randomly selected at 100x; cells with nuclei ≥ 3 were counted, and this step was repeated thrice) and fusion index (TRAP-positive polynuclear cells accounted for the percentage of TRAP-positive cells per well) were visualized with the aid of an inverted microscope.
Bone absorption test
RAW 264.7 cell lines that grew well were inoculated into 48-well phosphate (pre-luciferin-labeled chondroitin) bone resorption plates at a density of 3.5 × 10⁷/L, with each well receiving a concentration of 150 μL. Each experimental group had three compound well plates. The addition of 25 ng/mL M-CSF and 30 ng/mL RANKL was performed for each group to induce the RAW 264.7 cells to differentiate into osteoclasts. The culture was continued for 96 h, and 0.1 mL culture medium was extracted from each well into 96-well black label plates. We then measured the fluorescence intensity at 535 nm for the emission wavelength and 485 nm for the excitation wavelength. The bone plates were rinsed for 5 min using 5% sodium hypochlorite and then rinsed again using distilled water. This step was followed by natural drying at ambient temperature. The dissolution pits that formed on the absorption plate were visualized, imaged, and the number of bone lacunae was calculated with the aid of an inverted microscope. The bone resorption area was analyzed using Image ProPlus software. Relative bone resorption area (absorption area/total area) was used to represent bone resorption capacity.
Prediction of target gene
The miR-181a target gene was predicted using PicTar (http://pictar.mdc-berlin.de/ dc-berlin.de/), TargetScan (http://www.targetscan.org/), and Mir-base (http://www.mirbase.org/). Results showed that this target gene may be TRAF6. Routine procedures were utilized to generate the luciferase gene vectors of the mutation-type (MUT)- and wild-type (WT)-TRAF6. Two plasmids were integrated with miR-181a inhibitor, miR-181a mimic, mimic control, and inhibitor control, followed by transfection utilizing the Lipofectamine 2000 transfection reagent into the RAW 264.7 cells while complying with the guidelines stipulated by the manufacturer. The samples were labeled as WT + miR-181a mimics, MUT + miR-181a, WT + negative control, and MUT + negative control groups. After the incubation of cells in an incubator containing CO2 at 5% concentration for 48 h and a temperature of 37°C, we determined the dual-luciferase reporter gene activity. The levels of TRAF6 in overexpressing miR-181a RAW 264.7 cells were measured via Western blotting and RT-PCR.
Real-time fluorescent quantitative PCR
RAW 264.7 cell lines that grew well were inoculated at a density of 1 × 10⁵ cells/well in six-well plates, with a concentration of 150 μL allotted for each well. Each experimental group had three compound well plates. Osteoclasts were incubated for 1 h using 1 mg/L LPS, followed by induction with different concentrations of Res (0, 5, 10, and 15 μmol/L) and 100 ng/L RANKL until osteoclast formation was observed in the 0 mol/L Res group. Once the cells had been harvested, the total RNA was isolated via the TRIzoltechnique, followed by reverse transcription into cDNA via RT-PCR. The constituents of the reaction system included 10 μL SYBR Green, 8.5 μL ddH2O, 1 μL cDNA template, and 0.25 μL downstream and upstream primers. The procedure for the reaction was as follows: pre-denaturation for 2 min at a temperature of 50°C; a temperature of 95°C for 10 min; 40 cycles for 15 s at 95°C; and 1 min at 60°C. Three compound well plates were provided for each sample, and their fluorescence was estimated utilizing a real-time fluorescence quantifier (ABI 7500American Applied Biosystems, Massachusetts, USA). The levels of mRNA expressions of the osteoclast-specific gene calcitonin receptor (CTR), activated T nuclear factor 1 (NFATC1), miR-181a-5p, TRAF6, TRAP, matrix metalloproteinase (MMP)-9, and cathepsin K were evaluated via the 2−ΔΔCt method with β-actin as the standard control gene. The synthesis of the corresponding primers was performed by Sangon Biological Engineering Co., Ltd. (Shanghai, China). Table 1 depicts the primer sequences employed in the present research.
Table 1.
Sequences of the primers used in RT-PCR.
| Gene | Primer sequence |
|---|---|
| miR-181a-5p | F-5′-CAAATTATTGTGGGTTGTC-3′ |
| R-5′-TTATGGGTAGATGGGTGA-3′ | |
| U6 | F-5′-CTCGCTTCGGCAGCACA-3′ |
| R-5′-AACGCTTCACGAATTTGCGT-3′ | |
| CTSKmRNA | F-5′-ACTCAAAGTACCCCTGTCTCAT-3′ |
| R-5′- CCACAGAGCTAAAAGCCCAAC-3′ | |
| NFATC1mRNA | F-5′-ACAGAGTTACCATTGGCAGGA-3′ |
| R-5′- GCTTGAGATACCACCTTTCCG-3 | |
| TRAF6mRNA | F-5′-GCGCTGTGCAACTACATTT-3′ |
| 5′-AAGGATCGTGAGGCGTATTG-3′ | |
| RANKLmRNA | F-5′-TCCATAAGTGTGTCTGTCTC-3′ |
| 5′-GCTTCCTCCTTTCATCTGGGTAT -3′ | |
| RANKmRNA | F-5′- GAGCCTCCAAGCAGAACTGACTATATG -3′ |
| 5′-GCCTGTGTAGCCATCCGTTGAG -3′ | |
| Cathepsin KmRNA | 5′-GCTCTATCCCCGGAGGAAAC-3′ |
| 5′-TGCTTCCCGTGGGTCTTCT-3′ | |
| MMP-9mRNA | 5′-GGCAGTGACTTCAATGAGTGGT-3′ |
| 5′-AGACCTGAAGCAGCCTCTCT-3′ | |
| β-actin | 5′-AAAGACCTGTACGCCAACAC-3′ |
Western blot analysis
RAW 264.7 cell lines that grew well were inoculated at a density of 6 × 10⁸/L into six-well plates, with a value of 3 mL allotted for each well. Each experimental group had three compound well plates. First, 1 mg/L LPS was used in 1 h culture. Then, the cells were induced with Res (0, 5, 10, and 20 μmol/L) and 100 ng/L RANKL. After 24 h of intervention, the cells were rinsed twice using phosphate-buffered saline, followed by the addition of 200 μL cell protein lysate (including 1% protease inhibitor and 1% phosphatase inhibitor) and ice crack for 30 min. Afterward, the total protein of each cell group was extracted and centrifuged at a temperature of 4°C for 15 min. A BCA protein quantification kit was utilized to measure the protein purity. Subsequently, 50 μg extracted protein was isolated utilizing 10% sodium dodecyl sulphate-polyacrylamide gel electrophoresis, followed by the addition of 5% skimmed milk to facilitate incubation and blocking of the protein membranes for 1.5 h. Subsequently, we added the relevant p-IκB-a, p-TAK1, NF-κB65, RANKL, RANK, and TRAF6 primary antibodies (1:1000) at a temperature of 4°C overnight. On the following day, Tris-buffered saline with 0.1% Tween® 20 (TBST) was utilized to wash the membranes thrice. The membranes were supplied with horseradish peroxidase-labeled goat antirabbit IgG (diluted by the rate at 1:3000) and reacted for 1 h at ambient temperature. Then, the membrane was rinsed thrice again using TBST, with each wash lasting for 10 min. To generate color, we added an electrochemiluminescence solution. Image lab software was utilized to analyze the band gray value, and the endogenous control was represented by β-actin.
Enzyme-linked immunosorbent assay
RAW 264.7 cell lines that grew well were planted at a density of 2.5 × 10⁷/L in a six-well plate, with amounts reaching 3 mL for each well. Each experimental group had three compound wells. The cells were cultured for 1 h using 1 μg/mL LPS and subsequently induced with Res (0, 5, 10, and 15 mol/L), 25 ng/mL M-CSF, and 30 ng/mL RANKL. After intervention for 24 h, a supernatant sample of the cell culture was collected. ELISA was utilized to detect the contents of IL-6, IL-1β, and TNF-α in the cell supernatant following the guidelines stipulated by the manufacturer.
Statistical methods
The SPSS platform (version; 19.0) was utilized to execute analyses of all statistical data. The normally distributed statistical data were displayed as mean ± standard deviation (SD). In the present research, one-way analysis of variance was applied for comparisons involving two groups, whereas the Student–Newman–Keuls-q test was utilized to perform multiple comparisons across groups. Statistical significance was deemed to have been attained at p-value < 0.05.
Results
miR-181a-5p mimic attenuated RAW 264.7 cell inflammation mediated by LPS
The effects of miR-181a-5p mimic on RAW 264.7 cell inflammation stimulated by LPS were evaluated. To transfect the RAW 264.7 cells, we used either the miR-181a-5p inhibitor or incubated the cells with miR-181a-5p mimic for 48 h with LPS (l μg/mL) stimulation. ELISA was utilized to quantify the TNF-α, IL-6, and IL-1β levels in the supernatant. The findings demonstrated that the miR-181a-5p mimic alleviated the abundance of IL-1β, TNF-α, and IL-6 in RAW 264.7 cells through a concentration-dependent mechanism, as indicated in Figures 1(a)–(c).
Figure 1.
Effects of miR-181a-5p mimic on LPS-elicited RAW 264.7 cell inflammation. Transfection of RAW 264.7 cells with either an miR-181a-5p mimic or incubation with an miR-181a-5p inhibitor for 48 h when exposed to l ng/mL LPS. ELISA was utilized to measure the abundance of IL-6, IL-1β, and TNF-α in the supernatant. Results from two separate experimental tests are shown as mean ± SD. *p < 0.05 versus control subgroup. #p < 0.05 vs the model subgroup.
miR-181a-5p mimic alleviated the action of the TRAF6/TAK1 signaling pathway in RAW 264.7 cells
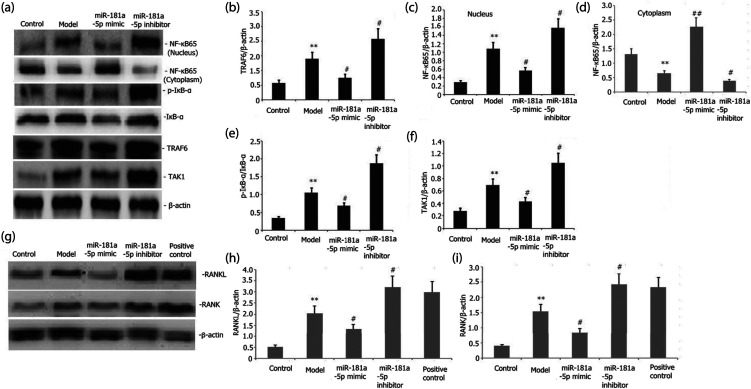
We examined the influence of miR-181a-5p mimic on the TRAF6/NF-kB/IkB signaling pathway activity in RAW 264.7 cells. Transfection of RAW 264.7 cells was performed with either an miR-181a-5p inhibitor or their incubation with miR-181a-5p mimic for 48 h with LPS (l μg/mL) stimulation. The levels of TAK1, phosphorylated IkB-α (p-IkB-α), NF-kB65, and TRAF6 protein expression in the RAW 264.7 cells were assayed via Western blot. Figures 2(a)–(f) illustrate that the miR-181a-5p mimic elevated the miR-181a-5p expression and attenuated the levels of protein expression of TRAF6, NF-kB65, p-TAK1, and p-IkB-α in a concentration-dependent mechanism in the RAW 264.7 cells.
Figure 2.
Effects of miR-181a-5p mimic on the TRAF6/NF-kB/IkB and RANKL/RANK signaling pathway activities of LPS-stimulated RAW 264.7 cells. Transfection of RAW 264.7 cells with either an miR-181a-5p mimic or their incubation with an miR-181a-5p inhibitor for 48 h when exposed to l ng/mL LPS or plus 25 ng/mL M-CSF + 30 ng/mL RANKL or 100 nmol/L 1,25(OH)2D3. The extent of p-IkB-α, RANKL, RANK, NF-kB65, and TRAF6 protein expressions in the RAW 264.7 cells was assayed via Western blotting. Results from two separate experimental tests are shown as mean ± SD. **p < 0.01 versus the control subgroup. #p < 0.05 versus the model subgroup.
miR-181a-5p mimic attenuated the NFATC1, cathepsin K (CTSK), RANKL, RANK, and MMP-9 expression levels in LPS-stimulated RAW 264.7 cells
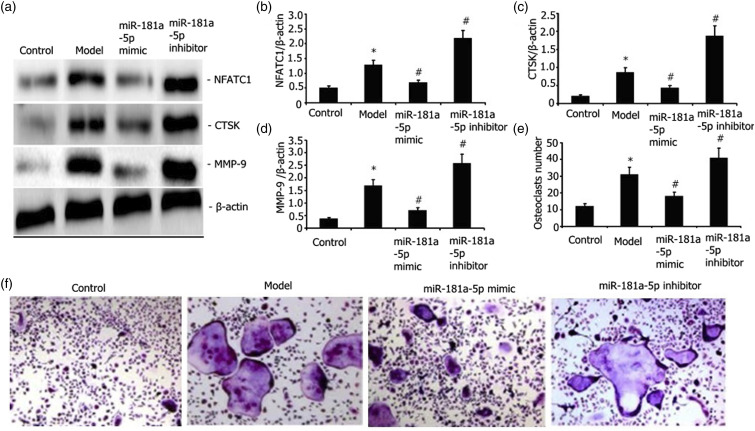
Transfection of RAW 264.7 cells was performed with either an miR-181a-5p mimic or their incubation with the miR-181a-5p inhibitor for 48 h with 25 ng/mL M-CSF + 30 ng/mL RANKL or plus 1 μg/L LPS or 100 nmol/L 1,25(OH)2D3 stimulation. The degrees of RANKL, RANK, NFATC1, CTSK, and MMP-9 expressions were assayed via Western blotting. As illustrated in Figures 3(a)–(d) and 2(g)–2(i), the miR-181a-5p mimic attenuated the degrees of RANKL, RANK, NFATC1, MMP-9, and CTSK expressions in LPS-stimulated RAW 264.7 cells.
Figure 3.
Influence of miR-181a-5p mimic on the LPS-mediated capacity of RAW 264.7 cells to differentiate into osteoclasts and the levels of MMP-9, CTSK, and NFATC1 protein expressions. Transfection of RAW 264.7 cells with either an miR-181a-5p mimic or their incubation with an miR-181a-5p inhibitor for 48 h when exposed to l ng/mL LPS+25 ng/mL M-CSF + 30 ng/mL RANKL. The levels of NFATC1, MMP-9, and CTSK expressions were assayed via Western blot. After TRAP staining, the number of osteoclasts was determined. Results from two separate experimental tests are shown as mean ± SD. *p < 0.05 versus the control group. #p < 0.05 versus the model subgroup.
miR-181a-5p mimic attenuated the LPS-stimulated RAW 264.7 cell differentiation into osteoclasts
We transfected RAW 264.7 cells with either an miR-181a-5p mimic or incubated them with miR-181a-5p inhibitor for 48 h with 25 ng/mL M-CSF+ 30 ng/mL RANKL or plus 1 μg/L LPS stimulation. The number of osteoclasts was determined after TRAP staining. The miR-181a-5p mimic attenuated the LPS-elicited RAW 264.7 cell differentiation into osteoclasts (Figures 3(e)–(f)).
Effect of miR-181a-5p inhibitor and TRAF6 inhibitor (C25-140) on NFATC1, CTSK, TAK1, NF-kβ, and MMP-9 mRNA expression levels in LPS-stimulated RAW 264.7 cells
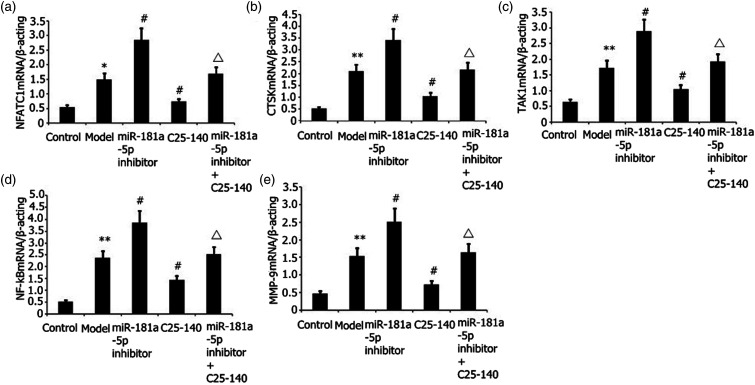
Transfection of RAW 264.7 cells was performed with an miR-181a-5p inhibitor for 48 h with 25 ng/mL M-CSF + 30 ng/mL RANKL or plus 1 μg/L LPS stimulation. The degrees of NFATC1, CTSK, TAK1, NF-kβ, and MMP-9 mRNA expressions were assayed via RT-PCR. As illustrated in Figures 4(a)–(e), the miR-181a-5p inhibitor increased the degrees of NFATC1, MMP-9, and CTSK expressions, and miR-181a-5p inhibitor and C25-140 decreased the degrees of NFATC1, MMP-9, and CTSK expressions in LPS-stimulated RAW 264.7 cells.
Figure 4.
Effects of miR-181a-5p inhibitor and TRAF6 inhibitor (C25-140) on NFATC1, CTSK, and MMP-9 expression levels in LPS-stimulated RAW 264.7 cells. Transfection of RAW 264.7 cells was performed with an miR-181a-5p inhibitor for 48 h with 25 ng/mL M-CSF + 30 ng/mL RANKL or plus 1 μg/L LPS stimulation. The degrees of NFATC1, CTSK, TAK1, NF-kB, and MMP-9 mRNA expressions were assayed via RT-PCR. Results from two separate experimental tests are shown as mean ± SD. **p < 0.01, *p < 0.05 versus the control subgroup. #p < 0.05 versus the model subgroup. △p < 0.05 versus the miR-181a-5p inhibitor and TRAF6 inhibitor (C25-140) subgroup.
Effect of miR-181a-5p inhibitor and TRAF6 inhibitor (C25-140) on LPS-stimulated RAW 264.7 cell inflammation and differentiation into osteoclasts
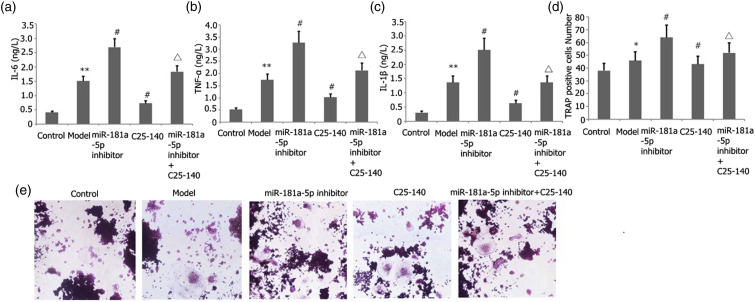
Transfection of RAW 264.7 cells was performed with an miR-181a-5p inhibitor for 48 h with 25 ng/mL M-CSF + 30 ng/mL RANKL or plus 1 μg/L LPS stimulation. ELISA was utilized to quantify the TNF-α, IL-6, and IL-1β levels in the supernatant. The number of osteoclasts was determined after TRAP staining. As illustrated in Figure 5, the miR-181a-5p inhibitor increased the degrees of IL-1β, TNF-α, and IL-6 expressions (Figures 5(a)–(c)), and LPS induced RAW 264.7 cell differentiation into osteoclasts (Figures 5(d)–(e)). miR-181a-5p inhibitor and C25-140 decreased the degrees of IL-1β, TNF-α, and IL-6 expressions (Figures 5(a)–(c)), and LPS elicited RAW 264.7 cell differentiation into osteoclasts (Figures 5(d)–(e)) in LPS-stimulated RAW 264.7 cells.
Figure 5.
Effect of miR-181a-5p inhibitor and TRAF6 inhibitor (C25-140) on LPS-mediated RAW 264.7 cell inflammation and differentiation into osteoclasts. Transfection of RAW 264.7 cells was performed with an miR-181a-5p inhibitor for 48 h with 25 ng/mL M-CSF + 30 ng/mL RANKL or plus 1 μg/L LPS stimulation. ELISA was utilized to quantify the TNF-α, IL-6, and IL-1β levels in the supernatant. The number of osteoclasts was determined after TRAP staining. Results from two separate experimental tests are shown as mean ± SD. **p < 0.01, *p < 0.05 versus the control subgroup. #p < 0.05 versus the model subgroup. △p < 0.05 versus the miR-181a-5p inhibitor and TRAF6 inhibitor (C25-140) subgroup.
Effects of Res on the viability of RAW 264.7 cells
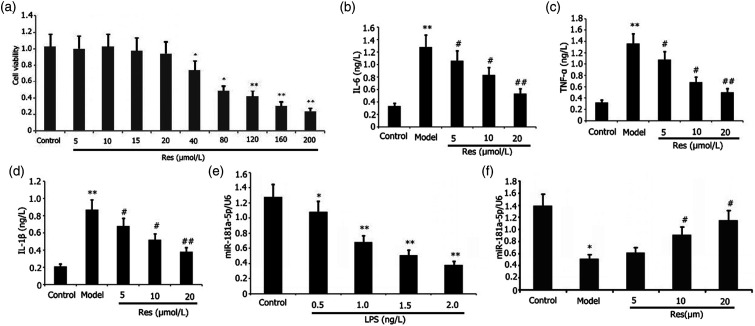
The RAW 264.7 cells were subjected to 24 h of incubation using different dosages of Res. We utilized the Cell Counting Kit-8 (CCK-8) assay to evaluate the viability of the RAW 264.7 cells. Subsequently, we observed that 20–60 μg/ml Res lowered the RAW 264.7 cell viability (Figure 6(a)). The viability of cells did not substantially change at the Res dosages of 5–15 μmol/L. The half-maximal inhibitory concentration IC50 was 43.86 μmol/L.
Figure 6.
Effects of Res on viability, inflammation, and miR-181a-5p expression in RAW 264.7 cells or LPS-induced RAW 264.7 cell inflammation. Incubation of RAW 264.7 cells with or without 1 mg/L LPS and varying doses of Res for 24 h. CCK-8 assay was utilized to determine the viability of RAW 264.7 cells. ELISA was utilized to determine the levels of IL-6, IL-1β, and TNF-α in the supernatant in LPS-induced RAW 264.7 cells. RT-PCR was utilized to determine the miR-181a-5p expression in LPS-induced RAW 264.7 cells. Results from two separate experimental tests are expressed as mean ± SD. **p < 0.01,*p < 0.05 versus the control group. ##p < 0.01, #p < 0.05 versus the model group.
Res attenuated RAW 264.7 cell inflammation mediated by LPS
We assessed the effects of Res on RAW 264.7 cell inflammatory reaction elicited by LPS. We inoculated RAW 264.7 cells with the aid of 1 mg/L LPS and different dosages of Res for 24 h before determining their expression levels. ELISA was utilized to measure the abundances of IL-6, IL-1β, and TNF-α in the supernatant. Res decreased the abundance of IL-6, IL-1β, and TNF-α in the supernatant in a concentration-dependent approach (Figures 6(b)–(d)). Dosages as low as 25 μg/mL Res decreased effectively the secretion of IL-1β, TNF-α, and IL-6 in the LPS-elicited RAW 264.7 cell inflammation.
Res enhanced miR-181a-5p expression in the LPS-elicited RAW 264.7 cells
We investigated the influence of LPS on the miR-181a-5p expression in RAW 264.7 cells. We incubated RAW 264.7 cells using different dosages of LPS for 24 h. Specifically, RAW 264.7 cells were subjected to treatment with 1 mg/L LPS and different dosages of Res for 24 h before their expression levels were determined. RT-PCR was utilized to examine the miR-181a-5p expression in RAW264.7 cells. As displayed in Figures 6(e)–(f), the degree of LPS expression was attenuated by Res, whereas Res increased miR-181a-5p expression in the LPS-elicited RAW 264.7 cells.
Res attenuated the action of TAK1/TRAF6 and RANKL/RANK signaling pathways in RAW 264.7 cells.
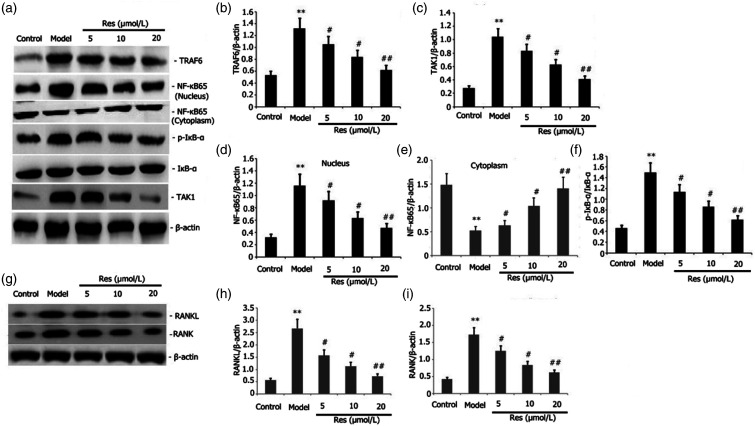
We probed into the effects of Res on the TRAF6/TAK1 and RANKL/RANK signaling pathway activities in RAW 264.7 cells. Incubation of RAW 264.7 cells was performed with 1 μg/L LPS or plus 25 ng/mL M-CSF + 30 ng/mL RANKL and various concentrations of Res for 24 h. The levels of RANKL, RANK, NF-kB65, p-IkB-α TAK1, and TRAF6 protein expressions in the RAW264.7 cells were assayed via Western blotting. We discovered that Res decreased the protein expression levels of RANKL, RANK, p-IkB-a, NF-kB65, and TRAF6 in the RAW 264.7 cells in a dosage-dependent manner (Figures 7(a)–(f)).
Figure 7.
Effects of Res on the activities of TRAF6/TAK1 and RANKL/RANK signaling pathway in LPS-stimulated RAW 264.7 cells. Incubation of RAW 264.7 cells with 1 mg/L LPS or plus 25 ng/mL M-CSF + 30 ng/mL RANKL and different dosages of Res for 24 h. Levels of protein expressions of RANKL, RANK, p-IkB-α, p-TAK1, NF-kB65, and TRAF6 in the RAW 264.7 cells were assayed via Western blotting. Results from two separate experimental tests are expressed as mean ± SD. **p < 0.01 versus the control subgroup. ##p < 0.01, #p < 0.05 versus the model subgroup.
Res inhibited the expression of related osteoclast genes
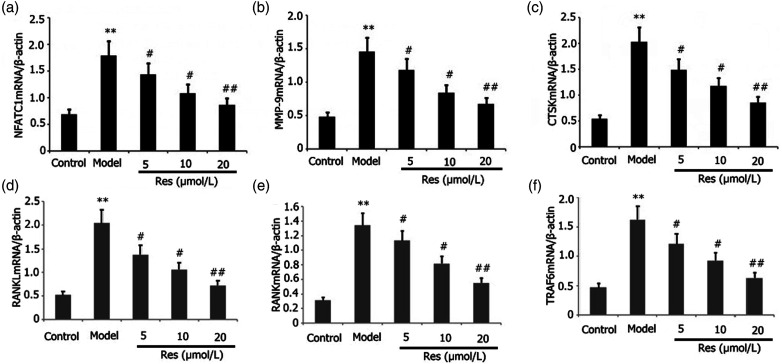
The influence of Res on the related osteoclast gene expressions in RAW 264.7 cells was evaluated. Incubation of RAW 264.7 cells was performed using 25 ng/mL M-CSF + 30 ng/mL RANKL or plus 1 μg/L LPS and distinct dosages of Res for 96 h. The degrees of mRNA expressions of RANKL, RANK, TRAF6, CTSK, MMP-9, and NFATC1 in the RAW 264.7 cells were assayed via RT-PCR. As depicted in Figures 8(a)–(f), Res attenuated the levels of mRNA expressions of RANKL, RANK, TRAF6, MMP-9, CTSK, and NFATC1 in the RAW 264.7 cells in a dosage-dependent manner.
Figure 8.
Effects of Res on the expression of related osteoclast genes in LPS-stimulated RAW 264.7 cells. Incubation of RAW 264.7 cells was performed with 1 mg/L LPS plus 25 ng/mL M-CSF + 30 ng/mL RANKL and distinct dosages of Res for 96 h. Levels of mRNA expressions of RANKL, RANK, TRAF6, MMP-9, CTSK, and NFATC1 in RAW 264.7 cells were assayed via RT-PCR. Results from two separate experimental tests are shown as mean ± SD. **p < 0.01 versus the control subgroup. ##p < 0.01, #p < 0.05 versus the model subgroup.
Res blocked the LPS-stimulated RAW 264.7 cell differentiation into osteoclasts
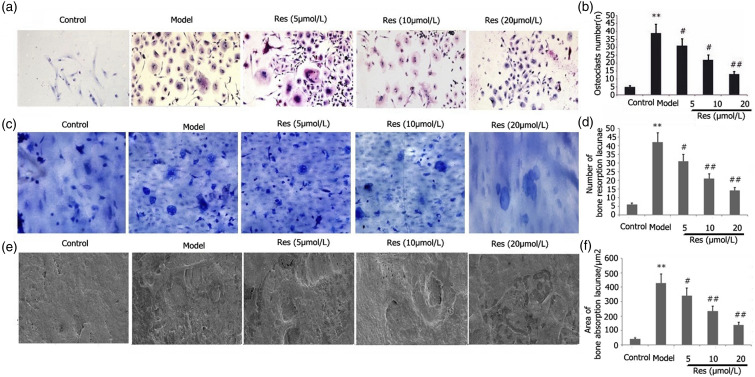
The effects of Res on the LPS-stimulated ability of RAW 264.7 cells to differentiate into osteoclasts were examined. Incubation of RAW 264.7 cells was performed using 25 ng/mL M-CSF + 30 ng/mL RANKL or plus 1 μg/L LPS and different doses of Res for 96 h. After TRAP staining, we quantified the osteoclasts. As illustrated in Figure 9, Res decreased the LPS-mediated capacity of RAW 264.7 cells to differentiate into osteoclasts in a dosage-dependent manner (Figures 9(a)–(b)).
Figure 9.
Effects of Res on the LPS-mediated ability of RAW 264.7 cells to differentiate into osteoblasts and their osteoclast bone resorption function. Incubation of RAW 264.7 cells was performed with 1 mg/L LPS plus 25 ng/mL M-CSF + 30 ng/mL RANKL and different doses of Res for 96 h. After TRAP staining, the proportion of osteoclasts and their capacity for bone resorption were determined. The bone resorption area and the number of bone lacunae were measured. Results from two separate experimental tests are shown as mean ± SD. *p < 0.01 versus the control subgroup. ##p < 0.01, #p < 0.05 versus the model subgroup.
Res blocked the osteoclastic resorption in LPS-stimulated RAW 264.7 cells
Res affected osteoclastic resorption in LPS-stimulated RAW 264.7 cells. Incubation of RAW 264.7 cells was performed using 25 ng/mL M-CSF + 30 ng/mL RANKL and different doses of Res for 96 h. The bone resorption area and the number of bone lacunae were measured. As depicted in Figure 9, Res attenuated bone resorption area and the number of bone lacunae in LPS-stimulated RAW 264.7 cells in a dosage-dependent manner (Figures 9(c)–(f)).
TRAF6 is a direct miR-181a-5p target
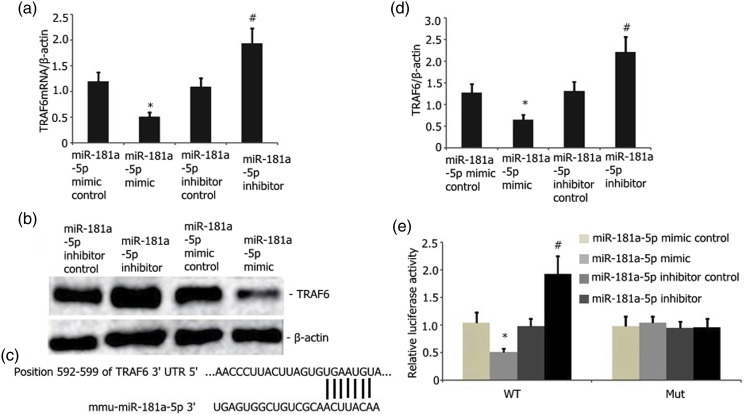
TargetScan was utilized to examine the possible miR-181a target. From all other prospective targets, TRAF6 was selected as a potential target owing to its critical functions in bone metabolism diseases such as osteoporosis. Subsequently, we measured the luciferase action of MUT and WT TRAF6 reporter in the RAW 264.7 cells. miR-181a-5p overexpression showed no influence on the activity of the MUT TRAF6 reporter. Nevertheless, it considerably attenuated the WT TRAF6 reporter luciferase activity in the RAW 264.7 cells (Figures 10(d)–(e)). Furthermore, the overexpression of miR-181a-5p attenuated the TRAF6 protein and mRNA (Figures 10(a)–(c)) levels in the RAW 264.7 cells. The miR-181a-5p inhibitor, on the other hand, reversed this effect (Figures 10(a)–(c)). Thus, TRAF6 functions as an miR-181a-5p target.
Figure 10.
TRAF6 is an miR-181a-5p downstream target. A) Overexpression of miR-181a-5p considerably decreased the TRAF6 mRNA levels in the RAW 264.7 cells stimulated by LPS (p < 0.05). miR-181a-5p downregulation substantially elevated the levels of TRAF6 (p < 0.05). B and C) Overexpressed miR-181a-5p substantially reduced the abundance of TRAF6 protein in the RAW 264.7 cells stimulated by LPS relative to that of the empty vector control (p < 0.05). miR-181a-5p downregulation considerably elevated the levels of TRAF6 protein in RAW 264.7 cells. E) miR-181a-5p bound to the 3′-UTR domain of TRAF6. This bond was disrupted in mutant TRAF6. F) Dual-luciferase reporter test revealed the binding of the miR-181a-5p mimic to the 3′-UTR domain of WT TRAF6 instead of the MUT TRAF6 (p < 0.05).
Discussion
Osteoporosis is a disorder characterized by postmenopausal estrogen deficiency. The development of osteoporosis begins in women at the age of 40 years and affects about 9.1% of this age group. The prevalence rate of osteoporosis increases to 20.5% in women aged 50–59 years and reaches 86.4% in women within the ages of 60–69 years. After the age of 70 years, all women develop osteoporosis to various extents.18 Osteoporosis is correlated with a great risk of fracture and poses a significant health challenge for postmenopausal women with estrogen deficiency. Estrogen performs an instrumental function in bone mineral dynamic balance, and estrogen deficiency is considered a major factor in bone mineral loss in postmenopausal osteoporosis.19 Postmenopausal osteoporosis is treated by hormone replacement therapy. Treatment of older postmenopausal women with standard doses of hormones can lead to abnormal uterine bleeding, whereas long-term estrogen use can cause coronary heart diseases, invasive breast cancer, and other adverse outcomes.20 Combined progesterone use may reduce the risk of endometrial hyperplasia.20 However, progesterone can contribute to a high risk of venous thrombosis among postmenopausal women treated with estrogen plus progesterone.21
Res enhances the mitochondrial biogenesis or osteogenic differentiation of periosteum-derived mesenchymal stem cells. It performs an integral function in the healing of fractures and maintenance of bone tissues.22 In vitro treatment with Res of primary human bone marrow stromal cells (BMSCs) in elderly patients, which were characterized by high adipocyte and low osteoblast differentiation, remarkably enhanced osteoblast differentiation and reduced adipocyte formation.23 Res therapy reduced the degrees of NF-κB and β-catenin protein expressions in TNF-α-induced BMSCs, increased the downregulated levels of OCN and Runx2 in TNF-α-induced BMSCs, and increased the differentiation of BMSCS into osteoblasts.23 However, the specific mechanism remains to be elucidated. In our research, Res increased the miR-181-a-5p expression, repressed the TRAF6/TAK1 signaling pathway activity, inhibited the activity of osteoclast precursor RAW 264.7 cell, reduced cell inflammation, restrained osteoclast differentiation of RAW 264.7 cells, reduced bone resorption, and inhibited the inflammation related to osteoporosis.
RAW 264.7 cells are the only cell line of osteoclast progenitor cells. They serve as osteoclast precursors at the late stage of differentiation, and their biological characteristics are relatively stable. Mature osteoclasts can be obtained under the induction of RANKL24 TRAP staining is an important indicator for the identification of osteoclasts, which can be positively stained owing to the abundance of TRAP in their cytoplasm.25 Therefore, we selected RAW 264.7 cells in the present research to establish an in vitro osteoclast model.
Inflammation performs an instrumental function in the progression of osteoporosis. Various inflammatory markers, namely, IL-17, IL-6, IL-1, and TNF-α, may upmodulate RANKL expression in the inflammatory joints among patients experiencing rheumatoid arthritis (RA).26 Activated T cells and synovial fibroblasts in RA synovial membrane can express RANKL, thus promoting osteoclast development and bone erosion and destruction; by contrast, other inflammatory mediators, notably IFN-γ, IL-27, IL-4, and IL-2, are inhibitors of osteoclast production.27 Inflammatory cytokines can disrupt the dynamic balance of bones by inducing osteoclast differentiation, increasing bone resorption, or inhibiting osteoblast maturation, thereby accelerating bone loss.28 LPS is an important proinflammatory agent. Therefore, in this study, we selected LPS and observed that LPS induction increased RAW 264.7 cell inflammation and osteoclast formation and promoted bone resorption.
TRAF6 can regulate osteoporosis in various ways. The present study discovered that the suppression of the tyrosine kinase C-SRC/TRAF6/PI3K pathway reduced NADPH oxidase-1 activation to reduce the production of intracellular ROS, downmodulate calmodulin activity, inhibit osteoblast differentiation, and reduce osteoblast formation.29 Eugenin upregulates osteoprotegerin (OPG) expression by downmodulating TRAF6 and inhibiting the levels of NF-κB and RANKL. This result suggested that eugenin prevents TRAF6-mediated NF-κB inhibition, leading to bone loss, which increases the OPG/RANKL ratio and inhibits osteoclast formation; ultimately, these effects promote bone formation.30 Shikimic acid inhibits the receptor activators of NF-κB and RANK/TRAF6 and the protein kinase signaling pathways activated by NF-κB and mitogen and downregulates activated T cytoplasmic nuclear factor 1, thereby substantially improving bone loss and preventing osteoclast formation in ovariectomized mice.31 The present study showed that LPS increased TRAF6/TAK1 activity, enhanced NF-kB65 and p-IKB-α expressions, compounded RAW 264.7 cell inflammation, boosted osteoclast formation, and promoted bone resorption. Res reduced the TRAF6/TAK1 activity, RAW 264.7 cell inflammation, and bone resorption and inhibited p-IKB-α and NF-kB65 expression levels and osteoclast formation.
miR-181a-5p performs an instrumental function in the modulation of inflammation and osteoporosis. miR-181A-3p and mir-181a-5p mimic slow down the progression of atherosclerosis by targeting NF-κB essential modulator (NEMO) and transforming growth factor βactivated kinase 1 binding protein 2 (TAB2) to prevent vascular inflammation and NF-κB activation.32 Reduction of miR-9 and miR-181A expression levels can activate the migration ability of RAW 264.7 cells and improve the in vitro survival rate of osteoclasts in plateau-generation mice, contributing to enhanced osteoclast development and promoted bone resorption.33 Estrogen downregulates miR-181a expression, which is a negative regulator of FasL and targets the 3ʹ-UTR of FasL mRNA. Estrogen deficiency leads to excessive miR-181A, which reduces the level of FasL protein and thus inhibits bone marrow mesenchymal stem cell (BMMSC)-induced osteoclast apoptosis.34 In addition, miR-181a knockout restores BMMSC defects and induces osteoclast apoptosis during estrogen deficiency.35 These findings illustrated that an increase in miR-181a expression may enhance BMMSC-induced osteoclast apoptosis, inhibit osteoclast formation, and lower bone resorption. Therefore, in this study, we selected miR-181a-5p and observed that the miR-181a-5p mimic increased miR-181a-5p expression, inhibited the action of the TRAF6/TAK1 pathway and osteoclast formation and decreased the degrees of p-IKB-α and NF-kB65 expressions, RAW 264.7 cell inflammation, and reduced bone absorption. Moreover, Res increased the miR-181a-5p expression, reduced TRAF6/TAK1 activity, RAW 264.7 cell inflammation, and bone resorption, and suppressed p-IKB-α and NF-kB65 expressions and osteoclast formation.
When RANKL binds to osteoclast progenitors or RANK on the surface of osteoclasts, TRAF6 can be recruited and then activated. TRAF6 is essential for RANK signaling in osteoclasts. Activated TRAF6 can trigger multiple downstream signaling pathways, specifically, the p38/MAPK and NF-κB pathways. These signaling pathways further activate downstream NFATC1,36 which is the main transcriptional factor for osteoclast differentiation. After activation, NFATC1 eventually affects the osteoclast-specific gene expressions, including those of MMP-9, CTSK, and TRAP, to promote bone resorption and osteoclast differentiation.37 In the present research, RES treatment reduced TRAF6 expression as the levels of RANKL, RANK, MMP-9, CTSK, and TRAP expression, thereby reducing osteoclast formation and bone resorption. These results illustrated that RES treatment reduces osteoclast formation and bone resorption by blocking the action of the RANKL/RANK/TRAF6 pathway. RANKL is mainly expressed in osteoclast-supportive cells, such as osteoblasts, osteocytes, and chondrocytes.38 However, the expression of RANKL is strongly induced by LPS in osteoprogenitor cells (RAW 264.7 cells). To prove the validity of RANKL expression in RAW 264.7 cells, we performed Western blotting using lysates derived from the positive control, such as 1,25(OH)2D3-stimulated stromal cells, and observed that 1,25(OH)2D3 can increase RANKL expression.
In this study, miR-181a-5 and TRAF6 regulated the LPS-elicited inflammation. To further clarify the mutual regulatory correlation between miR-181a-5 and TRAF6, we utilized TargetScan to identify the miR-181a-5p target gene. Results illustrated that TRAF6 may be the regulatory miR-181a-5p target. The mir-181a-5 mimic repressed the TRAF6 mRNA and protein expressions. Dual-luciferase reporter assay suggested that TRAF6 may function as a regulatory miR-181a-5p target. miR-181a-5p regulated LPS-induced osteoclast formation by targeting TRAF6.
Conclusion
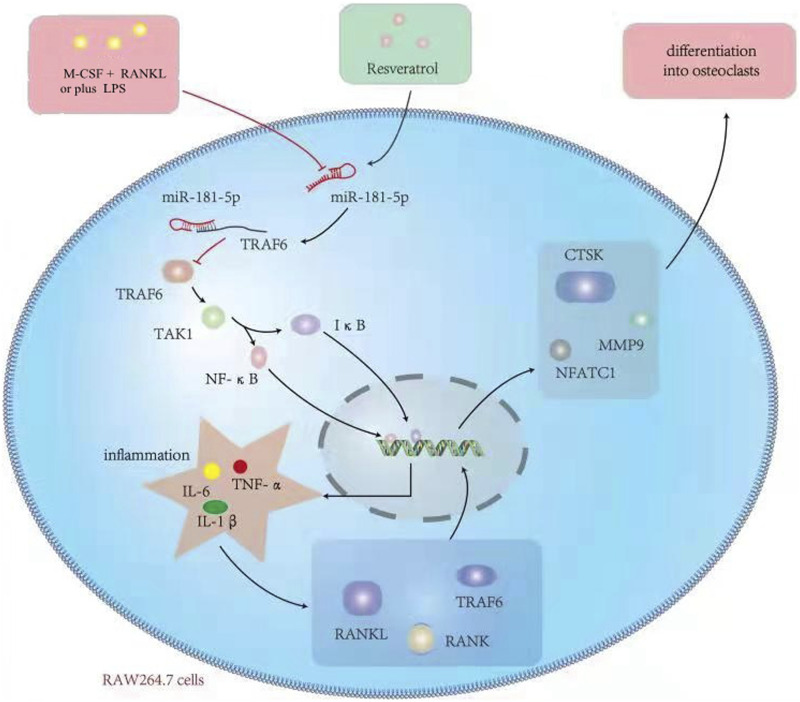
Res inhibits TRAF6 expression through enhancing the miR-181A-5p expression, reducing the endotoxin-mediated inflammatory response and osteoclast differentiation, and enhancing the osteoporosis caused by multiple reasons. The mechanism diagram is shown in Figure 11 (created by the authors). The basic theoretical foundation for the RES mechanisms of osteoporosis treatment is provided by the inflammation-induced osteoporosis model. Moreover, the present research revealed that TRAF6 serves as the regulatory target of miR-181A-5p.
Figure 11.
Mechanisms of the effects of Res on LPS-mediated activation of osteoclast precursor RAW 264.7 cells.
Limitations of this study
This study clarified that Res inhibited the LPS-mediated activation of osteoclast precursor RAW 264.7 cells by increasing the miR-181a-5p expression. However, this study still encountered several limitations. First, in addition to regulating TRAF6/TAK1, miR-181a-5p may regulate LPS-induced osteoporosis by regulating apoptosis, autophagy, iron death, scorch death, and other related pathways. Second, this study did not determine the 50% effective rate, maximum inhibitory concentration, and 50% minimum inhibitory concentration of Res in the treatment of LPS-induced osteoclast activity and bone resorption. The protective effect of Res treatment on LPS-induced bone injury may also be involved in the regulation of apoptosis, autophagy, iron death, scorch death, and other related pathways in addition to inflammation regulation. The addition of an in vivo animal model will be valuable. However, this study did not carry out animal experiments in vivo. Moreover, the other target genes of miRNA were not predicted in this study.
Footnotes
The author(s) declared no potential conflicts of interest with respect to the research, authorship, and/or publication of this article.
Funding: The author(s) received no financial support for the research, authorship, and/or publication of this article.
ORCID iDs
Ming-Wei Liu https://orcid.org/0000-0002-3728-2350
Guang Yang https://orcid.org/0000-0002-3890-3825
References
- 1.Kim I, Kim JH, Kim K, et al. (2019) The IRF2BP2-KLF2 axis regulates osteoclast and osteoblast differentiation. BMB Reports 52(7): 469–474. [DOI] [PMC free article] [PubMed] [Google Scholar]
- 2.Blaschke M, Koepp R, Cortis J, et al. (2018) IL-6, IL-1β, and TNF-α only in combination influence the osteoporotic phenotype in Crohn’s patients via bone formation and bone resorption. Advances in Clinical and Experimental Medicine 27(1): 45–56. [DOI] [PubMed] [Google Scholar]
- 3.Mohr AM, Mott JL. (2015) Overview of microRNA biology. Seminars in Liver Disease 35(1): 3–11. [DOI] [PMC free article] [PubMed] [Google Scholar]
- 4.Lou J, Wang YL, Zhang ZM, et al. (2017) MiR-20b inhibits mycobacterium tuberculosis induced inflammation in the lung of mice through targeting NLRP3. Experimental Cell Research 358(2): 120–128. [DOI] [PubMed] [Google Scholar]
- 5.Xu LJ, Wang QX, Wei Jiang W, et al. (2019) MiR-34c Ameliorates Neuropathic Pain by Targeting NLRP3 in a Mouse Model of Chronic Constriction Injury. Neuroscience 399: 125–134. [DOI] [PubMed] [Google Scholar]
- 6.Zhi H, Yuan N, Wu JP, et al. (2019) MicroRNA-21 Attenuates BDE-209-induced Lipid Accumulation in THP-1 Macrophages by Downregulating Toll-like Receptor 4 Expression. Food and Chemical Toxicology 125: 71–77. [DOI] [PubMed] [Google Scholar]
- 7.Liu L, Pang XL, Shang WJ, et al. (2018) Over-expressed microRNA-181a Reduces Glomerular Sclerosis and Renal Tubular Epithelial Injury in Rats With Chronic Kidney Disease via Down-Regulation of the TLR/NF-κB Pathway by Binding to CRY1. Molecular Medicine 24(1): 49. [DOI] [PMC free article] [PubMed] [Google Scholar]
- 8.Pei CZ, Zhang Y, Wang P, et al. (2019) Berberine alleviates oxidized low-density lipoprotein-induced macrophage activation by downregulating galectin-3 via the NF-κB and AMPK Signaling Pathways. Phytotherapy Research 33(2): 294–308. [DOI] [PMC free article] [PubMed] [Google Scholar]
- 9.Strickson S, Emmerich CH, Goh ETH, et al. (2017) Roles of the TRAF6 and Pellino E3 ligases in MyD88 and RANKL signaling. Proceedings of the National Academy of Sciences of the United States of America 114(17): E3481–E3489. [DOI] [PMC free article] [PubMed] [Google Scholar]
- 10.Liao HH, Zhang N, Meng YY, et al. (2019) Myricetin Alleviates Pathological Cardiac Hypertrophy via TRAF6/TAK1/MAPK and Nrf2 Signaling Pathway. Oxidative Medicine and Cellular Longevity 2019: 6304058. [DOI] [PMC free article] [PubMed] [Google Scholar]
- 11.Springer M, Moco S. (2019) Resveratrol and Its Human Metabolites—Effects on Metabolic Health and Obesity. Nutrients 11(1): 143. [DOI] [PMC free article] [PubMed] [Google Scholar]
- 12.Poschner S, Maier-Salamon A, Zehl M, et al. (2018) Resveratrol inhibits key steps of steroid metabolism in a human estrogen-receptor positive breast cancer model: impact on cellular proliferation. Frontiers in Pharmacology 9: 742. [DOI] [PMC free article] [PubMed] [Google Scholar]
- 13.Xia N, Daiber A, Förstermann U, et al. (2017) Antioxidant effects of resveratrol in the cardiovascular system. British Journal of Pharmacology 174(12): 1633–1646. [DOI] [PMC free article] [PubMed] [Google Scholar]
- 14.Malaguarnera L. (2019) Influence of Resveratrol on the Immune Response. Nutrients 11(5): 946. [DOI] [PMC free article] [PubMed] [Google Scholar]
- 15.Vestergaard M, IngmerH (2019) Antibacterial and antifungal properties of resveratrol. International Journal of Antimicrobial Agents 53(6): 716–723. [DOI] [PubMed] [Google Scholar]
- 16.Zhao H, Zhang Y, Shu L, et al. (2019) Resveratrol reduces liver endoplasmic reticulum stress and improves insulin sensitivity in vivo and in vitro. Drug Design Development and Therapy 13: 1473–1485. [DOI] [PMC free article] [PubMed] [Google Scholar]
- 17.Zhou T, Yan Y, Zhao C, et al. (2019) Resveratrol improves osteogenic differentiation of senescent bone mesenchymal stem cells through inhibiting endogenous reactive oxygen species production via AMPK activation. Redox Report 24(1): 62–69. [DOI] [PMC free article] [PubMed] [Google Scholar]
- 18.Gambacciani M, LevanciniM (2014) Management of postmenopausal osteoporosis and the prevention of fractures. Panminerva medica 56(2): 115–131. [PubMed] [Google Scholar]
- 19.Tella SH, Gallagher JC. (2014) Prevention and treatment of postmenopausal osteoporosis. Journal of Steroid Biochemistry and Molecular Biology 142: 155–170. [DOI] [PMC free article] [PubMed] [Google Scholar]
- 20.Paciuc J. (2020) Hormone Therapy in Menopause. Advances in Experimental Medicine and Biology 1242: 89–120. [DOI] [PubMed] [Google Scholar]
- 21.Marjoribanks J, Farquhar C, Roberts H, et al. (2017) Long-term hormone therapy for perimenopausal and postmenopausal women. Cochrane Database of Systematic Reviews 1(1): CD004143. [DOI] [PMC free article] [PubMed] [Google Scholar]
- 22.Moon DK, Kim BG, Lee AR, et al. (2020) Resveratrol can enhance osteogenic differentiation and mitochondrial biogenesis from human periosteum-derived mesenchymal stem cells. Journal of Orthopaedic Surgery and Research 15(1): 203. [DOI] [PMC free article] [PubMed] [Google Scholar]
- 23.Zhang A, Zhang X, Tan X, et al. (2015) Resveratrol rescued the TNF-α-induced impairments of osteogenesis of bone-marrow derived mesenchymal stem cells and inhibited the TNF-α-activated NF-кB signaling pathway. International Immunopharmacology 26(2): 409–415. [DOI] [PubMed] [Google Scholar]
- 24.Li J, Xin Z, Cai M. (2019) The role of resveratrol in bone marrow-derived mesenchymal stem cells from patients with osteoporosis. Journal of Cellular Biochemistry120 10: 16634–16642. [DOI] [PMC free article] [PubMed] [Google Scholar]
- 25.Ng AY, Tu C, Shen S, et al. (2018) Comparative characterization of osteoclasts derived from murine bone marrow macrophages and RAW 264.7 cells using quantitative proteomics. JBMR Plus 2(6): 328–340. [DOI] [PMC free article] [PubMed] [Google Scholar]
- 26.Xu H, Liu T, Li J, et al. (2019) Oxidation derivative of (-)-epigallocatechin-3-gallate (EGCG) inhibits RANKL-induced osteoclastogenesis by suppressing RANK signaling pathways in RAW 264.7 cells. Biomedicine & Pharmacotherapy 18: 109237. [DOI] [PubMed] [Google Scholar]
- 27.Adamopoulos IE. (2018) Inflammation in bone physiology and pathology. Current Opinion In Rheumatology 30(1): 59–64. [DOI] [PMC free article] [PubMed] [Google Scholar]
- 28.Andersson A, Bernardi AI, Stubelius A, et al. (2016) Selective oestrogen receptor modulators lasofoxifene and bazedoxifene inhibit joint inflammation and osteoporosis in ovariectomised mice with collagen-induced arthritis. Rheumatology (Oxford) 55(3): 553–563. [DOI] [PMC free article] [PubMed] [Google Scholar]
- 29.Geurts J, Patel A, Hirschmann MT, et al. (2016) Elevated marrow inflammatory cells and osteoclasts in subchondral osteosclerosis in human knee osteoarthritis. Journal of Orthopaedic Research 34(2): 262–269. [DOI] [PubMed] [Google Scholar]
- 30.Liu J, Zhang Z, Guo Q, et al. (2018) Syringin prevents bone loss in ovariectomized mice via TRAF6 mediated inhibition of NF-κB and stimulation of PI3K/AKT. Phytomedicine 42: 43–50. [DOI] [PubMed] [Google Scholar]
- 31.Hu B, Sun X, Yang Y, et al. (2019) Tomatidine suppresses osteoclastogenesis and mitigates estrogen deficiency-induced bone mass loss by modulating TRAF6-mediated signaling. FASEB Journal 33(2): 2574–2586. [DOI] [PubMed] [Google Scholar]
- 32.Chen X, Li X, Zhai X, et al. (2018) Shikimic acid inhibits osteoclastogenesis in vivo and in vitro by blocking RANK/TRAF6 Association and Suppressing NF-κB and MAPK Signaling Pathways. Cellular Physiology and Biochemistry 51(6): 2858–2871. [DOI] [PubMed] [Google Scholar]
- 33.Su Y, Yuan J, Zhang F, et al. (2019) MicroRNA-181a-5p and microRNA-181a-3p cooperatively restrict vascular inflammation and atherosclerosis. Cell Death and Disease 10(5): 365. [DOI] [PMC free article] [PubMed] [Google Scholar]
- 34.Shao B, Liao L, Yu Y, et al. (2015) Estrogen preserves Fas ligand levels by inhibiting microRNA-181a in bone marrow-derived mesenchymal stem cells to maintain bone remodeling balance. FASEB Journal 29(9): 3935–3944. [DOI] [PubMed] [Google Scholar]
- 35.Wang S, Tang C, Zhang Q, et al. (2014) Reduced miR-9 and miR-181a expression down-regulates Bim concentration and promote osteoclasts survival. International Journal of Clinical and Experimental Pathology 7(5): 2209–2218. [PMC free article] [PubMed] [Google Scholar]
- 36.Chen X, Zhi X, Yin Z, et al. (2018) 18β-Glycyrrhetinic Acid Inhibits Osteoclastogenesis In Vivo and In Vitro by Blocking RANKL-Mediated RANK-TRAF6 Interactions and NF-κB and MAPK Signaling Pathways. Frontiers in Pharmacology 9: 647. [DOI] [PMC free article] [PubMed] [Google Scholar]
- 37.Wehrhan F, Gross C, Creutzburg K, et al. (2019) Osteoclastic expression of higher-level regulators NFATc1 and BCL6 in medication-related osteonecrosis of the jaw secondary to bisphosphonate therapy: a comparison with osteoradionecrosis and osteomyelitis. Journal of Translational Medicine 17(1): 69. [DOI] [PMC free article] [PubMed] [Google Scholar]
- 38.Nakashima T, Hayashi M, Takayanagi H. (2012) New insights into osteoclastogenic signaling mechanisms. Trends in Endocrinology and Metabolism 23(11): 582–590. [DOI] [PubMed] [Google Scholar]


