Abstract
While previous studies have identified cancer stem‐like cells (CSCs) as a crucial driver for chemoresistance and tumor recurrence, the underlying mechanisms for populating the CSC pool remain unclear. Here, we identify hypermitophagy as a feature of human lung CSCs, promoting metabolic adaption via the Notch1‐AMPK axis to drive CSC expansion. Specifically, mitophagy is highly active in CSCs, resulting in increased mitochondrial DNA (mtDNA) content in the lysosome. Lysosomal mtDNA acts as an endogenous ligand for Toll‐like receptor 9 (TLR9) that promotes Notch1 activity. Notch1 interacts with AMPK to drive lysosomal AMPK activation by inducing metabolic stress and LKB1 phosphorylation. This TLR9‐Notch1‐AMPK axis supports mitochondrial metabolism to fuel CSC expansion. In patient‐derived xenograft chimeras, targeting mitophagy and TLR9‐dependent Notch1‐AMPK pathway restricts tumor growth and CSC expansion. Taken together, mitochondrial hemostasis is interlinked with innate immune sensing and Notch1‐AMPK activity to increase the CSC pool of human lung cancer.
Keywords: cancer stem‐like cell, mitophagy, TLR9, Notch1, AMPK
Subject Categories: Cancer, Signal Transduction, Stem Cells & Regenerative Medicine
Lung cancer stem‐like cells show high levels of mitophagy, resulting in lysosomal mtDNA accumulation that activates TLR9 and Notch1‐AMPK signaling. The TLR9‐Notch1‐AMPK pathway promotes CSC expansion and can be therapeutically targeted.

Introduction
Lung cancer is the leading cause of cancer‐related death worldwide. Non‐small‐cell lung cancer (NSCLC) accounts for > 80% of clinical cases and is frequently diagnosed at advanced stages (Kim & Giaccone, 2018). A significant proportion of NSCLC patients are unsuitable for targeted therapies and do not respond well to immunotherapy (Chan & Hughes, 2015; Wang et al, 2017; Hendriks et al, 2018), leaving chemotherapy still a critical option. However, chemoresistance seems ultimately inevitable, leading to cancer recurrence (Wang et al, 2017). Although studies have identified extracellular factors such as tumor microenvironment and intracellular factors, including transporter pumps (Bosc et al, 2017; Wang et al, 2018), mechanisms underpinning chemoresistance are still obscure.
Cancer stem‐like cells (CSCs) are a subpopulation of cancer cells with a high capacity for tumor initiation and self‐renewal (Bao et al, 2013). Accumulating studies have assigned a crucial role for CSCs in driving chemoresistance and cancer recurrence (Abdullah & Chow, 2013). Many current chemotherapies in clinical practice fail to eradicate CSCs but instead favor the expansion of the CSC population (De Francesco et al, 2018; Wang et al, 2018). Consequently, mechanistic investigations on CSC expansion and therapeutic explorations are relevant for blocking chemoresistance.
Phenotypically, the cluster of differentiation 133 (CD133) has been established as a critical marker of stemness in solid tumors, including NSCLC (Glumac & LeBeau, 2018). Aldehyde dehydrogenases (ALDH), a group of enzymes that catalyze the oxidation of aldehydes to carboxylic acids, is also a well‐acknowledged marker for CSCs (Prabavathy et al, 2018). Non‐small‐cell lung cancer CSCs are essentially identified by their phenotypic features and CSC capacities, including sphere formation and tumor initiation (Chan & Hughes, 2015). Mechanistically, CSCs typically demonstrate persistent activation of one or more highly conserved pathways, including the Notch, Hedgehog, and Wnt pathways that enable stem‐like properties (Takebe et al, 2015; Matsui, 2016). Of interest, Notch1 is essential for maintaining the self‐renewal and chemoresistance of human NSCLC CSCs (Zhang et al, 2017). However, mechanisms underpinning the induction and function of Notch1 in NSCLC CSCs remain unclear.
Cancer stem‐like cells are not only phenotypically and functionally but also metabolically distinct from non‐CSCs (De Francesco et al, 2018). Tumoral non‐CSCs increase the glycolytic flux in aerobic conditions through the well‐described Warburg effect; accumulating studies have assigned mitochondrial oxidative phosphorylation a pivotal role in CSC metabolism (De Francesco et al, 2018). For example, CSCs isolated from cervical and ovarian cancer patients have an upregulation of enzymes involved in mitochondrial oxidative phosphorylation compared with non‐CSCs (De Francesco et al, 2018). Small‐cell lung cancer CSCs show a higher dependence on mitochondrial oxidative phosphorylation (De Francesco et al, 2018). Glioma CSCs also produce less lactate and maintain high ATP levels from oxidative phosphorylation (De Francesco et al, 2018). Such findings regard hypermitochondrial metabolism as a feature of CSCs. However, mitochondrial hemostasis and its association with Notch1 in NSCLC CSCs remain inclusive.
Mitophagy, the selective autophagic degradation of damaged mitochondria inside lysosomes, is crucial for maintaining mitochondrial quality and hemostasis (Onishi et al, 2021). Mechanistically, mitophagy in mammals is typically mediated by a pathway comprised of PTEN‐induced putative protein kinase 1 (PINK1), which accumulates on damaged mitochondria and induces mitophagy through phosphorylation of E3‐ubiquitin ligase PARKIN (Murakami et al, 2021). Given the active mitochondrial oxidative phosphorylation in CSCs, mitophagy should be reasonably relevant to the CSC expansion (Sin et al, 2016; Lampert et al, 2019). How mitophagy is involved in CSC expansion remains unknown.
In this study, we analyzed the activity and function of mitophagy in NSCLC CSC pool population and identify hypermitophagy as critical in driving CSC expansion. Mitophagyhigh resulted in increased lysosomal mitochondrial DNA (mtDNA), triggering TLR9 signaling for subsequent Notch1‐dependent AMPK activation in CSCs. Activation of the TLR9‐dependent Notch1‐AMPK pathway led to enhanced mitochondrial metabolism for increasing the CSC pool. Combining chemotherapy with specific inhibitors targeting mitophagy, TLR9 and the Notch1‐AMPK pathway abrogates CSC expansion in NSCLC patient‐derived xenograft (PDX) chimeras.
Results
Hypermitophagy drives Notch1 activation to expand the CSC pool
To access the realistic phenotypic mitophagy in CSCs and non‐CSCs of NSCLC patients, primary CSCs from NSCLCL tissues were enriched by the sphere‐forming culture. For some experiments that require a relatively large number of cells, NSCLC patient‐derived organoids (PDOs) were established to overcome the obstacle of the limited volume of NSCLC tissues. Immunostainings of PanCK and CD31, as well as the HE staining, demonstrated similar results from the PDOs and ex vivo NSCLC tissues (Fig EV1). We first analyzed the expressions of stem‐related genes, sphere formation capacity, and Notch1 activity in CSCs and non‐CSCs to obtain their baseline characteristics. Such tumor‐sphere CSCs exerted robust expressions of ALDH1A1 and OCT4 (Appendix Fig S1A and B), accompanied by enhanced sphere‐forming capacity (Appendix Fig S1C), discriminating them from adherent non‐CSCs. Notably, such CSCs showed elevated levels of Notch1 activity than non‐CSCs (Appendix Fig S1D).
Figure EV1. Establishment of PDOs.
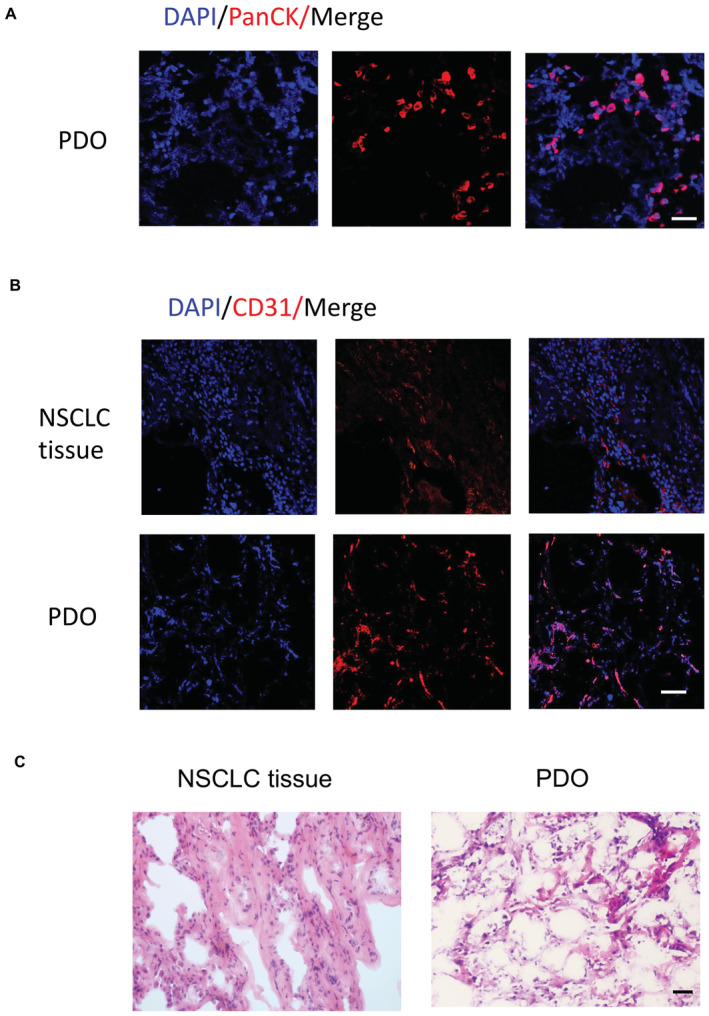
- Nuclei stained with DAPI (Scale bar, 50 μm). Representative from five samples.
- NSCLC tissues and corresponding PDOs were imaged for microvasculature by analyzing CD31‐expressing endothelial cells. Nuclei stained with DAPI (Scale bar, 100 μm). Representative from five samples.
- Representative H&E images of parental tumors and corresponding PDOs (Scale bar, 20 μm).
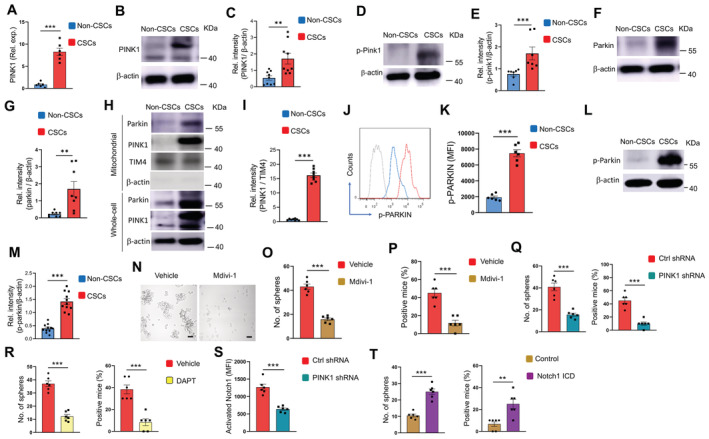
Given the well‐acknowledged PINK1/Parkin‐mediated mitophagy, we analyzed the mRNA and protein levels of PINK1 in NSCLC CSCs and non‐CSCs and observed an increased level of PINK1 expression in CSCs (Fig 1A–C). The autophosphorylation of Ser228 in PINK1 is essential for the efficient mitochondrial localization of Parkin (Okatsu et al, 2012). Accordingly, such a phosphorylated PINK1 was higher in NSCLC CSCs (Fig 1D and E), which was accompanied by elevated levels of Parkin (Fig 1F and G). Remarkably, endogenous PINK1 and Parkin were accumulated within mitochondrial fractions of NSCLC CSCs (Fig 1H and I). Furthermore, accumulated mitochondrial PINK1 was in line with the higher level of phosphorylated Parkin in CSCs (Fig 1J–M). Consequently, Mitofusin 2 (MFN2), which functions as a mitochondrial receptor for Parkin, was ubiquitylated in response to mitochondrial accumulation of Parkin in CSCs (Fig EV2A and B). In collective, such findings pinpoint hypermitophagy as a feature for NSCLC CSCs, which was also supported by the increased conversion of LC3B‐I into LC3B‐II (Fig EV2C) and the robust colocalized staining of mitochondria and lysosome organelles (Fig EV2D).
Figure 1. Hypermitophagy drives Notch1 activity and CSC expansion.
-
AmRNA expressions of PINK1 in CSCs and non‐CSCs. Mean ± SEM from six patients.
-
B, CImmunoblot analysis of PINK1 protein in non‐CSCs and CSCs. Representative and mean ± SEM from nine patients.
-
D, EImmunoblot analysis of p‐PINK1 protein in non‐CSCs and CSCs. Representative and mean ± SEM from seven patients.
-
F, GImmunoblot analysis of Parkin protein in non‐CSCs and CSCs. Representative and mean ± SEM from eight patients.
-
H, IPINK1 and Parkin protein levels in mitochondrial fractions and whole cell lyses of CSCs and non‐CSCs. Representative and mean ± SEM from eight patients.
-
J, KIntracellular levels of p‐Parkin protein in non‐CSCs and CSCs were analyzed using flow cytometry. Representative histograms and mean ± SEM from six patients.
-
L, MImmunoblot analysis of p‐Parkin protein in non‐CSCs and CSCs. Representative and mean ± SEM from 11 patients.
-
N–PCSCs were treated with Mdivi‐1 (50 μM) and analyzed for sphere formation plus tumorgenicity. Mean ± SEM from six experiments. Scale bar 20 mm.
-
QCSCs transfected with PINK1 shRNA or the control were analyzed for sphere formation and tumorgenicity. Mean ± SEM from six experiments.
-
RCSCs were treated with DAPT (10 μM) and analyzed for sphere formation and tumorgenicity. Mean ± SEM from six experiments.
-
SCSCs were transfected with PINK1 shRNA or control, and analyzed for activated Notch1. Mean ± SEM from six patients.
-
TCSCs with or without transfection of Notch1 ICD were treated with Mdivi‐1 (50 μM) and analyzed for sphere formation plus tumorgenicity. Mean ± SEM from six experiments. Data information: Paired t‐test with Bonferroni method, **P < 0.01, ***P < 0.001.
Source data are available online for this figure.
Figure EV2. Hypermitophagy in CSCs.
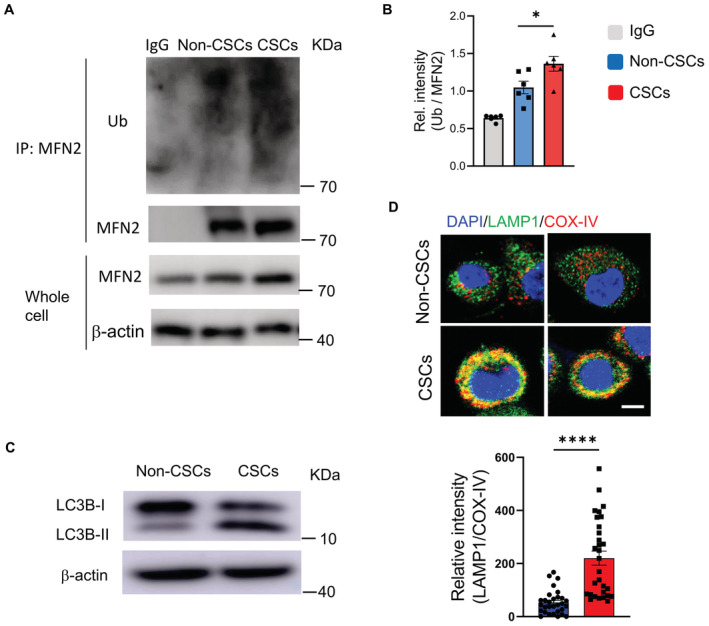
- MFN2 protein was immunoprecipitated from CSCs and non‐CSCs and analyzed for ubiquitination. A representative from six patients.
- Collective mean ± SEM for MFN2 ubiquitination from six patients. One‐way ANOVA, *P < 0.05.
- Protein expressions of LC3B and phosphor‐Parkin in CSCs and non‐CSCs. Representative from six patients.
- Confocal imaging for colocalized LAMP1 and COX‐IV in CSCs and non‐CSCs. Scale bar, 5 μm. Representative and collective data (mean ± SEM) from six patients.
Data information: Unpaired t‐test, ****P < 0.0001.
Source data are available online for this figure.
To determine the function of hypermitophagy in CSCs, we next investigated the effect of mitochondrial division inhibitor 1 (Mdivi1), a mitophagy inhibitor that could reduce the expression of mitophagy mediators (Bhatia et al, 2019), on sphere formation and tumor initiation of NSCLC CSCs. Mdivi1 impaired the accumulation of Parkin on mitochondrial fractions (Fig EV3A and B) and the fusion of the autophagosome with lysosomes in CSCs, resulting in higher levels of the mCherry‐GFP LC3 (Fig EV3C and D). Mdivi1 also inhibited sphere formation and tumor initiation of CSCs (Fig 1N–P), indicating a critical role of mitophagy for NSCLC CSC pool expansion. In consistent, genetic knockdown of PINK1, a process that dramatically reduced the expression levels of PINK1 (Appendix Fig S2A), efficiently abrogated the elevated p‐PARKIN in CSCs (Appendix Fig S2B), which was accompanied by decreased sphere formation and tumor initiation (Fig 1Q). In essence, hypermitophagy is required for populating the CSC pool in NSCLC patients.
Figure EV3. Mdivi1 impairs the mitochondrial accumulation of Parkin and the fusion of the autophagosome with lysosomes in CSCs.
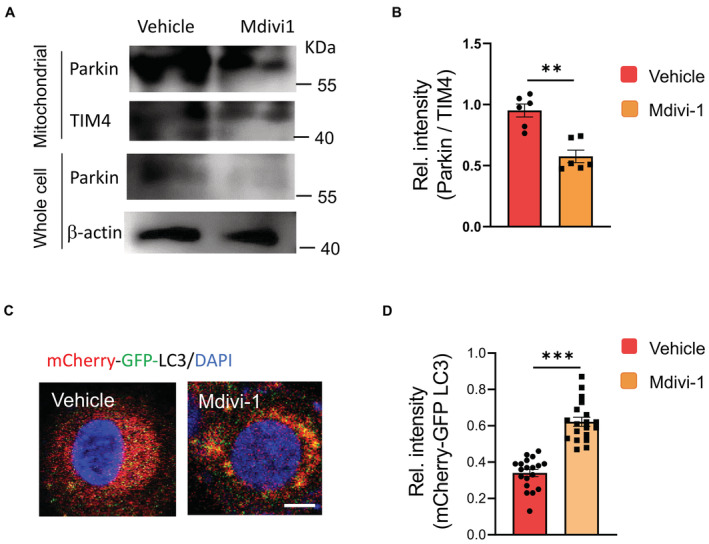
- CSCs with or without Mdivi1 treatment were analyzed to detect Parkin protein levels in mitochondrial fractions and whole cells. Representative from six patients.
- Mitochondrial accumulation of Parkin protein in CSCs +/− Mdivi1 treatment. mean ± SEM from six patients.
- CSCs were transfected with mCherry‐GFP‐LC3 and treated +/− Mdivi1. Lysosomal fusion with such LC3 protein eradicates GFP, leaving red staining of LC3. Vice versa, strong yellow staining in Mdivi1‐treated CSCs indicates impaired autophagosome fusion with the lysosome. Scale bar, 5μm. Representative from six patients.
- Relative intensities of mCherry‐GFP‐LC3 in CSCs +/− Mdivi1 treatment. Collective data (mean ± SEM) from six patients.
Data information: Paired t‐test, **P < 0.01, ***P < 0.001.
Source data are available online for this figure.
Blocking Notch1 activity with DAPT efficiently inhibited the sphere formation and tumor initiation of NSCLC CSCs (Fig 1R), confirming the crucial role of Notch1 activity in CSC expansion. Thus, we analyzed the potential role of hypermitophagy in inducing Notch1 activity to explore how mitophagy instructed CSC expansion. We found that blockade of mitophagy by PINK1 knockdown fundamentally inhibited the Notch1 activity, evidenced by reduced activated Notch1 (Fig 1S), and decreased HES1 levels (Appendix Fig S2C). By contrast, DAPT exerted no significant effect on total Parkin, phosphor‐Parkin, mitochondrial accumulation of Parkin, and MFN2 ubiquitination in CSCs (Fig EV4). The mitochondrial load of Parkin, total Parkin, and phosphor‐Parkin (Fig EV4A and B), as well as the total MFN2 and ubiquitinated MFN2 (Fig EV4C and D), were generally comparable in CSCs with or without DAPT treatment. Furthermore, Notch1 ICD transfection of NSCLC CSCs significantly restored their sphere formation and tumor initiation under Mdivi‐1 treatment (Fig 1T). Thus, hypermitophagy is a feature for CSCs, driving Notch1 activity for CSC pool expansion in NSCLC patients.
Figure EV4. Notch1 exerts no significant effect on mitophagy in CSCs.
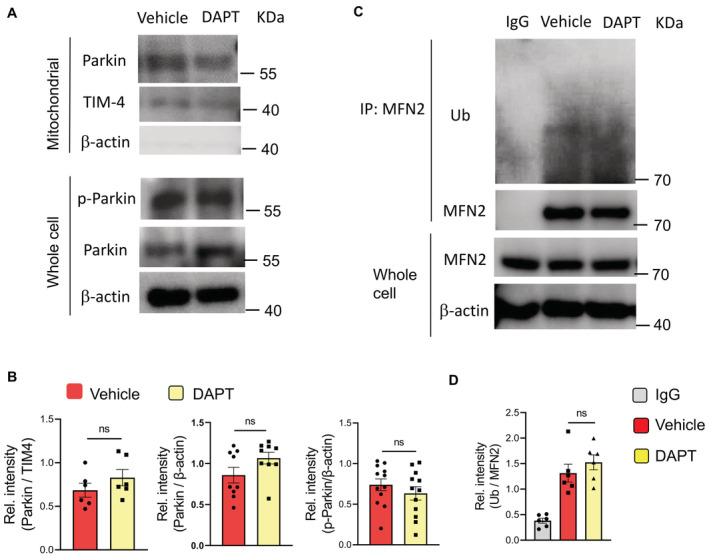
- CSCs with or without DAPT treatment were analyzed for total Parkin and phosphor‐Parkin levels in the mitochondrial fractions and/or whole cells. Representative from six patients.
- Total Parkin, phosphor‐Parkin, and mitochondrial Parkin proteins in CSCs +/− DAPT treatment. Mean ± SEM from six patients. Paired t‐test.
- CSCs with or without DAPT treatment were analyzed for MFN2 ubiquitination. Representative from six patients.
- MFN2 ubiquitination in CSCs +/− DAPT treatment.
Data information: Mean ± SEM from six patients. Paired t‐test.
Source data are available online for this figure.
Hypermitophagy results in lysosomal mtDNA‐dependent TLR9 activation
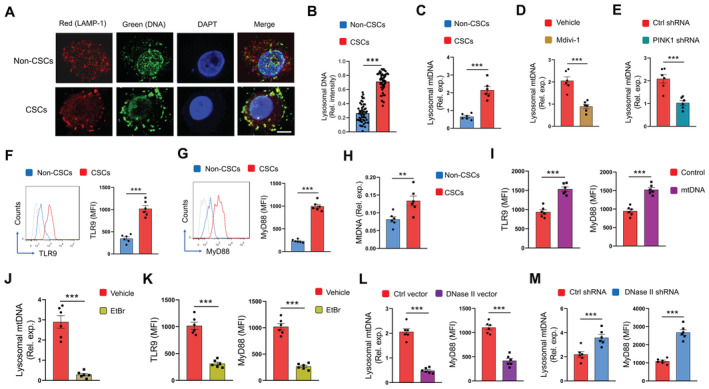
To understand the functional consequences of hypermitophagy in NSCLC CSCs, we analyzed the level of mitochondrial DNA (mtDNA) in the lysosomal compartment, as mitochondria are an organelle with their genome. Hence, we analyzed whether mtDNA localizes to lysosomes of NSCLC CSCs. Specifically, we conditioned experiments with an equal number of CSCs and non‐CSC cells, and normalized expressions of mitochondrial gene COX1 to nucleic gene ACTB to indicate the load of mtDNA. As expected, hypermitophagy resulted in an increased load of DNA in lysosomal fractions of CSCs (Fig 2A and B). Of note, mtDNA but not nuclear DNA in lysosomal fractions were elevated in CSCs (Figs 2C and EV5A). Such results regard an increased accumulation of mtDNA in lysosomes of NSCLC CSCs, which was confirmed with gel electrophoresis (Fig EV5B). The mtDNA in lysosomal fractions from CSCs was highly oxidized and roughly twofolds higher than that from non‐CSC cells (Figs 2C and EV5C). Such an accumulated lysosomal mtDNA could be abolished by mitophagy inhibition (Fig 2D and E). Furthermore, lysosomal mtDNA in CSCs was elevated in patients treated with chemotherapy (Fig EV5D).
Figure 2. Mitophagyhigh increases lysosomal mtDNA and TLR9 activation in CSCs.
-
A, BLysosomal DNA was identified with anti‐LAMP1 and anti‐DNA antibodies in non‐CSCs and CSCs. Scale bar 5 μm. Representative and mean ± SEM with 50 cells from five patients.
-
CLysosomal content of mtDNA in CSCs and non‐CSCs was determined with qPCR. Mean ± SEM from six patients.
-
DCSCs were treated with Mdivi‐1 (50 μM) and analyzed for lysosomal mtDNA. Mean ± SEM from six patients.
-
ECSCs with or without transfection of PINK1 shRNA were analyzed for lysosomal mtDNA. Mean ± SEM from six patients.
-
F, GProtein expressions of TLR9 and MyD88 in CSCs and non‐CSCs. Representative and mean ± SEM from six patients.
-
HTLR9 proteins were immunoprecipitated from CSCs and non‐CSCs and analyzed for the binding load of mtDNA. Mean ± SEM from six patients.
-
ICSCs were transfected with mtDNA and analyzed for expressions of TLR9 plus MyD88. Mean ± SEM from six patients.
-
J, KCSCs treated with EtBr (50 ng/ml) were analyzed for lysosomal mtDNA, TLR9, and MyD88. Mean ± SEM from six patients.
-
LCSCs transfected with DNase II expression vector or the control were analyzed for lysosomal DNA plus MyD88 protein. Mean ± SEM from six patients.
-
MCSCs transfected with DNase II shRNA or the control were analyzed for lysosomal DNA plus MyD88 protein. Mean ± SEM from six patients.
Data information: Paired t‐test with Bonferroni method, **P < 0.01, ***P < 0.001.
Source data are available online for this figure.
Figure EV5. Lysosomal mtDNA in CSCs.
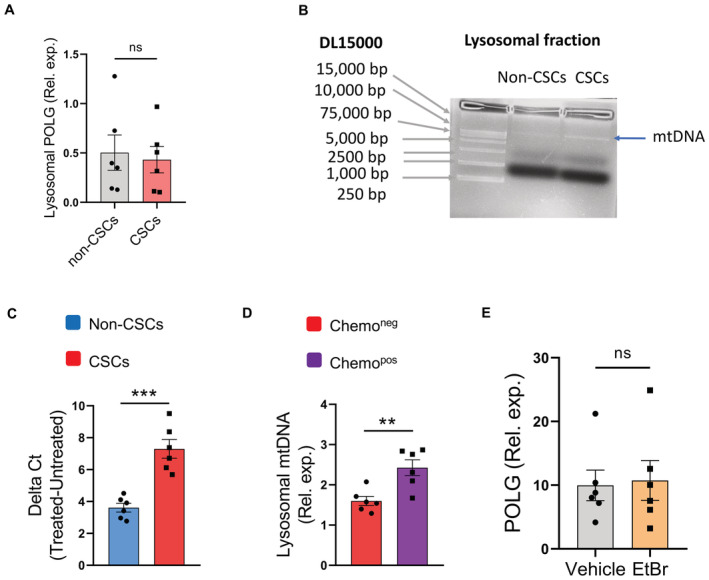
- Nuclear DNA (POLG gene) levels in lysosomal fractions from Non‐CSCs and CSCs.
- Lysosomal fractions were isolated from CSCs and non‐CSCs, and used for DNA purifications. Gel electrophoresis identified higher lysosomal DNA levels in CSCs.
- Oxidation of mtDNA was determined with 8‐OHdG in CSCs and non‐CSCs. Data from six patients.
- Lysosomal DNA content in CSCs was increased in NSCLC patients with chemotherapy. Data from six patients.
- EtBr treatment did not significantly affect nuclear DNA gene POLG expressions in CSCs. Data from six patients.
Data information: Mean ± SEM with t‐test, **P < 0.01, ***P < 0.001.
To evaluate the functional consequences of increased lysosomal mtDNA, we determined the DNA‐sensing pathway in NSLCLC CSCs. Specifically, Toll‐like receptor 9 (TLR9) is a classical unmethylated DNA sensor in the organelle lysosome (Kagan, 2012), while mtDNA is structurally similar to bacterial DNA and shares unmethylated CpG motifs (Goulopoulou et al, 2012). In line with the increased lysosomal mtDNA, we found higher expressions of TLR9 and MyD88 proteins in NSCLC CSCs (Fig 2F and G). Furthermore, chromatin immunoprecipitated TLR9 protein from CSCs bound to a higher load of mtDNA (Fig 2H), demonstrating mtDNA‐induced TLR9 activation in CSCs. In support, transfection of CSCs with mtDNA efficiently induced TLR9 expression and activation (Fig 2I).
To confirm the lysosomal mtDNA‐induced TLR9 activation in CSCs, we depleted mtDNA in CSCs by chronic treatment with ethidium bromide (EtBr) (Rodriguez‐Nuevo et al, 2018), resulting in a minimum level of mtDNA but not nuclear DNA, accompanied by decreased TLR9 expression and activation in CSCs (Figs 2J and K, and EV5E). These data identify mtDNA as the crucial endogenous ligand to drive TLR9 signaling in CSCs. The expression of DNase II, a mammalian lysosome‐specific endonuclease (Bao et al, 2016), was generally comparable in CSCs and non‐CSCs (Appendix Fig S3A), leaving an impaired clearance of lysosomal mtDNA unlikely in NSCLC CSCs. Overexpression of DNase II in CSCs reduced lysosomal mtDNA and inhibited TLR9 signaling (Fig 2L; Appendix Fig S3B). Vice versa, the knockdown of DNase II increased lysosomal mtDNA and inhibited TLR9 signaling in NSCLC CSCs (Fig 2M; Appendix Fig S3C).
To analyze the in vivo relevance of mtDNA with TLR9 signaling, lysosomal mtDNA was analyzed for association with TLR9 expression in NSCLC cells from patients treated with chemotherapy. Lysosomal mtDNA was positively correlated with TLR9 expression in NSCLC patients (Appendix Fig S3D). Together, hypermitophagy leads to increased lysosomal mtDNA, acting as an endogenous ligand for TLR9 activation in NSCLC CSCs.
Lysosomal mtDNA‐dependent TLR9 signaling promotes CSC expansion
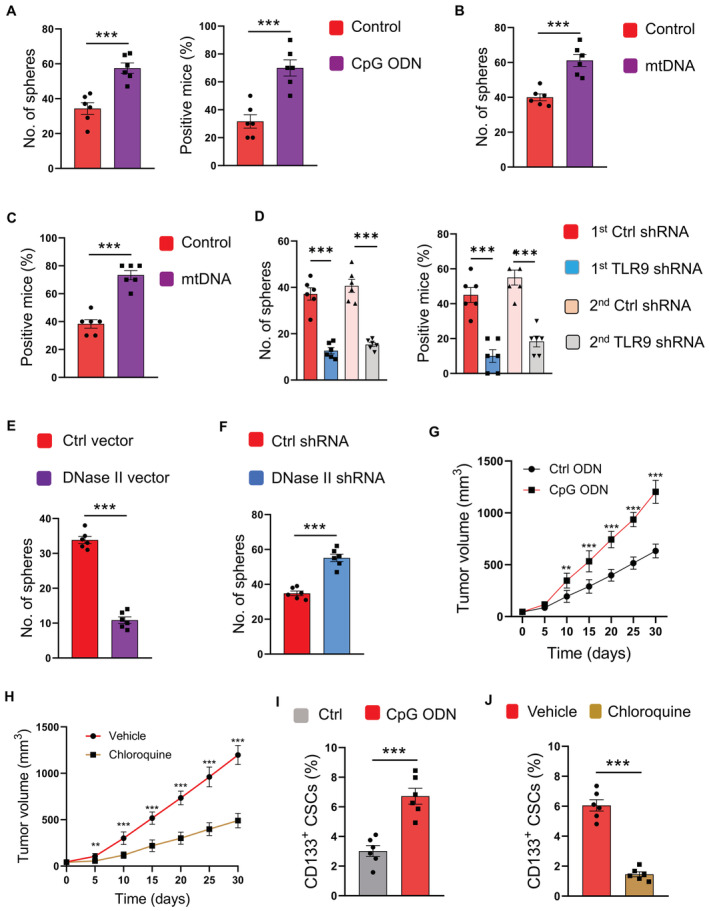
To analyze the function of TLR9 in the expansion of NSCLC CSCs, such CSCs were stimulated with CpG ODN and analyzed for sphere formation and tumor initiation. TLR9 activation promoted the proliferation of CSCs (Fig 3A), as sphere formation and tumor initiation were dramatically enhanced by CpG. Furthermore, transfection of NSCLC CSCs with mtDNA significantly promoted sphere formation and tumor initiation (Fig 3B and C). By contrast, genetic knockdown of TLR9 expression inhibited CSC expansion (Fig 3D; Appendix Fig S4).
Figure 3. Lysosomal mtDNA‐dependent TLR9 promotes CSC expansion.
-
ACSCs were stimulated with CpG ODN (10 μg/ml) or control and analyzed for sphere formation and tumorgenicity. Mean ± SEM from six experiments.
-
B, CCSCs transfected with mtDNA were analyzed for sphere formation and tumorgenicity. Mean ± SEM from six experiments.
-
DCSCs were transfected with two different TLR9 shRNAs or the control, and analyzed for sphere formation and tumorgenicity. Mean ± SEM from six experiments.
-
E, FCSCs transfected with DNase II expression vector, DNase II shRNA, or the control was analyzed for sphere formation. Mean ± SEM from six patients.
-
GCpG promoted tumor growth of PDX chimeras. Mean ± SEM from six mice.
-
HTLR9 inhibitor chloroquine abrogated the effect of CpG on tumor growth in PDX chimeras. Mean ± SEM from six mice.
-
ICpG treatment increased the frequency of CD133‐expressing CSCs in PDX chimeras. Mean ± SEM from six mice.
-
JChloroquine impeded the function of CpG in elevating CD133‐expressing CSCs of PDX chimeras. Mean ± SEM from six mice.
Data information: Paired t‐test with Bonferroni method, **P < 0.01, ***P < 0.001.
Source data are available online for this figure.
In line with TLR9‐induced CSC expansion, DNase II overexpression in CSCs, a process that decreased lysosomal mtDNA and TLR9 activation, inhibited CSC expansion (Fig 3E). Vice versa, DNase II knockdown, which increased lysosomal mtDNA content and TLR9 activation, promoted the expansion of NSCLC CSCs (Fig 3F).
To determine the in vivo activity of TLR9 in CSC expansion, NSCLC PDX models were injected with TLR9 agonists and analyzed for tumor growth. Such tumor growth could be enhanced by TLR9 activation, a process that could be impaired by TLR9 inhibition with Chloroquine (Fig 3G and H). Furthermore, TLR9 activation significantly increased the frequency of CSCs in xenografts, which could also be abrogated by TLR9 inhibition (Fig 3I and J). In essence, TLR9 is critical for populating the NSCLC CSC pool, accounting for hypermitophagy‐induced CSC expansion in human NSCLC.
Lysosomal DNA‐dependent TLR9 poeomotes CSC expansion via Notch1 activation
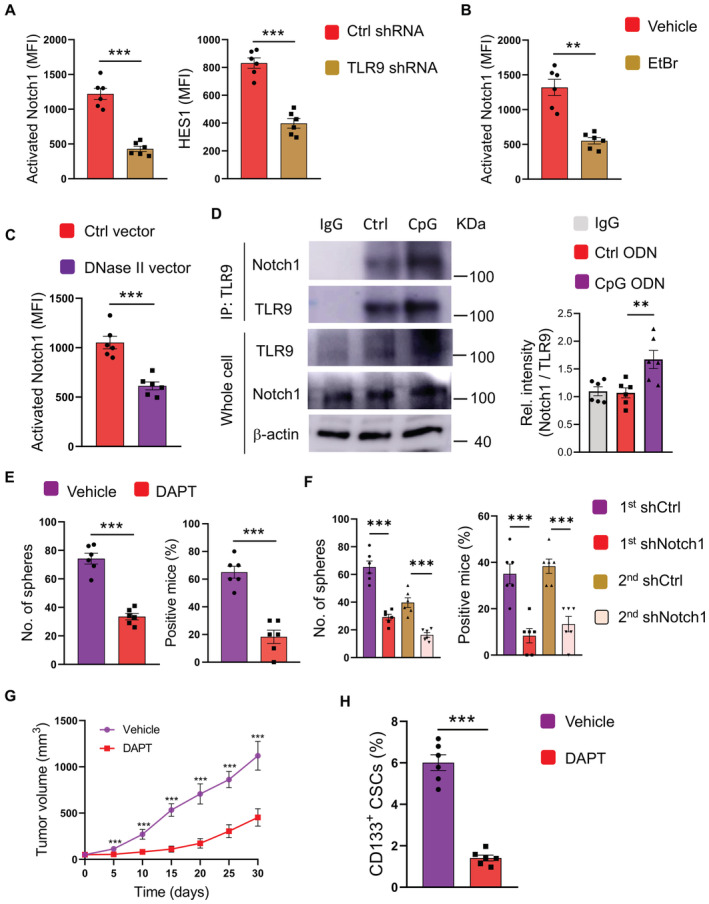
Given the Notch1high and TLR9high in response to hypermitophagy, we analyzed whether TLR9 could function via Notch1 for NSCLC CSC expansion. Knockdown of TLR9 dramatically reduced expressions of activated Notch1 and HES1 proteins in CSCs (Fig 4A). In consistent, both mtDNA depletion and overexpression of DNase II could inhibit Notch1 activity in NSCLC CSCs (Fig 4B and C), assigning lysosomal DNA‐dependent TLR9 as an intrinsic signal for Notch1high in CSCs. Physically, immunoprecipitated TLR9 could interact with activated Notch1 in CSCs (Fig 4D). CpG ODN not only induced TLR9 expression but also resulted in robust Notch1 expression in CSCs. The interaction of TLR9 with Notch1 in CSCs was essentially promoted by TLR9 activation.
Figure 4. TLR9 promotes CSC expansion through Notch1 hyperactivity.
-
ACSCs transfected with TLR9 shRNA or control were analyzed for protein expressions of activated Notch1 plus HES1. Mean ± SEM from six patients.
-
BCSCs treated with or without EtBr (50 ng/ml) were analyzed for activated Notch1. Mean ± SEM from six patients.
-
CCSCs transfected with DNase II expression vector or control were analyzed for activated Notch1 expression. Mean ± SEM from six patients.
-
DCSCs with or without CpG treatment were analyzed for interaction between TLR9 and Notch1. Representative and mean ± SEM from six patients.
-
ECSCs were treated with CpG ODN (10 μg/ml) in the presence or absence of DAPT (10 μM), and analyzed for sphere formation plus tumorgenicity. Mean ± SEM from six experiments.
-
FCSCs were transfected with two different Notch1 shRNAs or control, treated with CpG ODN (10 μg/ml), and analyzed for sphere formation plus tumorgenicity. Mean ± SEM from six experiments.
-
G, HPDX chimeras treated by CpG with or without DAPT were analyzed for tumor growth and CD133‐expressing CSCs. Mean ± SEM from six mice.
Data information: Paired t‐test with Bonferroni method, **P < 0.01, ***P < 0.001.
Source data are available online for this figure.
To determine the effect of Notch1 activation on TLR9‐induced expansion of CSCs, NSCLC CSCs were activated with TLR9 agonists in the presence or absence of Notch1 inhibitor DAPT. Blockade of the Notch1 pathway impaired the expansion of CSCs enhanced by TLR9 signaling (Fig 4E). The sphere formation and tumor initiation capacities were blocked by DAPT. Furthermore, knockdown of Notch1 by two different shRNAs was both efficient in reducing Notch1 expressions in CSCs, respectively (Appendix Fig S5A and B), which significantly abrogated the CSC expansion as evidenced by sphere formation and tumor initiation (Fig 4F), confirming the critical function of Notch1 activity in NSCLC CSCs.
To evaluate the function of Notch1 activity in TLR9‐induced CSC expansion in vivo, NSCLC PDX models were treated with stimulatory CpG ODN in the presence or absence of DAPT. DAPT abrogated the TLR9‐enhanced tumor growth (Fig 4G) and inhibited TLR9‐induced CSC expansion in such chimeras (Fig 4H). Essentially, lysosomal mtDNA‐dependent TLR9 drives Notch1 activation, leading to CSC expansion.
TLR9‐Notch1 pathway promotes mitochondrial metabolism for CSC expansion
Compared with non‐CSC cells, NSCLC CSCs displayed elevated basal oxygen consumption rates (OCR), maximal respiratory capacity, reserve respiratory capacity, and higher mitochondrial membrane potential (Fig 5A; Appendix Fig S6A), assigning robust mitochondrial oxidative phosphorylation as a signature. Blocking glucose metabolism using glucose analog 2‐DG and inhibition of the TCA cycle using succinate dehydrogenase inhibitor malonate essentially reduced the expansion of NSCLC CSCs (Fig 5B), implicating mitochondrial oxidative phosphorylation in expanding CSCs.
Figure 5. Lysosomal mtDNA‐TLR9‐Notch1 maintains mitochondrial metabolism for CSC expansion.
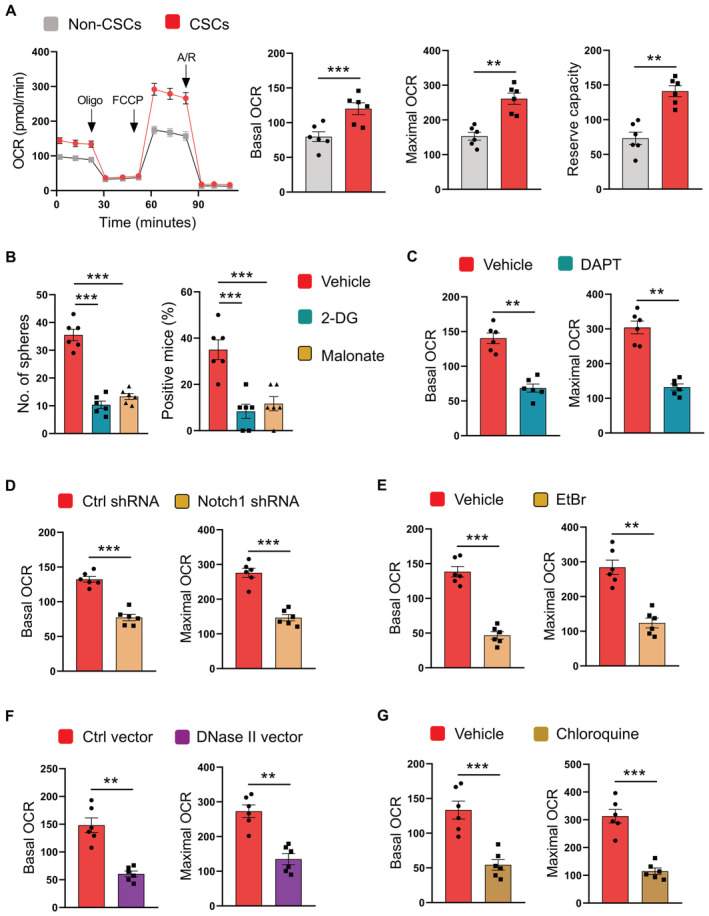
- CSCs and non‐CSCs were analyzed for mitochondrial metabolism using seahorse assay. Mean ± SEM from six patients.
- CSCs were treated with 2‐DG (10 mM) or Malonate (10 mM), and assayed for sphere formation plus tumorgenicity. Mean ± SEM from six patients.
- CSCs treated with DAPT (10 μM) were analyzed for mitochondrial OCR. Mean ± SEM from six patients.
- CSCs transfected with Notch1 shRNA or control shRNA were analyzed for mitochondrial OCR. Mean ± SEM from six patients.
- CSCs treated with EtBr (50 ng/ml) were analyzed for mitochondrial OCR. Mean ± SEM from six patients.
- CSCs transfected with DNase II expression vector or control were analyzed for mitochondrial OCR. Mean ± SEM from six patients.
- CSCs treated with chloroquine (50 μM) were analyzed for mitochondrial OCR. Mean ± SEM from six patients.
Data information: Paired t‐test with Bonferroni method (A, C–G) and ANOVA test with Turkey's method (B). **P < 0.01, ***P < 0.001.
Source data are available online for this figure.
To understand how TLR9‐dependent Notch1 was involved in maintaining CSCs, NSCLC CSCs were treated with DAPT and analyzed OCR. Inhibition of Notch1 fundamentally abrogated the respiratory capacity of CSCs (Fig 5C and D). In consistent, depletion of mtDNA, overexpression of DNase II, and blockade of TLR9 could significantly inhibit such mitochondrial metabolism in CSCs (Fig 5E–G). Thus, TLR9‐dependent Notch1 activation is required to promote mitochondrial metabolism in CSCs.
TLR9‐Notch1 signaling drives AMPK activation in CSCs
To explore the mechanisms underlying the critical function of the TLR9‐Notch1 pathway in promoting mitochondrial metabolism of NSCLC CSCs, CSCs were analyzed for the activation of energy sensor AMPK, a crucial regulator for mitochondrial metabolism (Herzig & Shaw, 2018). Stimulation with TLR9 agonists increased the phosphorylation of AMPKα (Thr‐172) in CSCs (Fig 6A). AMPKhigh was confirmed by increased levels of p‐ACC in NSCLC CSCs in response to CpG ODN (Appendix Fig S6B). In support, mitochondrial mass and DNA were increased in NSCLC CSCs (Appendix Fig S6C), aligning with AMPK hyperactivity. Furthermore, DAPT and Notch1 genetic knockdown abrogated AMPK phosphorylation in response to TLR9 activation in CSCs, regarding a Notch1‐dependent effect of TLR9 signaling on AMPK activation (Fig 6B and C). AMPK activator A769662 restored the mitochondria metabolism of CSCs under Notch1 inhibition by DAPT (Fig 6D), assigning AMPK as a downstream sensor of Notch1 signaling.
Figure 6. TLR9‐Notch1 drives AMPKhigh to promote mitochondrial metabolism in CSCs.
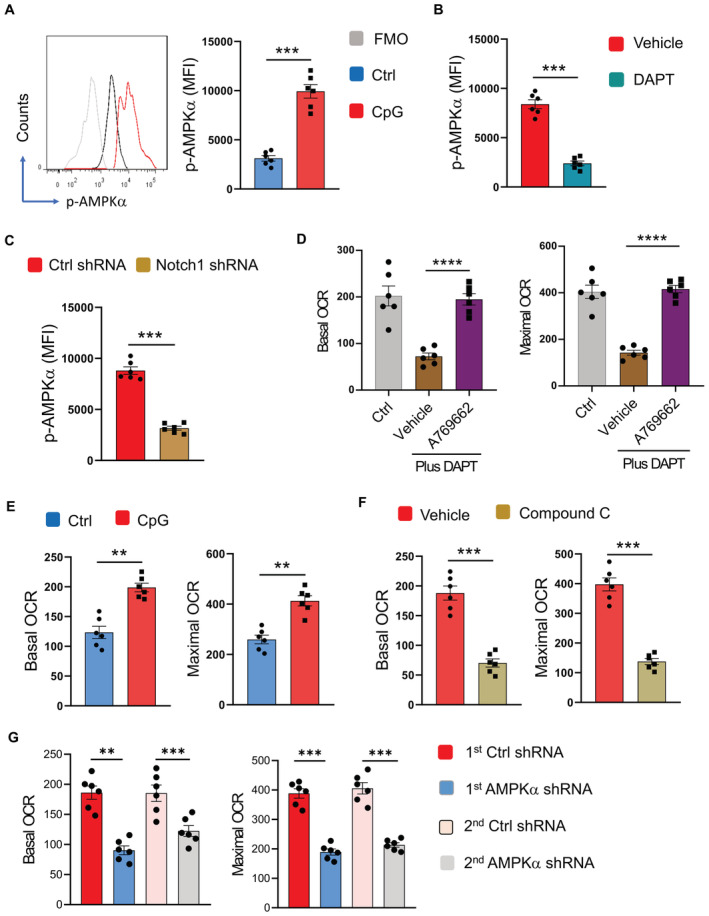
- CSCs stimulated with or without CpG ODN (10 μg/ml) were analyzed for expression of phosphor‐AMPKα. Representative and mean ± SEM from six patients.
- CSCs were stimulated with CpG ODN (10 μg/ml) in the presence or absence of DAPT (10 μM), and analyzed for phosphor‐AMPKα. Mean ± SEM from six patients.
- CSCs transfected with Notch1 shRNA or control were stimulated with CpG ODN (10 μg/ml) and analyzed for phosphor‐AMPKα. Mean ± SEM from six patients.
- CSCs were treated with DAPT (10 μM) in the presence or absence of A769662 (10 μM), and analyzed for mitochondrial OCR. Ctrl represents CSCs without any treatment. Mean ± SEM from six patients.
- CSCs were stimulated with or without CpG ODN (10 μg/ml) and analyzed for mitochondrial OCR. Mean ± SEM from six patients.
- CSCs were stimulated with CpG ODN (10 μg/ml) in the presence or absence of Compound C (10 μM) and analyzed for mitochondrial OCR. Mean ± SEM from six patients.
- CSCs were transfected with two different AMPKα shRNA or the control, stimulated with CpG ODN (10 μg/ml), and analyzed for mitochondrial OCR. Mean ± SEM from six patients.
Data information: Paired t‐test with Bonferroni method and ANOVA with Turkey's method (D), **P < 0.01, ***P < 0.001, ****P < 0.0001.
Source data are available online for this figure.
To analyze AMPK activity in CSC mitochondria metabolism, CSCs were stimulated with TLR9 agonists in the presence or absence of the AMPK inhibitor Compound C. TLR9 activation enhanced the mitochondrial metabolism of CSCs, exerting increased basal OCR and maximal OCR (Fig 6E), which could be blocked by inhibition of AMPK using Compound C (Fig 6F). Genetic knockdown of AMPKα with two different shRNAs, which efficiently reduced the expressions of AMPKα (Appendix Fig S7A and B), abolished the effect of TLR9 signaling on mitochondria metabolism in CSCs (Fig 6G), pinpointing AMPK as essential for the TLR9‐Notch1 pathway to drive CSC mitochondrial metabolism.
The crucial function of AMPK in CSC expansion was evaluated by analyzing their sphere formation and tumor initiation capacity under AMPK manipulation. Activation of AMPK by A769662 promoted sphere formation and tumor initiation of NSCLC CSCs, while blockade of AMPK by Compound C inhibited such cell expansion (Appendix Fig S8A and B). Furthermore, A769662 enhanced the tumor growth in PDX models, accompanied by an elevated frequency of CSC cells in xenografts (Appendix Fig S8C). Vice versa, Compound C inhibited tumor growth and reduced CSC frequency in such PDX models (Appendix Fig S8D). Together, these findings regard TLR9‐Notch1‐AMPK activation as the master signaling for CSC expansion of NSCLC. However, we did not observe significant changes in the cell survival status in response to TLR9 activation, Notch1 ICD transfection, and AMPK activation (Appendix Fig S9), indicating that the TLR9‐Notch‐AMPK pathway drives CSC expansion while avoiding extraordinary cell death.
Notch1 induces metabolic stress and LKB1 phosphorylation for lysosomal AMPK activation in CSCs
AMPK is phosphorylated by kinase LKB1 on the organelle lysosome in response to an increased AMP/ATP ratio (Zhang et al, 2014a; Wen et al, 2019). Transfection of CSCs with Notch1 intracellular domain (ICD) resulted in increased AMP/ATP ratios, while treatment with DAPT reduced AMP/ATP ratios (Fig 7A and B), indicating induction of metabolic stress by Notch1 activity despite the enhanced mitochondrial metabolism (Kishton et al, 2016). Furthermore, Notch1 ICD transfection promoted the phosphorylation of LKB1, which is critical for AMPK activation (Gan & Li, 2014), in CSCs (Fig 7A), while DAPT abrogated the phosphorylation of LKB1 (Fig 7B), aligning with the interaction between Notch1 intracellular subunit with LKB1 (Yang et al, 2016). Notably, activated Notch1 could physically interact with AMPK (Fig 7C), inducing metabolic stress and LKB1 phosphorylation for AMPK activation in CSCs.
Figure 7. Notch1 induces metabolic stress and LKB1 phosphorylation for lysosomal AMPK activation in CSCs.
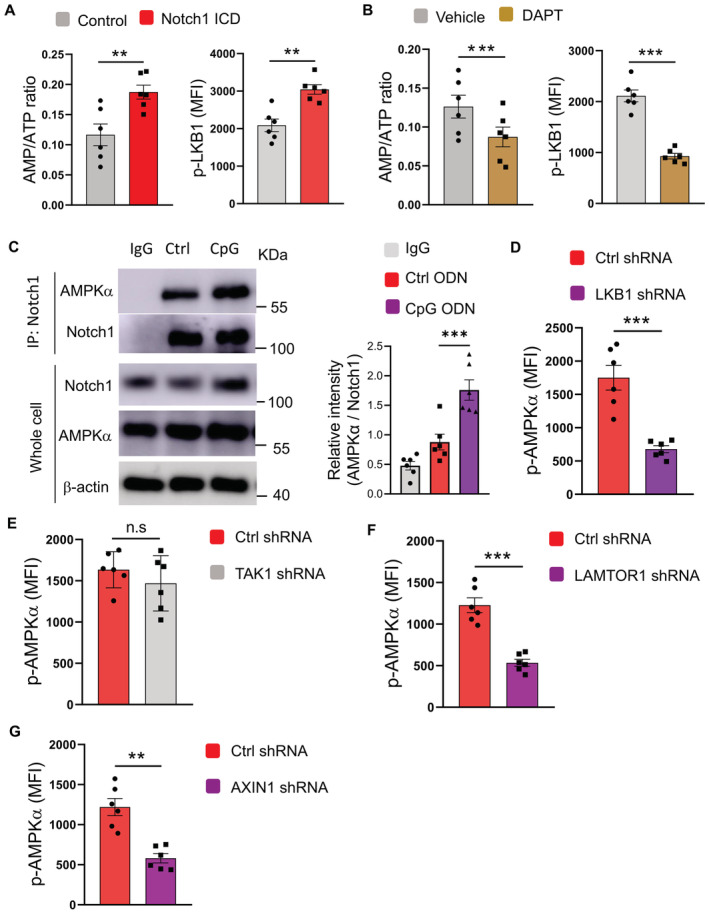
- CSCs transfected with or without Notch1 ICD were analyzed for AMP/ATP ratio plus LKB1 phosphorylation. Mean ± SEM from six patients.
- CSCs treated with or without DAPT (10 μM) were analyzed for AMP/ATP ratio plus LKB1 phosphorylation. Mean ± SEM from six patients.
- CSCs treated with or without CpG ODN (10 μg/ml) were analyzed for interactions between Notch1 and AMPK. Representative and mean ± SEM from six patients.
- CSCs transfected with LKB1 shRNA(right) or the control (left) were treated with CpG ODN (10 μg/ml) and analyzed for AMPK phosphorylation. Mean ± SEM from six patients.
- CSCs transfected with TAK1 shRNA or the control were treated with CpG ODN (10 μg/ml) and analyzed for AMPK phosphorylation. Mean ± SEM from six patients.
- CSCs transfected with LAMTOR1 shRNA or the control were treated with CpG ODN (10 μg/ml) and analyzed for AMPK phosphorylation. Mean ± SEM from six patients.
- CSCs transfected with AXIN1 shRNA or the control were treated with CpG ODN (10 μg/ml) and analyzed for AMPK phosphorylation. Mean ± SEM from six patients.
Data information: Paired t‐test with Bonferroni method, **P < 0.01, ***P < 0.001.
Source data are available online for this figure.
AMPK phosphorylation in response to TLR9‐Notch1 signaling was selectively mediated by LKB1 in NSCLC CSCs. We did not observe significant changes with the TAK1 phosphorylation in response to Notch1 ICD transfection or TLR9 activation in such CSCs (Appendix Fig S10A). In support, genetic knockdown of LKB1 abrogated the AMPK activation by TLR9 signaling, while TAK1 knockdown exerted no significant effect (Fig 7D and E; Appendix Fig S10B and C), pinpointing LKB1‐dependent AMPK phosphorylation in response to TLR9‐Notch1 signaling.
Under glucose starvation, the v‐ATPase‐Regulator complex is accessible to AXIN/LKB1 for AMPK phosphorylation at lysosome (Zhang et al, 2014a). Accordingly, genetic knockdown of LAMTOR1 and AXIN1 abrogated AMPK activation by TLR9 signaling in CSCs (Fig 7F and G; Appendix Fig S10D and E), assigning lysosome‐ and AXIN‐dependent manner for AMPK phosphorylation by LKB1 upon TLR9‐Notch signaling. Collectively, lysosomal mtDNA‐dependent TLR9 signaling in NSCLC CSCs induces Notch1 activation, resulting in metabolic stress and activation of LKB1 for lysosomal AMPK phosphorylation, which in turn enhances mitochondria metabolism to fuel CSC expansion.
Blocking mitophagyhigh and TLR9‐Notch‐AMPK signaling restricts the CSC population in chemotherapy‐treated PDX chimeras
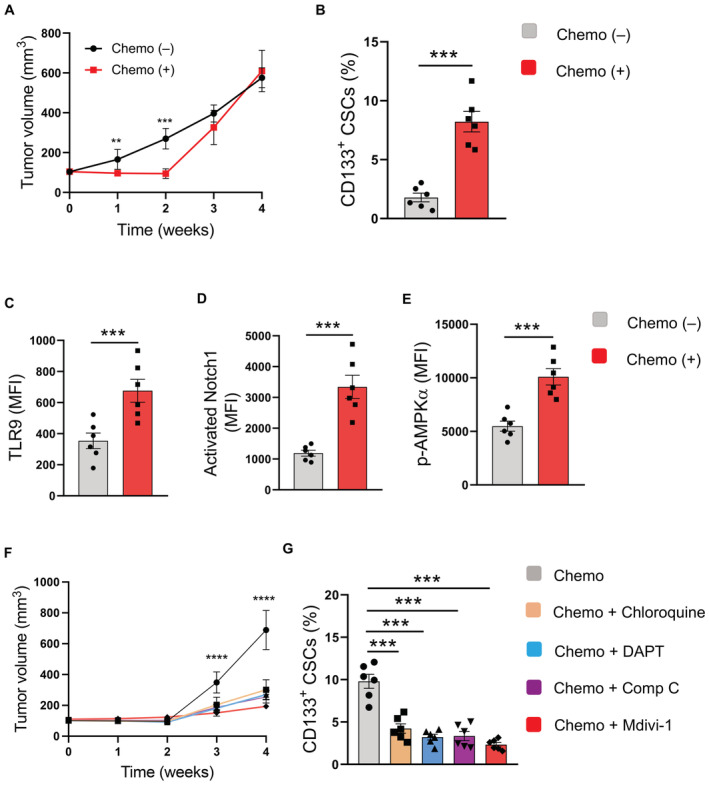
To evaluate the potential therapeutic application of targeting hypermitophagy with the TLR9‐Notch‐AMPK pathway in restricting the NSCLC CSC population under chemotherapy, NSCLC PDX models were randomly assigned into two groups when the tumor size reached around 100 mm3. While one group of mice was treated with chemotherapy, another group without chemotherapy was used as a control. The chemotherapy was terminated after 2 weeks, followed by the analysis of tumor growth and the frequency of CSCs. While chemotherapy inhibited the outgrowth of NSCLC xenografts for two weeks during treatment, tumor growth capacity was enhanced after chemotherapy (Fig 8A). Compared with control tumors, the frequency of CSCs increased at least fourfolds in the chemo‐tumors (Fig 8B). Protein expressions of TLR9, activated Notch1, and p‐AMPKα in cancer cells from chemo‐tumors were higher than that from control tumors (Fig 8C–E), implicating TLR9‐Notch1‐AMPK activation in driving CSC expansion and tumor growth capacity of NSCLC treated with chemotherapy.
Figure 8. Targeting mitophagy and the TLR9‐Notch1‐AMPK pathway restricts CSC expansion in a NSCLC PDX model.
-
ANSCLC PDX models treated with or without chemotherapy for the first 2 weeks were analyzed for tumor growth at the indicated time. Mean ± SEM from six experiments.
-
BFrequencies of CD133‐expressing CSCs from NSCLC xenografts treated with or without chemotherapy were determined after 4 weeks. Mean ± SEM from six experiments.
-
C–EFlow cytometric analyses of protein expressions of TLR9, activated Notch1, and phosphor‐AMPKα in cancer cells from NSCLC xenografts treated with or without chemotherapy after 4 weeks. Mean ± SEM from six experiments.
-
FNSCLC PDX models were treated with chemotherapy alone or together with the indicated inhibitors, respectively, for the first 2 weeks. Tumor volume was determined at the indicated time. Mean ± SEM from six experiments.
-
GFrequencies of CD133‐expressing CSCs from NSCLC xenografts treated with chemotherapy alone or with the indicated inhibitors after 4 weeks. Mean ± SEM from six experiments.
Data information: Paired t‐test with Bonferroni (A–E) and ANOVA test with Turkey's (F, G) method. **P < 0.01, ***P < 0.001, ****P < 0.0001.
Source data are available online for this figure.
We tested therapeutic interventions with four small molecules, specifically mitophagy inhibitor Mdivi‐1, TLR9 inhibitor Chloroquine, Notch1 inhibitor DAPT, and AMPK inhibitor Compound C, for improving chemotherapy. Such pharmaceutical molecules significantly inhibited the growth capacity of NSCLC xenografts after chemotherapy (Fig 8F). The frequency of CSCs in chemo‐tumors was substantially lower in chimeras using the combined therapy (Fig 8G). In summary, targeting mitophagyhigh with the TLR9‐Notch‐AMPK pathway is efficient in reducing the CSC pool and inhibiting tumor outgrowth for NSCLC treated with chemotherapy.
Discussion
Cancer stem‐like cells are crucial in inducing chemoresistance and tumor recurrence, serving as the major obstacle in the clinical management of cancer patients (Phi et al, 2018). In this study, we identify mitophagyhigh as a feature for NSCLC CSCs. Critically, mitophagyhigh drives lysosomal mtDNA‐dependent TLR9 activation via the Notch1‐AMPK pathway for expanding CSCs in NSCLC patients. Specifically, in patients, especially those treated with chemotherapy, mitophagyhigh results in an aberrant load of mitochondrial DNA in the organelle lysosome, leading to activation and overexpression of TLR9 in CSC cells. Such TLR9 interacts with Notch1 and leads to Notch1 activation, promoting AMPK phosphorylation by LKB1 and thus enhancing mitochondria metabolism for CSC expansion. In PDX chimeras, mitophagyhigh with TLR9‐dependent Notch1‐AMPK pathway is therapeutically targetable, controlling the CSC population.
Innate immune sensing in cancer cells has long been an active area of investigation and has been implicated in tumor progression (Moynihan & Irvine, 2017). Specifically, functional expression of TLR9 in NSCLC cells attributes to cancer metastasis in clinical patients (Ren et al, 2007). Activating TLR9 in NSCLC cells efficiently promotes NSCLC outgrowth and metastasis in vitro and in vivo by regulating multiple nonredundant pathways (Ren et al, 2009). Pulmonary infection with gram‐negative bacteria facilitates tumor progression through TLR4‐dependent pathways in NSCLC patients (Zhang et al, 2016). Our previous studies pinpoint a vital role of TLR4 and TLR9 signaling in cancer outgrowth and metastasis, as well as in chemo‐induced metastasis, in NSCLC patients (Ren et al, 2007, 2009; Wang et al, 2018), indicating a potential effect of innate immune sensing on CSC expansion. As such, TLR9 is critical for the maintenance of glioma CSC (Herrmann et al, 2014). Herein, we identify TLR9 as an active and crucial sensor in expanding CSCs in NSCLC patients. Of interest, our findings pinpoint mitophagyhigh results in increased lysosomal mtDNA as the endogenous ligand for TLR9 signaling in NSCLC CSCs. Thus, mitochondrial hemostasis is closely related to innate immune sensing and tumor progression in human NSCLC.
Notch1 is a highly conversed pathway wildly involved in autoimmunity and cancer (Aster et al, 2017). As such, Notch1 signaling connects endothelial cells and T cells in the adventitia of arteries in patients with large vasal vasculitis (Wen et al, 2017). T‐cell acute lymphoblastic leukemia is an aggressive malignancy characterized by Notch1 pathway mutations (Kishton et al, 2016). Although accumulating studies have assigned a critical function of Notch1 activity in maintaining the stemness of CSCs (Takebe et al, 2015; Matsui, 2016), mechanisms underlying aberrant Notch1 activation are obscure. Here, we unravel lysosomal DNA‐dependent TLR9 activation as a cellular‐intrinsic mechanism for Notch1 hyperactivity in CSCs. Accumulating mtDNA in lysosomes leads to TLR9 activation in CSCs of NSCLC patients, which interacts with Notch1 and results in elevated Notch1 activity. Such findings regard mtDNA as the driver in shaping the TLR9‐Notch‐enriched niche in NSCLC patients, favoring the maintenance and expansion of the CSC population. In support, mtDNA functions as the danger‐associated molecular pattern, increasing TLR9/NF‐κB expression and inducing inflammation in the lung tissue (Zhang et al, 2014b). Mitochondrial alterations and stress lead to mitochondrial DNA‐triggered TLR9 activation and drive muscle inflammation (Rodriguez‐Nuevo et al, 2018). In addition, Notch1 activation by TLR9 might be selectively critical for NSCLC CSCs, as glioblastoma CSCs are deficient in TLR4 and thus unable to sense danger signals for survival maintenance (Alvarado et al, 2017).
AMPK is a master guardian of metabolism and mitochondrial homeostasis (Herzig & Shaw, 2018). AMPK translocates to form the v‐ATPase‐Regulator‐AXIN/LKB1‐AMPK complex at the lysosome, where its α‐subunit was phosphorylated by LKB1 (Zhang et al, 2014a). AMPK is inactivated unless AMPKα is phosphorylated at Thr172, which relies on the localization to the lysosome (Zhang et al, 2014a; Lin & Hardie, 2018). Lysosomal localization of AMPK depends on competent myristoylation of the AMPK β‐subunit (Ali et al, 2016). Deficient myristoylation of AMPKβ results in AMPK inactivation and autoimmune inflammatory disease (Wen et al, 2019). AMPK functions by phosphorylating metabolic enzymes and nutrient transporters, increasing the activity or expression of proteins involved in catabolism while conserving ATP by switching off biosynthetic pathways (Garcia & Shaw, 2017). Herein, we uncover Notch1‐induced AMPKhigh and mitochondria metabolism as essential for CSC expansion in NSCLC patients. Notch1 induces metabolic stress, LKB1 phosphorylation, and interacts with AMPK protein for AMPK phosphorylation at the lysosome in CSCs. Such findings shed new light on insights into how Notch1 signaling functions in maintaining the stemness of CSCs and provide novel therapeutic strategies. Similarly, TLR9 activation induces AMPK activation in vascular smooth muscle cells, participating in vascular dysfunction (McCarthy et al, 2018). Notch1‐driven AMPK activation is crucial to balance glycolysis and mitochondrial metabolism in T‐cell acute lymphoblastic leukemia (Kishton et al, 2016). Notch1 promotes mitochondrial glucose oxidation, increasing pyruvate dehydrogenase phosphatase 1 expression, pyruvate dehydrogenase activity, and glucose flux to the TCA cycle, activating proinflammatory macrophages (Xu et al, 2015). Furthermore, due to hypermitophagy and Notch1‐AMPK hyperactivity, CSCs exert higher mitochondrial oxidative phosphorylation, and blockade of glucose oxidative metabolism abrogates the CSC expansion. AMPK directly regulates mitochondrial dynamics by promoting mitochondrial biogenesis, fission, and mitophagy (Herzig & Shaw, 2018). Accordingly, mitochondrial mass and mitochondrial DNA are increased in NSCLC CSCs. Together, AMPKhigh and mitophagyhigh form a positive feedback loop that instructs efficient dynamics of mitochondrial biogenesis and degradation, optimizing mitochondrial quality and driving mitochondrial metabolism for CSC expansion in human NSCLC.
In summary, hypermitophagy is a feature of CSCs in human NSCLC. As a result, lysosomal mtDNA functions as the critical driver for TLR9 activation and subsequent Notch1 hyperactivity, amplifying AMPK phosphorylation as the master sensor for mitochondrial metabolism in expanding CSCs. While NSCLC patients treated with chemotherapy have an expanding pool of CSCs, disrupting mitophagyhigh and the TLR9‐dependent Notch1‐AMPK pathway is sufficient to abolish unwanted effects in PDX chimeras. These findings provide novel mechanistic insights into CSC expansion and uncover molecular cascades for AMPK activity and function in human NSCLC, identifying promising therapeutic targets to improve clinical chemotherapy.
Materials and Methods
Patients
Patients with the diagnosis of NSCLC adenocarcinoma were recruited, while those with other uncontrolled medical diseases or inflammatory diseases were excluded. Patients’ characteristics, including gender, age, and TNM stages, were summarized in Appendix Table S1. Appropriate informed consent was obtained from every individual. Studies were approved by the Ethics Committee of Soochow University.
Patient‐derived organoid
Patient‐derived organoids (PDOs) were established and cultured as previously described (Jacob et al, 2020). Briefly, NSCLC tissues were minced with fine dissection scissors (Fine Science Tools) until paste‐like. After that, 5 ml RBC lysis buffer (Solarbio, R1010) was added to the minced tissue to lyse contaminating red blood cells. Then, minced tissues were resuspended with 4 ml per well of PDO medium (50% DMEM/F12; Corning, 10‐092‐cv), 50% Neurobasal (Thermo Fisher Scientific, 21103049), 1× GlutaMax (GBICO, 35050061), 1× NEAAs (Thermo Fisher Scientific, 11140050), 1× PenStrep (Beyotime, C0222), 1× N2 supplement (Thermo Fisher Scientific, 17502048), 1X B27 w/o vitamin A supplement (Thermo Fisher Scientific, 12587010), 1× 2‐mercaptoethanol (Thermo Fisher Scientific, 21985023), 2.5 mg/ml human insulin (Beyotime, P3376‐100IU), distributed in ultralow attachment six‐well culture plates (Corning), and placed on an orbital shaker rotating at 120 rpm within a 37°C, 5% CO2, 90% humidity sterile incubator. The fresh PDO medium was changed approximately twice a week. Such PDOs were assessed via immunostainings of PanCK (Abcam, ab7753), CD31 (Abcam, 281583), and histological analyses.
Cell enrichments
Primary cancer cells were isolated from tumor tissues and/or PDOs using Cancer Cell Isolation kit (Panomics) (Wang et al, 2017, 2018). Tumor spheres were enriched with Corning® ultralow attachment plate using 3dGRO™ Spheroid Medium (Sigma) and used as CSCs, while adherent cells were used as non‐CSCs.
Reagents
The TLR9 inhibitor Chloroquine was purchased from Novus Biologicals. The Notch1 inhibitor DAPT, glucose analog 2‐DG, and the inhibitor of succinate dehydrogenase Malonate were from Sigma. The AMPK activator A769662 was from APExBIO. The AMPK inhibitor Compound C was from Abcam. Mitophagy inhibitor Mdivi‐1 was from Cayman. Human TLR9 shRNA (sc‐40270, TR301076), Notch1 shRNA (sc‐36095, TR302916), AMPKα shRNA (sc‐29673, TG320461), DNase II shRNA (sc‐41507), DNase II expression plasmid (RC209573), and the controls were from Santa Cruz Biotechnology and Origene. Human Notch1 intracellular domain plasmid (#130934) was from Addgene. Cancer stem‐like cell transfections were performed using the Lipofectamine Stem Transfection Reagent (Thermo Fisher). All reagents were used according to the manufacturers’ instructions.
Flow cytometry
Cell surface staining was performed with PE antihuman CD133 (BioLegend, Clone 7), Brilliant Violet 421™ antihuman TLR9 (BioLegend, Clone S16013D), FITC anti‐human ALDH1A1 (Sino Biological, Clone 03), and APC antihuman Notch1 (BioLegend, Clone MHN1‐519). For intracellular staining, cells were fixed with Fix Buffer I (BD Biosciences), permeabilized with Perm Buffer III (BD Biosciences), and stained with antiphospho‐AMPK alpha‐1,2 (Thr172) antibody (Thermo Fisher Scientific, 44‐1150G), anti‐AMPK alpha‐1 antibody (Thermo Fisher, PA5‐25938), anti‐activated Notch1 antibody (Abcam, ab8925), anti‐TAK1 antibody (Abcam, ab109526), antiphospho‐TAK1 antibody (Thermo Fisher Scientific, MA5‐15073), anti‐LKB1 antibody (Thermo Fisher Scientific, PA5‐14072), antiphospho‐LKB1 antibody (Abcam, ab63473), anti‐LAMTOR1 antibody (Thermo Fisher Scientific, PA5‐14072), anti‐AXIN1 antibody (Thermo Fisher Scientific, PA5‐21042), anti‐MyD88 antibody (Abcam, ab135693) plus Alexa Fluor® 488 anti‐rabbit IgG (Thermo Fisher Scientific, A‐11034) or Alexa Fluor® 647 antirabbit IgG (Thermo Fisher Scientific, A‐21245). Cells were stained for 45 min at 4°C. Flow cytometry was performed on an LSR II flow cytometer (BD Biosciences). Data were analyzed with the FlowJo software (Tree Star Inc.).
Real‐time PCR and ChIP‐PCR
qPCR was performed as previously described (Shen et al, 2017; Wen et al, 2017). Briefly, RNA was extracted using Trizol (Thermo Fisher Scientific) and Direct‐zol™ RNA MiniPrep Kit (ZYMO Research). cDNA was synthesized with Maxima First‐Strand cDNA Synthesis Kits for RT‐qPCR (Thermo Fisher Scientific). Quantitative PCR analyses were carried out using SYBR Green qPCR Master Mix (Bimake). Regarding the ChIP‐PCR assay for detecting protein‐bound mtDNA, NovoNGS CUT&Tag 2.0 High‐Sensitivity Kit (Novoprotein, N259‐YH01) was used according to the manufacturer's instructions. Primers were obtained from Sino Biological. Gene expression was normalized to 18S ribosomal RNA.
Immunoblotting and immunoprecipitation
Experimental conditions for immunoblotting and immunoprecipitation experiments have been previously published (Shen et al, 2017; Wen et al, 2019). Primary antibodies used were as follows: antihuman TLR9 (Abcam, ab37154, ab211012), antihuman Notch1 (Abcam, ab128076; Santa Cruz, sc‐373891), antihuman AMPKα (Abcam, ab187408), antihuman PINK1 (Abcam, ab216144), antihuman PARKIN (ABclonal, A0968), antihuman MFN2 (CST, 11925), antipan Cytokeratin (Abcam, ab7753), anti‐CD31 (Abcam, ab28364), antihuman VDAC1 (Abcam, ab154856), antihuman COX‐IV (Santa, sc‐376731), anti‐Ubiquitin (ABclonal, A19686), antihuman phospho‐PARKIN (CST, 62802), and antihuman LC3B (Abcam, ab192890). Expression of β‐actin was analyzed with antihuman β‐actin (Abcam, ab8227) served as the internal control.
Immunofluorescence
Immunofluorescence (IF) staining was performed as previously described (Shen et al, 2017; Wen et al, 2017, 2019). Cells were stained with antihuman LAMP1 (Abcam, ab25630; Proteintech, 21997‐1‐AP) and antihuman COX‐IV (Abcam, ab202554). The staining was visualized with Alexa Fluor 488® antimouse IgG (1:200, Abcam, ab150105) and Alexa Fluor® 594 antirabbit IgG (1:200, Abcam, ab150080) as the secondary antibodies. Images were acquired with the LSM710 confocal microscope (Carl Zeiss) with a Plan‐Neofluar 40×/1.3‐NA oil objective lens.
Sphere formation and tumorigenicity assay
Sphere formation and tumorigenicity assay were performed as previously described (Bertolini et al, 2009). Cells were seeded at 1 × 10⁵ cells/ml at ultralow attachment plates in 3dGRO™ Spheroid Medium (Sigma) and cultured for 7 days, followed by measurement of the sphere with a diameter ≥ 50μm under the microscope.
For tumorigenic analysis, six mice split into each group were injected, and 0.1 million CSCs were suspended in Matrigel (BD Biosciences) at a ratio of 1:1 and injected subcutaneously into the right flank of immune‐deficient B‐NSG mice (Biocytogen, Beijing, 8‐weeks old), followed by the monitor of solid tumors. Touchable tumor on Day 10 post‐CSC injection, accessed by two independent researchers, was identified as “positive mice.”
Seahorse assay
Cells were seeded into 96‐well plates (10,000 cells per well) for the seahorse assay using an XF96 extracellular analyzer (Seahorse Bioscience; Zeisbrich et al, 2018). Seahorse XF Cell Mito Stress Test kit (Agilent) was used to measure the parameters of mitochondrial function.
Mitochondrial DNA detection
Mitochondria were isolated using Mitochondria Isolation Kit for Cultured Cells (Abcam). The lysosomal fraction was purified using Lysosome Isolation Kit (Abcam). Mitochondrial DNA and nucleic DNA from mitochondrial pellets, lysosomal pellets, and nuclear fractions were extracted using DNeasy Blood & Tissue Kit (Qiagen) (Zhang et al, 2014b). For some experiments, TLR9 was immunoprecipitated using an anti‐TLR9 antibody (Cell Signaling Technology, 2254S), and mtDNA binding was analyzed.
The content of mitochondrial DNA was determined by real‐time PCR analysis of the mitochondrial gene COX1 and normalized to the expression of the nucleic gene ACTB (Sansone et al, 2017). Nuclear DNA was identified by analyzing the gene POLG using qPCR (Wang et al, 2021). The oxidation of mitochondrial DNA was determined by evaluating 8‐OH‐dG modifications in mitochondrial DNA (Li et al, 2019).
AMP/ATP ratio analysis
ADP/ATP ratios were determined with ADP/ATP Ratio Assay Kit (Abcam) and calculated for AMP/ATP ratios as previously described (Wen et al, 2019).
NSCLC PDX model and treatments
NSCLC patient‐derived xenograft models were established as previously described (Wang et al, 2017). Immune‐deficient B‐NSG mice (Biocytogen, Beijing) at 8 weeks of age were housed under specific pathogen‐free conditions. Small fragments (3–5 mm in diameter) of tumor tissues were implanted subcutaneously into mice and measured with digital calipers to establish the human tumor xenograft model. When the xenografts grew to 500–600 mm3, they were explanted, cut into small fragments, and transplanted into new NSG mice for the next generation. The third generation of PDX models was used for experiments. For treatments, stimulatory CpG ODN (50 μg/mouse, InvivoGen) or control ODN was given at 2‐day intervals through intratumoral injection. Chemotherapy with Cisplatin (5 mg/kg/mouse, Sigma) was performed at 3‐day intervals for 2 weeks when the tumor size reached around 100 mm3 (Bertolini et al, 2009; Wang et al, 2018). Mitophagy inhibitor Mdivi‐1 (50 mg/kg, Cayman) was given by intraperitoneal injection twice daily (Wang et al, 2020). TLR9 inhibitor Chloroquine (0.29 mg/ml, Sigma) was administered in the drinking water (Cook et al, 2014). Notch1 inhibitor DAPT (10 mg/kg/mouse, Sigma) was given daily through intraperitoneal injection (Zhao et al, 2016). AMPK activator A769662 (30 mg/kg/mouse, bid) was intraperitoneally injected (Wen et al, 2019), while AMPK inhibitor Compound C (15 mg/kg/mouse, Sigma) was given twice a week through intratumoral injection (Dai et al, 2013). Experiments were performed following the ARRIVE guidelines and approved by the Ethics Committee of Soochow University.
Statistics
Data are presented as mean ± SEM. Paired Student's t‐test was used for two‐group comparisons with the Bonferroni method for adjustment of multiple comparisons. Analysis of variance (ANOVA) was used to compare more than two groups, and post‐ANOVA pair‐wise two‐group comparisons were conducted with Tukey's method. All statistical analyses were performed using PRISM 8.0 (GraphPad Software Inc.). P < 0.05 was considered significant. The number of independent experiments or individuals is provided in each figure legend.
Author contributions
Zhen Liu: Conceptualization; data curation; formal analysis; validation; investigation; visualization; methodology; writing – original draft; writing – review and editing. Shan Shan: Resources; data curation; validation; investigation; methodology. Zixin Yuan: Data curation; validation; investigation; visualization; methodology. Fengying Wu: Data curation; formal analysis; investigation; methodology. Ming Zheng: Data curation; investigation; methodology. Ying Wang: Investigation; methodology. Jun Gui: Conceptualization; resources. Wei Xu: Conceptualization; resources. Chunhong Wang: Conceptualization; resources; funding acquisition; writing – original draft. Tao Ren: Conceptualization; resources; funding acquisition; writing – original draft. Zhenke Wen: Conceptualization; resources; data curation; supervision; funding acquisition; validation; writing – original draft; project administration; writing – review and editing.
Disclosure and competing interests statement
The authors declare that they have no conflict of interest.
Supporting information
Appendix
Expanded View Figures PDF
Source Data for Expanded View and Appendix
PDF+
Source Data for Figure 1
Source Data for Figure 2
Source Data for Figure 3
Source Data for Figure 4
Source Data for Figure 5
Source Data for Figure 6
Source Data for Figure 7
Source Data for Figure 8
Acknowledgments
This work was supported by the National Natural Science Foundation of China (81870055, 81930001, 82071826, 82271841), Natural Science Foundation of Jiangsu Province (BK20211542, BK20201407), Jiangsu Specially Appointed Professor Program, Major Project of Natural Science Research in Jiangsu Higher Education Institutions (22KJA310005), Suzhou Municipal Science and Technology Bureau (ZXL2022460), Priority Academic Program Development of Jiangsu Higher Education Institutions (PAPD), Key Laboratory for Gene Detection and Therapy of Guizhou Province (KY2017‐007‐1), Medicine and Engineering Interdisciplinary Research Fund of Shanghai Jiao Tong University (ZH2018ZDA21).
EMBO reports (2023) 24: e54006
Contributor Information
Chunhong Wang, Email: wangch@suda.edu.cn.
Tao Ren, Email: rentao305@163.com.
Zhenke Wen, Email: zkwen@suda.edu.cn.
Data availability
No large primary datasets have been generated in this study or deposited.
References
- Abdullah LN, Chow EK (2013) Mechanisms of chemoresistance in cancer stem cells. Clin Transl Med 2: 3 [DOI] [PMC free article] [PubMed] [Google Scholar]
- Ali N, Ling N, Krishnamurthy S, Oakhill JS, Scott JW, Stapleton DI, Kemp BE, Anand GS, Gooley PR (2016) beta‐subunit myristoylation functions as an energy sensor by modulating the dynamics of AMP‐activated protein kinase. Sci Rep 6: 39417 [DOI] [PMC free article] [PubMed] [Google Scholar]
- Alvarado AG, Thiagarajan PS, Mulkearns‐Hubert EE, Silver DJ, Hale JS, Alban TJ, Turaga SM, Jarrar A, Reizes O, Longworth MS et al (2017) Glioblastoma cancer stem cells evade innate immune suppression of self‐renewal through reduced TLR4 expression. Cell Stem Cell 20: 450–461.e4 [DOI] [PMC free article] [PubMed] [Google Scholar]
- Aster JC, Pear WS, Blacklow SC (2017) The varied roles of notch in cancer. Annu Rev Pathol 12: 245–275 [DOI] [PMC free article] [PubMed] [Google Scholar]
- Bao B, Ahmad A, Azmi AS, Ali S, Sarkar FH (2013) Overview of cancer stem cells (CSCs) and mechanisms of their regulation: implications for cancer therapy. Curr Protoc Pharmacol Chapter 14: Unit 14.25 [DOI] [PMC free article] [PubMed] [Google Scholar]
- Bao W, Xia H, Liang Y, Ye Y, Lu Y, Xu X, Duan A, He J, Chen Z, Wu Y et al (2016) Toll‐like receptor 9 can be activated by endogenous mitochondrial DNA to induce podocyte apoptosis. Sci Rep 6: 22579 [DOI] [PMC free article] [PubMed] [Google Scholar]
- Bertolini G, Roz L, Perego P, Tortoreto M, Fontanella E, Gatti L, Pratesi G, Fabbri A, Andriani F, Tinelli S et al (2009) Highly tumorigenic lung cancer CD133+ cells display stem‐like features and are spared by cisplatin treatment. Proc Natl Acad Sci USA 106: 16281–16286 [DOI] [PMC free article] [PubMed] [Google Scholar]
- Bhatia D, Chung KP, Nakahira K, Patino E, Rice MC, Torres LK, Muthukumar T, Choi AM, Akchurin OM, Choi ME (2019) Mitophagy‐dependent macrophage reprogramming protects against kidney fibrosis. JCI Insight 4: e132826 [DOI] [PMC free article] [PubMed] [Google Scholar]
- Bosc C, Selak MA, Sarry JE (2017) Resistance is futile: targeting mitochondrial energetics and metabolism to overcome drug resistance in cancer treatment. Cell Metab 26: 705–707 [DOI] [PubMed] [Google Scholar]
- Chan BA, Hughes BG (2015) Targeted therapy for non‐small cell lung cancer: current standards and the promise of the future. Transl Lung Cancer Res 4: 36–54 [DOI] [PMC free article] [PubMed] [Google Scholar]
- Cook KL, Warri A, Soto‐Pantoja DR, Clarke PA, Cruz MI, Zwart A, Clarke R (2014) Hydroxychloroquine inhibits autophagy to potentiate antiestrogen responsiveness in ER+ breast cancer. Clin Cancer Res 20: 3222–3232 [DOI] [PMC free article] [PubMed] [Google Scholar]
- Dai RY, Zhao XF, Li JJ, Chen R, Luo ZL, Yu LX, Chen SK, Zhang CY, Duan CY, Liu YP et al (2013) Implication of transcriptional repression in compound C‐induced apoptosis in cancer cells. Cell Death Dis 4: e883 [DOI] [PMC free article] [PubMed] [Google Scholar]
- De Francesco EM, Sotgia F, Lisanti MP (2018) Cancer stem cells (CSCs): metabolic strategies for their identification and eradication. Biochem J 475: 1611–1634 [DOI] [PMC free article] [PubMed] [Google Scholar]
- Gan RY, Li HB (2014) Recent progress on liver kinase B1 (LKB1): expression, regulation, downstream signaling and cancer suppressive function. Int J Mol Sci 15: 16698–16718 [DOI] [PMC free article] [PubMed] [Google Scholar]
- Garcia D, Shaw RJ (2017) AMPK: mechanisms of cellular energy sensing and restoration of metabolic balance. Mol Cell 66: 789–800 [DOI] [PMC free article] [PubMed] [Google Scholar]
- Glumac PM, LeBeau AM (2018) The role of CD133 in cancer: a concise review. Clin Transl Med 7: 18 [DOI] [PMC free article] [PubMed] [Google Scholar]
- Goulopoulou S, Matsumoto T, Bomfim GF, Webb RC (2012) Toll‐like receptor 9 activation: a novel mechanism linking placenta‐derived mitochondrial DNA and vascular dysfunction in pre‐eclampsia. Clin Sci 123: 429–435 [DOI] [PMC free article] [PubMed] [Google Scholar]
- Hendriks LE, Rouleau E, Besse B (2018) Clinical utility of tumor mutational burden in patients with non‐small cell lung cancer treated with immunotherapy. Transl Lung Cancer Res 7: 647–660 [DOI] [PMC free article] [PubMed] [Google Scholar]
- Herrmann A, Cherryholmes G, Schroeder A, Phallen J, Alizadeh D, Xin H, Wang T, Lee H, Lahtz C, Swiderski P et al (2014) TLR9 is critical for glioma stem cell maintenance and targeting. Cancer Res 74: 5218–5228 [DOI] [PMC free article] [PubMed] [Google Scholar]
- Herzig S, Shaw RJ (2018) AMPK: guardian of metabolism and mitochondrial homeostasis. Nat Rev Mol Cell Biol 19: 121–135 [DOI] [PMC free article] [PubMed] [Google Scholar]
- Jacob F, Salinas RD, Zhang DY, Nguyen PTT, Schnoll JG, Wong SZH, Thokala R, Sheikh S, Saxena D, Prokop S et al (2020) A patient‐derived glioblastoma organoid model and biobank recapitulates inter‐ and intra‐tumoral heterogeneity. Cell 180: 188–204.e22 [DOI] [PMC free article] [PubMed] [Google Scholar]
- Kagan JC (2012) Signaling organelles of the innate immune system. Cell 151: 1168–1178 [DOI] [PMC free article] [PubMed] [Google Scholar]
- Kim C, Giaccone G (2018) Precision oncology in non‐small‐cell lung cancer: opportunities and challenges. Nat Rev Clin Oncol 15: 348–349 [DOI] [PubMed] [Google Scholar]
- Kishton RJ, Barnes CE, Nichols AG, Cohen S, Gerriets VA, Siska PJ, Macintyre AN, Goraksha‐Hicks P, de Cubas AA, Liu T et al (2016) AMPK is essential to balance glycolysis and mitochondrial metabolism to control T‐ALL cell stress and survival. Cell Metab 23: 649–662 [DOI] [PMC free article] [PubMed] [Google Scholar]
- Lampert MA, Orogo AM, Najor RH, Hammerling BC, Leon LJ, Wang BJ, Kim T, Sussman MA, Gustafsson AB (2019) BNIP3L/NIX and FUNDC1‐mediated mitophagy is required for mitochondrial network remodeling during cardiac progenitor cell differentiation. Autophagy 15: 1182–1198 [DOI] [PMC free article] [PubMed] [Google Scholar]
- Li Y, Shen Y, Jin K, Wen Z, Cao W, Wu B, Wen R, Tian L, Berry GJ, Goronzy JJ et al (2019) The DNA repair nuclease MRE11A functions as a mitochondrial protector and prevents T cell pyroptosis and tissue inflammation. Cell Metab 30: 477–492.e6 [DOI] [PMC free article] [PubMed] [Google Scholar]
- Lin SC, Hardie DG (2018) AMPK: sensing glucose as well as cellular energy status. Cell Metab 27: 299–313 [DOI] [PubMed] [Google Scholar]
- Matsui WH (2016) Cancer stem cell signaling pathways. Medicine 95: S8–S19 [DOI] [PMC free article] [PubMed] [Google Scholar]
- McCarthy CG, Wenceslau CF, Ogbi S, Szasz T, Webb RC (2018) Toll‐like receptor 9‐dependent AMPK alpha activation occurs via TAK1 and contributes to RhoA/ROCK signaling and actin polymerization in vascular smooth muscle cells. J Pharmacol Exp Ther 365: 60–71 [DOI] [PMC free article] [PubMed] [Google Scholar]
- Moynihan KD, Irvine DJ (2017) Roles for innate immunity in combination immunotherapies. Cancer Res 77: 5215–5221 [DOI] [PMC free article] [PubMed] [Google Scholar]
- Murakami K, Kurotaki D, Kawase W, Soma S, Fukuchi Y, Kunimoto H, Yoshimi R, Koide S, Oshima M, Hishiki T et al (2021) OGT regulates hematopoietic stem cell maintenance via PINK1‐dependent mitophagy. Cell Rep 34: 108579 [DOI] [PubMed] [Google Scholar]
- Okatsu K, Oka T, Iguchi M, Imamura K, Kosako H, Tani N, Kimura M, Go E, Koyano F, Funayama M et al (2012) PINK1 autophosphorylation upon membrane potential dissipation is essential for Parkin recruitment to damaged mitochondria. Nat Commun 3: 1016 [DOI] [PMC free article] [PubMed] [Google Scholar]
- Onishi M, Yamano K, Sato M, Matsuda N, Okamoto K (2021) Molecular mechanisms and physiological functions of mitophagy. EMBO J 40: e104705 [DOI] [PMC free article] [PubMed] [Google Scholar]
- Phi LTH, Sari IN, Yang YG, Lee SH, Jun N, Kim KS, Lee YK, Kwon HY (2018) Cancer Stem Cells (CSCs) in drug resistance and their therapeutic implications in cancer treatment. Stem Cells Int 2018: 5416923 [DOI] [PMC free article] [PubMed] [Google Scholar]
- Prabavathy D, Swarnalatha Y, Ramadoss N (2018) Lung cancer stem cells‐origin, characteristics and therapy. Stem Cell Investig 5: 6 [DOI] [PMC free article] [PubMed] [Google Scholar]
- Ren T, Wen ZK, Liu ZM, Liang YJ, Guo ZL, Xu L (2007) Functional expression of TLR9 is associated to the metastatic potential of human lung cancer cell: functional active role of TLR9 on tumor metastasis. Cancer Biol Ther 6: 1704–1709 [DOI] [PubMed] [Google Scholar]
- Ren T, Xu L, Jiao S, Wang Y, Cai Y, Liang Y, Zhou Y, Zhou H, Wen Z (2009) TLR9 signaling promotes tumor progression of human lung cancer cell in vivo . Pathol Oncol Res 15: 623–630 [DOI] [PubMed] [Google Scholar]
- Rodriguez‐Nuevo A, Diaz‐Ramos A, Noguera E, Diaz‐Saez F, Duran X, Munoz JP, Romero M, Plana N, Sebastian D, Tezze C et al (2018) Mitochondrial DNA and TLR9 drive muscle inflammation upon Opa1 deficiency. EMBO J 37: e96553 [DOI] [PMC free article] [PubMed] [Google Scholar]
- Sansone P, Savini C, Kurelac I, Chang Q, Amato LB, Strillacci A, Stepanova A, Iommarini L, Mastroleo C, Daly L et al (2017) Packaging and transfer of mitochondrial DNA via exosomes regulate escape from dormancy in hormonal therapy‐resistant breast cancer. Proc Natl Acad Sci USA 114: E9066–E9075 [DOI] [PMC free article] [PubMed] [Google Scholar]
- Shen Y, Wen Z, Li Y, Matteson EL, Hong J, Goronzy JJ, Weyand CM (2017) Metabolic control of the scaffold protein TKS5 in tissue‐invasive, proinflammatory T cells. Nat Immunol 18: 1025–1034 [DOI] [PMC free article] [PubMed] [Google Scholar]
- Sin J, Andres AM, Taylor DJ, Weston T, Hiraumi Y, Stotland A, Kim BJ, Huang C, Doran KS, Gottlieb RA (2016) Mitophagy is required for mitochondrial biogenesis and myogenic differentiation of C2C12 myoblasts. Autophagy 12: 369–380 [DOI] [PMC free article] [PubMed] [Google Scholar]
- Takebe N, Miele L, Harris PJ, Jeong W, Bando H, Kahn M, Yang SX, Ivy SP (2015) Targeting Notch, Hedgehog, and Wnt pathways in cancer stem cells: clinical update. Nat Rev Clin Oncol 12: 445–464 [DOI] [PMC free article] [PubMed] [Google Scholar]
- Wang K, Shan S, Yang Z, Gu X, Wang Y, Wang C, Ren T (2017) IL‐33 blockade suppresses tumor growth of human lung cancer through direct and indirect pathways in a preclinical model. Oncotarget 8: 68571–68582 [DOI] [PMC free article] [PubMed] [Google Scholar]
- Wang K, Shan S, Wang S, Gu X, Zhou X, Ren T (2018) HMGB1‐containing nucleosome mediates chemotherapy‐induced metastasis of human lung cancer. Biochem Biophys Res Commun 500: 758–764 [DOI] [PubMed] [Google Scholar]
- Wang Y, Lu M, Xiong L, Fan J, Zhou Y, Li H, Peng X, Zhong Z, Wang Y, Huang F et al (2020) Drp1‐mediated mitochondrial fission promotes renal fibroblast activation and fibrogenesis. Cell Death Dis 11: 29 [DOI] [PMC free article] [PubMed] [Google Scholar]
- Wang Y, Fu Z, Li X, Liang Y, Pei S, Hao S, Zhu Q, Yu T, Pei Y, Yuan J et al (2021) Cytoplasmic DNA sensing by KU complex in aged CD4(+) T cell potentiates T cell activation and aging‐related autoimmune inflammation. Immunity 54: 632–647.e9 [DOI] [PubMed] [Google Scholar]
- Wen Z, Shen Y, Berry G, Shahram F, Li Y, Watanabe R, Liao YJ, Goronzy JJ, Weyand CM (2017) The microvascular niche instructs T cells in large vessel vasculitis via the VEGF‐Jagged1‐Notch pathway. Sci Transl Med 9: eaal3322 [DOI] [PMC free article] [PubMed] [Google Scholar]
- Wen Z, Jin K, Shen Y, Yang Z, Li Y, Wu B, Tian L, Shoor S, Roche NE, Goronzy JJ et al (2019) N‐myristoyltransferase deficiency impairs activation of kinase AMPK and promotes synovial tissue inflammation. Nat Immunol 20: 313–325 [DOI] [PMC free article] [PubMed] [Google Scholar]
- Xu J, Chi F, Guo T, Punj V, Lee WN, French SW, Tsukamoto H (2015) NOTCH reprograms mitochondrial metabolism for proinflammatory macrophage activation. J Clin Invest 125: 1579–1590 [DOI] [PMC free article] [PubMed] [Google Scholar]
- Yang H, Sun W, Quan N, Wang L, Chu D, Cates C, Liu Q, Zheng Y, Li J (2016) Cardioprotective actions of Notch1 against myocardial infarction via LKB1‐dependent AMPK signaling pathway. Biochem Pharmacol 108: 47–57 [DOI] [PMC free article] [PubMed] [Google Scholar]
- Zeisbrich M, Yanes RE, Zhang H, Watanabe R, Li Y, Brosig L, Hong J, Wallis BB, Giacomini JC, Assimes TL et al (2018) Hypermetabolic macrophages in rheumatoid arthritis and coronary artery disease due to glycogen synthase kinase 3b inactivation. Ann Rheum Dis 77: 1053–1062 [DOI] [PMC free article] [PubMed] [Google Scholar]
- Zhang CS, Jiang B, Li M, Zhu M, Peng Y, Zhang YL, Wu YQ, Li TY, Liang Y, Lu Z et al (2014a) The lysosomal v‐ATPase‐Ragulator complex is a common activator for AMPK and mTORC1, acting as a switch between catabolism and anabolism. Cell Metab 20: 526–540 [DOI] [PubMed] [Google Scholar]
- Zhang JZ, Liu Z, Liu J, Ren JX, Sun TS (2014b) Mitochondrial DNA induces inflammation and increases TLR9/NF‐kappaB expression in lung tissue. Int J Mol Med 33: 817–824 [DOI] [PMC free article] [PubMed] [Google Scholar] [Retracted]
- Zhang X, Wang C, Shan S, Liu X, Jiang Z, Ren T (2016) TLR4/ROS/miRNA‐21 pathway underlies lipopolysaccharide instructed primary tumor outgrowth in lung cancer patients. Oncotarget 7: 42172–42182 [DOI] [PMC free article] [PubMed] [Google Scholar]
- Zhang Y, Xu W, Guo H, Zhang Y, He Y, Lee SH, Song X, Li X, Guo Y, Zhao Y et al (2017) NOTCH1 signaling regulates self‐renewal and platinum chemoresistance of cancer stem‐like cells in human non‐small cell lung cancer. Cancer Res 77: 3082–3091 [DOI] [PubMed] [Google Scholar]
- Zhao ZL, Zhang L, Huang CF, Ma SR, Bu LL, Liu JF, Yu GT, Liu B, Gutkind JS, Kulkarni AB et al (2016) NOTCH1 inhibition enhances the efficacy of conventional chemotherapeutic agents by targeting head neck cancer stem cell. Sci Rep 6: 24704 [DOI] [PMC free article] [PubMed] [Google Scholar]


