

Abstract
Objectives
Metabolic-associated fatty liver disease (MAFLD) is the most common chronic liver disease that can range from hepatic steatosis to non-alcoholic steatohepatitis (NASH), which can lead to fibrosis and cirrhosis. Recently, ketogenic diet (KD), a low carbohydrate diet, gained popularity as a weight-loss approach, although it has been reported to induce hepatic insulin resistance and steatosis in animal model systems via an undefined mechanism. Herein, we investigated the KD metabolic benefits and its contribution to the pathogenesis of NASH.
Methods
Using metabolic, biochemical and omics approaches, we identified the effects of a KD on NASH and investigated the mechanisms by which KD induces hepatic insulin resistance and steatosis.
Results
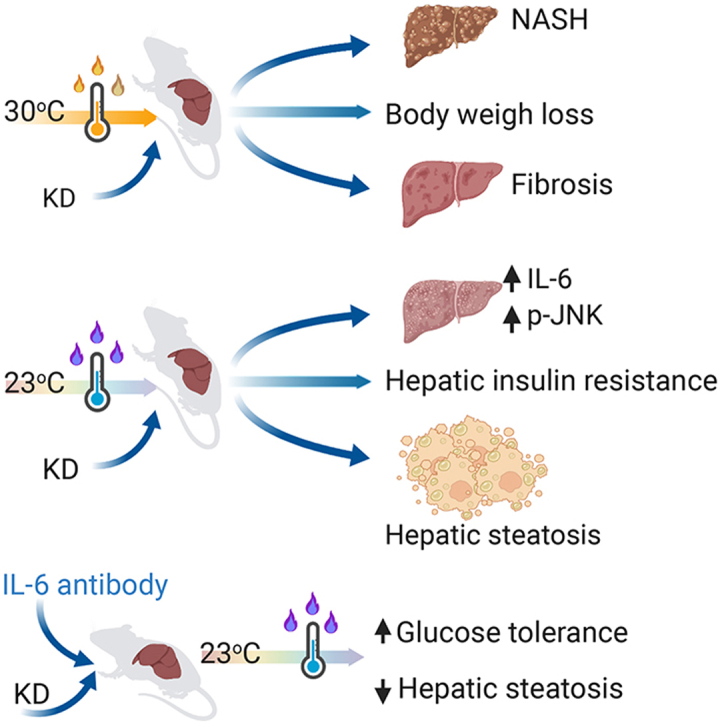
We demonstrate that KD can induce fibrosis and NASH regardless of body weight loss compared to high-fat diet (HFD) fed mice at thermoneutrality. At ambient temperature (23 °C), KD-fed mice develop a severe hepatic injury, inflammation, and steatosis. In addition, KD increases liver cholesterol, IL-6, and p-JNK and aggravates diet induced-glucose intolerance and hepatic insulin resistance compared to HFD. Pharmacological inhibition of IL-6 and JNK reverses KD-induced glucose intolerance, and hepatic steatosis and restores insulin sensitivity.
Conclusions
Our studies uncover a new mechanism for KD-induced hepatic insulin resistance and NASH potentially via IL-6-JNK signaling and provide a new NASH mouse model.
Keywords: Ketogenic diet, Hepatic insulin resistance, NASH, MAFLD, IL6, JNK
Graphical abstract
Highlights
-
•
Ketogenic diet reduces body weight and induces NASH at thermoneutrality
-
•
Ketogenic diet increased IL-6 and JNK signaling pathways
-
•
IL-6 and JNK induced hepatic insulin resistance and steatosis in keteogenic diet fed mice
-
•
IL-6 neutralization reverses hepatic steatosis in ketogenic diet-fed mice
-
•
Ketogenic diet is a new useful NASH mouse model
List of abbreviations
- MAFLD
metabolic associated fatty liver disease
- NAFLD
Non-alcohol fatty liver disease
- NASH
non-alcoholic steatohepatitis
- KD
ketogenic diet
- HFD
high-fat diet
- FFA
free fatty acid
- WAT
white adipose tissue
- DIO
diet-induced obesity
- IL-6
interleukin-6
- CD
chow diet
- JNK
c-jun N-terminal kinase
- LPC
lysophosphatidylcholine
- PE
Phosphatidylethanolamine
- DG
diglycerides
- PS
phosphatidylserine
- PG
phosphatidylglycerol
- PI
phosphatidylinositol
- PEP
PE-based plasmalogens
- Cer
ceramides
- HexCer
hexosylceramides
- TG
Triglycerides
- CE
cholesteryl ester
- PC
Phosphatidylcholine
- SM
sphingomyelin
- FC
free cholesterol
1. Introduction
Metabolic-associated fatty liver disease (MAFLD) is a hepatic manifestation of metabolic disorders that can range from steatosis to non-alcoholic steatohepatitis (NASH). NASH, the aggravated form of MAFLD [1,2], can progress to liver fibrosis, cirrhosis and hepatocellular carcinoma [3]. MAFLD is affecting up to a third of adults in high-income countries [3]. Many individuals with MAFLD have obesity [3,4], although, non-obese persons can also develop MAFLD [5]. The imbalance between liver lipid storage and removal [6], due to increased fat intake, elevated de novo lipogenesis, increased lipolysis in adipose tissue, decreased fat oxidation, and reduced hepatic very low-density lipoprotein secretion contributes to MAFLD [[7], [8], [9]]. Moreover, inflammatory signals from adipose tissue: such as TNFα, IL-6 and CCL2 can exacerbate liver inflammation, cell death, and fibrosis [1,2]. One-third of NASH patients develop fibrosis and MAFLD-related mortality is increased up to ten-fold in patients with NASH [10]. Therefore, many pharmacological agents have been studied with the aim to improve liver inflammation and steatosis to prevent MAFLD [11]. Nevertheless, weight loss remains the only standard intervention method for the management of NAFLD in patients [12].
Studies investigated the mechanism behind MAFLD and reported that IL-6 induces free fatty acid (FFA) release from visceral adipocytes, thereby promoting diet-induced hepatic insulin resistance and steatosis [13]. Visceral white adipose tissue (WAT) is a source for diet-induced circulating IL-6, while subcutaneous WAT contributes to basal IL-6 levels [14]. Elevated IL-6 levels in mice with liver-specific overexpression of IKK-β were associated with glucose intolerance and hepatic insulin resistance [15] and IL-6 neutralization in mice led to improved hepatic insulin resistance [15], indicating that IL-6 involved in modulation of liver function [14,15].
The inflammatory c-jun N-terminal kinase (JNK), a member of the mitogen activated protein kinase (MAPK) family, is activated by TNFα, IL-6 and FFA, and can increase Ser/Thr phosphorylation of IRS1/2, that can lead to insulin resistance [[16], [17], [18]]. While, deletion of JNK1 in adipose tissue results in blunted IL-6 in DIO mice [19] and increased hepatic insulin sensitivity [20]. Furthermore, liver JNK1 knockout mice demonstrate decreased steatosis, suggesting that JNK activation in the liver can induces MAFLD [21] and insulin resistance [22].
Ketogenic diet (KD), a high-fat and low-carbohydrate diet, which is used in the treatment of epilepsy [23] and has beneficial effect in autism and Alzheimer disease [24], has become a popular weight loss strategy [25,26]. KD is inherently a low-protein diet [27]. In lean healthy people without diabetes and pregnancy, KD induces ketosis after 2–4 days [28]. In mice a KD containing 9.1% calories from protein significantly increased ketone bodies after 1 day [29]. Clinical KD used in humans are restricted in protein content (5–10% of calories from protein compared to normal diets which contain 15–20% of protein) [27]. However, most commonly used rodent KD contains less than 5% of energy from proteins [27] which can lead to inconsistent results between human and animal studies [30]. For instance, KD with low protein levels led to elevated FGF21 levels, independent of ketogenesis in mice [31]. Based on these points it was proposed that for translational studies in mice, KD should contain 8–10% protein to ensure that the observations are due to low carbohydrate content, rather than due to protein restriction [27].
Clinical studies reported that KD improved blood glucose, serum lipid and led to weight loss in obese subjects [25,26,32]. However, a 3-day of KD consumption increased postprandial plasma glucose in healthy men [33]. Four weeks of KD intervention also increased cholesterol and inflammatory markers in obese subjects [34]. In mice, 12 or 22 weeks of KD increased steatosis, inflammation and glucose intolerance [35,36]. Moreover, hyperinsulinemic–euglycemic clamp studies demonstrated that 5 weeks of KD induced hepatic insulin resistance in mice [37]. The underlying mechanisms behind KD-induced hepatic insulin resistance and steatosis, however, remain undefined. Here, we investigated the metabolic effects of a KD with 8.5% of protein at late timepoints to ensure a robust ketosis phenotype and its contribution to the pathogenesis of NASH, to identify the mechanisms underlying KD-induced hepatic insulin resistance, steatosis and fibrosis.
2. Materials and methods
2.1. Animal
C57BL/6 mice were obtained from Charles River (Wilmington, MA, USA) and housed in a pathogen-free animal facility at 23 °C/30 °C under a 12-hour light/dark cycle with free access to water and standard chow diet (18% proteins, 4.5% fibers, 4.5% fat, 6.3% ashes of energy, #2222, Kliba-Nafag, Switzerland). After 12 weeks of chow, male mice were fed either a chow, a KD (8.5% protein, 4.3% fibers, 79.1% fat, 4.3% ashes, 3.8% carbohydrate of calories, E15149 Snniff, Germany), or a high-fat diet (HFD) with 60% of energy derived from fat (23.9% protein, 3% fibers, 35% fat, 5.7% ashes, 23.2% carbohydrate, #3436, Kliba-Nafag, Switzerland). All animal studies conformed to the Swiss animal protection laws and were approved by the cantonal Veterinary Office in Zurich, Switzerland
2.2. Glucose tolerance test
To investigate whether KD effect on glucose tolerance is acute or progressive 12 weeks old male mice were randomly assigned to either chow, KD or HFD for 3 and 7 days or 5 and 16 weeks. Mice were fasted for 6 h and baseline glucose levels were measured. Thereafter, glucose (2 g/kg body weight (d-glucose, Sigma in 0.9% saline)) was injected intraperitoneal (i.p.) and blood glucose concentration was measured from tail-tip blood after 15, 30, 45, 60, 90, and 120 min by using a glucometer (Accu-Check Aviva glucose strip system, #07400918016, #06453988016; Roche Diagnostics International, Basel, Switzerland).
2.3. IL-6 neutralization antibody
For in vivo IL-6 neutralization 12 weeks old male mice were randomly assigned to either chow, KD or HFD for 3 days and received an i.p. injection of 100 μg rat anti-mouse IL-6 antibody (Cat# 16-7061, Clone MP5-20F3, Switzerland) in 0.1 ml Dulbecco's phosphate-buffered saline. Rat IgG1 (Cat# 16-4301, ThermoFisher, Switzerland) was administered as an isotype-matched control. Administration of the antibodies was conducted every day for consecutive 3 days.
2.4. JNK inhibitor treatment
12 weeks old male mice were randomly assigned to either chow, KD or HFD for 3 days for pharmacological inhibition of JNK, 10 mg/kg AS602801 (Cat# HY-14761, Med Chem Express, Switzerland) or vehicle alone (2:8:1:9 ratio of DMSO; PEG300; Tween-80; saline) was administered by i.p. injection once daily for consecutive 3 days.
2.5. Lipid extraction and mass spectrometric analysis
Liver samples from mice fed a chow, KD or HFD for 3 days were fasted for 6 hrs and injected with glucose before sampling to mimic KD-Induced glucose intolerance. Liver samples were subjected to bead-based homogenization in H2O/MeOH = 1/1 supplemented with 1% SDS at a concentration of 0.05 mg wet weight/μL [38]. The lipids were extracted from 2 mg of wet weight according to the method of Bligh and Dyer [39] in the presence of not naturally occurring lipid species as internal standards. The following lipid species were added as internal standards: PC 14:0/14:0, PC 22:0/22:0, PE 14:0/14:0, PE 20:0/20:0 (di-phytanoyl), PS 14:0/14:0, PS 20:0/20:0 (di-phytanoyl), PI 17:0/17:0, LPC 13:0, LPC 19:0, LPE 13:0, Cer 18:1;O2/14:0, Cer 18:1;O2/17:0, D7-FC, CE 17:0, CE 22:0, TG 51:0, TG 57:0, DG 28:0 and DG 40:0. Chloroform phase was recovered by a pipetting robot (Tecan Genesis RSP 150) and vacuum dried. The residues were dissolved in either in 10 mM ammonium acetate in methanol/chloroform (3:1, v/v) (for low mass resolution tandem mass spectrometry) or chloroform/methanol/2-propanol (1:2:4 v/v/v) with 7.5 mM ammonium formate (for high resolution mass spectrometry). Data analysis was performed by wilcoxon pairwise comparisons with corrections for multiple testing, details in the supplementary.
2.6. Histological analysis
For histological analysis, 12 weeks old male mice were randomly assigned to either chow, KD or HFD for 3 days or 14 and 16 weeks at ambient or thermoneutrality. Liver tissues from all mice were fixed with 4% paraformaldehyde in PBS (Gibco; pH 7.4) for 24 h at 4 °C, dehydrated and embedded in paraffin. Liver sections (3 μm thick) were stained with hematoxylin and eosin (H&E), Oil red O, van Giesson/granular osmiophilic material (GOM)/Masson's trichrome and cleaved caspase 3. Tissue processing was performed by Prof. Dr. Anja Kipar (Pathologist, Zurich University); liver sections were stained with auto strainers for histology, immunohistology and the images were acquired by digital slide scanners and quantified. Histological assessments were conducted in blinded conditions. For quantitative assessment, various parameters, including inflammation, steatosis, hepatocyte ballooning, fibrosis, NASH and NAFLD, the NASH Clinical Research Network Scoring System [40] were assessed, taking into account murine NAFLD activity score according to [41,42].
2.7. Plasma and tissue lysate parameters
To study KD effects on inflammatory cytokines, 12 weeks old male mice were randomly assigned to either chow, KD or HFD for 3 days and 16 weeks. Mice were fasted for 6 h and injected glucose 30 min, or without glucose injections before tissue and blood sampling. Circulating IL-6 concentration, IL-6 in liver, mesenteric fat, and ingWAT lysate were measured by using Mouse IL-6 ELISA Kit (RayBiotech, #ELM-IL6, Luzern, Switzerland). Liver cholesterol was measured by Cobas Roche (Hitachi Kit #11877771, Roche Diagnostics International). Plasma cytokine Interferon gamma (IFN-γ), interleukin 1 beta (IL-1β), interleukin 2 (IL-2), interleukin 5 (IL-5), interleukin 6 (IL-6), interleukin 10 (IL-10), interleukin-12 (IL-12p70), tumor necrosis factor alpha (TNF-α), and keratinocyte chemoattractant (KC)/growth-regulated oncogene (GRO) chemokines and pro-inflammatory chemokines were measured using the MSD technology (Meso Scale Discovery, Gaithersburg, MD, USA). All analyses were carried out according to manufacturer's protocols.
2.8. Quantification and statistical analysis
A power calculation was performed based on the results of previous work by our group to calculate animal numbers [43]. All data are expressed as mean ± standard error of the mean. The significance was determined using a two-tailed, unpaired Student's t-test, one-way ANOVA with Newman–Keuls correction for multiple group comparisons, or two-way ANOVA with Bonferroni multiple comparisons/Tukey's multiple comparison. Statistical tests were calculated using GraphPad Prism 8.0 (GraphPad Software, San Diego, USA). P-values <0.05 were considered significant. For further details regarding the materials and methods used, please refer to the supplementary information.
3. Results
3.1. Three days of KD induces hepatic steatosis
To investigate whether short-term KD can induce hepatic steatosis, we analyzed the physiological changes in response to 3 days of KD feeding in mice (Figure 1A). Three days of KD reduced body weight compared to chow and HFD-fed mice (Figure 1B). Importantly, 16 weeks (Fig. S1A) of chow and KD led to a similar body weight gain compared to HFD (Fig. S1B), indicating that long term KD feeding does not affect body weight in lean mice. As expected, 16 weeks of HFD significantly increased liver and fat tissue masses, whereas similar fat tissue weights were observed in chow and KD-fed mice (Figs. S1C–D). KD significantly increased liver weight compared to chow-fed mice (Fig. S1D). In addition, 3 days or 16 weeks of KD increased hepatic lipid droplet accumulation (Figure 1C, S1E) demonstrating that KD accelerates diet-induced hepatic steatosis.
Figure 1.

Three days of ketogenic diet (KD) accelerates diet-induced hepatic steatosis. (A) Experimental scheme for KD or high fat diet (HFD) feeding in C57BL/6 WT mice. WT Chow (CD) fed mice (black): KD-fed mice (orange): and HFD groups (blue). Mice were fed a CD, KD or HFD for 3 days and fasted for 6-hrs and injected with glucose (2 g/kg body) 30 min before sampling. (B) Body weight measurement (CD n = 5; KD n = 8; HFD n = 8), values are presented as mean ± SEM. ∗∗∗(p < 0.001), ### (p < 0.001) by 2-way ANOVA. (C) Representative images of liver sections stained with H&E from mice fed a CD, HFD and KD. Scale bar represents 100 μm. (D) Individual plots with 95% confidence ellipses of the lipid principal component analysis. (E) Lipid profile clustering plots with Ward's criterion and (F) Volcano plots for lipid analysis by pairwise comparisons. (G–-I) Volcano plot of lipid detected (G) yellow: 50 upregulated lipid species in KD, purple: 27 decreased lipid species in KD vs CD, black: NS. (H) yellow: 41 increased lipid species in KD, purple: 7 decreased lipid species in KD vs HFD, black: NS. (I) yellow: 14 increased lipid species in HFD, purple: 11 decreased lipid species in HFD vs CD, black: NS. For G-I p-values corresponding to a t-test of single lipid concentrations. (J) The distribution of the lipid species in the pool of lipids upregulated vs the total pool tested with Fisher's exact test for count data with Monte-Carlo simulated P-value 10,000 replicates; P < 0.01. TG = triglyceride. (K) Total concentrations of liver TG. (L) Free cholesterol. D-L number of mice (CD n = 5; KD n = 8; HFD n = 6). (For interpretation of the references to color in this figure legend, the reader is referred to the Web version of this article.)
To determine which lipid molecular species were altered during the progression of hepatic steatosis in response to a KD, we used a mass spectrometry based lipidomics approach on liver samples of mice fed chow, HFD or KD for 3 days (Table S1). In a principal component analysis, we observed a separation of lipids from the 3 diets, with no overlap of confidence ellipses in the two first dimensions (representing 51.4% and 19.1% of the overall inertia, Figure 1D) in KD vs chow or HFD conditions. Similarly, a heatmap and a lipid profile cluster analysis separated chow, HFD and KD-fed mice into three non-overlapping groups (Figure 1E, F). Furthermore, we found that KD feeding increased the concentration of 50 distinct lipid species compared to chow feeding (Figure 1G) and 41 lipids compared to HFD feeding (Figure 1H). HFD feeding leads to the increase of only 14 lipids compared to chow conditions (Figure 1I). Lower lipid species observed were 23 in KD vs chow, 8 in KD vs HFD and 11 in chow vs HFD. Taken together, these results indicate that KD feeding markedly modifies the overall liver lipid profile.
To test whether KD feeding affects the lipid profile in a selective or indiscriminate manner, we compared the lipid profile of upregulated lipids to that of the overall pool of detected lipids. We found that triglycerides (TG) species are overrepresented in the pool of upregulated lipids (KD vs chow and KD vs HFD feeding) (Figure 1J), indicating that KD feeding selectively affects this lipid class. In accordance, the total liver concentration of TG is increased 10-fold under KD conditions compared to chow or HFD feeding (Figure 1K). Similarly, free cholesterol concentrations increased more than two-fold in KD compared to chow or HFD conditions (Figure 1L). In addition to these quantitatively major changes, the concentrations of multiple other lipid classes such as: PE, PEP, PI, PG, LPE, DG and CE are affected by KD feeding (Fig. S2A–B, D–E, G–I, L–M). Moreover, plasma total ketones levels were significantly increased in KD fed mice, while plasma FFA, TG, and cholesterol levels were comparable between the chow, KD or HFD conditions in our previous report [43], indicating that KD feeding increases mainly liver TG and liver cholesterol levels. Collectively, our data indicate that KD feeding induces hepatic lipid accumulation in the form of TG.
3.2. KD feeding aggravates diet induced-glucose intolerance and increases IL-6 levels
Hepatic steatosis is associated with impaired glucose metabolism and chronic hepatic inflammation [44]. Thus, we investigated whether the KD mediated effects on glucose metabolism are adaptational or persistent. Therefore, we performed intraperitoneal glucose tolerance tests (GTT) in mice fed a chow, HFD or KD for 3, 7 days as well as 5 and 16 weeks. As expected, fasting blood glucose levels were lower in KD compared to chow or HFD fed mice (Figure 2A, D, G, J). Our data suggests that under KD feeding glycogen stores might be reduced due to low carbohydrate intake while increased ketone levels are the primary energy source [45], thereby decreasing fasting blood glucose levels.
Figure 2.

Three days of KD aggravates diet-induced glucose intolerance. Mice were fed a chow (CD), KD or HFD and fasted for 6 hrs then fasting blood glucose levels were measured, followed by glucose (2 g/kg body) injection. (A) Fasting blood glucose levels, (B) intraperitoneal (i.p.) glucose-tolerance test (i.p.GTT) and (C) AUC in mice fed a CD, KD or HFD for 3 days (CD n = 5; KD n = 8; HFD n = 6). (D) Fasting blood glucose levels, (E) i.p.GTT and (F) AUC in mice fed a CD, KD or HFD for 7 days (CD n = 8; KD n = 9; HFD n = 5). (G) Fasting blood glucose levels, (H) i.p.GTT and (I) AUC in mice fed a CD, KD or HFD for 5 weeks (CD n = 10; KD n = 10; HFD n = 10). (J) Fasting blood glucose levels, (K) i.p.GTT and (L) AUC in mice fed a CD, KD or HFD for 16 weeks (CD n = 10; KD n = 8; HFD n = 8). All values are expressed as mean ± SEM. ∗p < 0.05; ∗∗p < 0.01, ∗∗∗p < 0.001, by One-way ANOVA + Tukey's multiple comparison for A, C, E, G, AUC; 2-way ANOVA + Tukey's multiple comparison for B, D, F; H. ∗ = CD vs KD; # = KD vs HFD; $ = CD vs HFD.
Although KD-fed mice exhibited a healthy phenotype in the fasted state, short term KD-fed mice had a significantly impaired glucose tolerance compared to chow or HFD-fed mice (Figure 2B, C, E, F). These findings indicate that 3 or 7 days feeding of a KD can accelerate diet-induced glucose intolerance compared to HFD, although, plasma insulin levels were reduced in short-term KD-fed mice compared to HFD (Fig. S2N). Long-term (5 or 16 weeks) KD feeding resulted in glucose intolerance (Figure 2H, I, K, L), demonstrating that impaired glucose tolerance in KD-fed mice is progressive and comparable to a HFD feeding. Based on previous reports, we speculated that this might be the result of sustained elevated inflammation. Indeed, plasma levels of IFN-γ, IL-5, IL-6, TNF-α, and KC were markedly elevated in long term (16 weeks) HFD or KD-fed mice, while IL-1β, IL-2, and IL-12p70 were unchanged (Table S2). Importantly, only plasma IL-6 was significantly increased also in short-term KD-fed mice (3 days) (Table S3). Hence, we speculated that elevated plasma IL-6 levels might induce glucose intolerance in these animals. Of note, these inflammatory patterns were sustained in long-term KD feeding, which might lead to a further deterioration of glucose tolerance similar to that observed in HFD conditions (Table S2; Figure 2H).
To investigate whether systemic plasma IL-6 or liver IL-6 are correlated with the impaired glucose tolerance, IL-6 was measured in portal plasma, ingWAT, eWAT, mesenteric fat and liver after 3 days of chow, HFD or KD feeding. IL-6 secreted from visceral (mesenteric and omental) fat is drained by the portal vein into the liver, whereas IL-6 secreted by other fat tissues directly enters systemic circulation [14]. We could show that both systemic and portal IL-6 levels were increased in KD-fed mice compared to HFD (Figure 3A, B). Moreover, mesenteric and liver IL-6 proteins were significantly increased (Figure 3C, E). Protein levels of IL-6 were reduced in subcutaneous (ingWAT) (Figure 3D) in parallel with the weight reduction induced by KD (Figure 1B). Taken together, our data suggest that KD-induced impaired glucose tolerance might result from an elevated IL-6 secretion from mesenteric fat, which drains into liver, via the portal vein.
Figure 3.

Three days of KD increases IL-6 levels and impairs hepatic insulin signaling. Mice were fed a chow (CD), KD or HFD, fasted for 6 hrs and injected i.p. with glucose (2 g/kg body) 30 min before blood sampling. IL-6 levels were determined in (A) systemic plasma (n = 8 per group) (B) portal plasma (CD n = 4; KD n = 5; HFD n = 8) (C) mesenteric fat (CD n = 8; KD n = 8; HFD n = 6), (D) ingWAT (n = 8 per group) and (E) Liver (CD n = 6; KD n = 8; HFD n = 8). (F–G) RNA sequencing (RNA-seq) was performed on mice liver (n = 5 per group) and generate a heat map of differentially expressed genes at threshold of p <0.01, FDR <0.032, log2 ratio > 0.5 and fold change of log2 ratio >0.5. Data are presented as the regularized (r) log of the counts. (H) Upregulated gene in KD compared to CD-fed mice. (I) Validation of JNK phosphorylation in liver by western blot analysis (n = 4 per group) and protein quantification from glucose injected mice (n = 4 per group). For A-E and I, values are expressed as mean ± SEM. ∗(p < 0.05), ∗∗(P < 0.01), ∗∗∗(p < 0.001), #(p < 0.01), ## (p < 0.01), ###(P < 0.001), by One-way ANOVA for A-E and AUC. ∗ = CD vs KD; # = KD vs HFD.
3.3. KD feeding impairs insulin signaling pathways
To explore the mechanisms underlying KD-induced hepatic insulin resistance and steatosis, we performed RNA-sequencing (RNA-seq) of RNA isolated from the livers of mice fed a chow, HFD or KD for 3 days. We identified 408, 258 and 125 differential expressed genes (>2-fold log change) in KD vs chow, KD vs HFD and HFD vs chow respectively (Figure 3F, G, S3A–E, GE: GSE218025). Next, we subjected these significantly differentially expressed genes to a pathway enrichment analysis. The data demonstrated that regulated genes were enriched in fatty acid oxidation, tricarboxylic acid cycle, PPAR and insulin signaling pathways in KD compared to chow or HFD feeding (Figure 3G, S3C). A closer analysis of the genes enriched in the insulin signaling pathway revealed 32 differentially expressed genes candidates related to hepatic insulin resistance and steatosis, such as Jun, Sorbs1, Map3k5, Pik3c2a, Flot2, Mapk4, Enpp1, Foxo1, Prkcz and Sgk3, which were induced, while Igf1r, Mtor, Gys2 and Ppp1cc were downregulated in KD compared to chow feeding (Figure 3H, S3F).
To investigate the involvement of insulin signaling in KD-induced hepatic insulin resistance and MAFLD, the activation of JNK and insulin receptor β (IRβ) was analyzed in liver in the absence or presence of glucose to mimic the conditions under which glucose intolerance was observed in KD fed animals. Increased inhibitory Ser/Thr phosphorylation of IR, occurs in response to inflammatory cytokines, such as JNK and MAPK [46]. Western blot analysis showed an upregulation of JNK phosphorylation in KD and HFD (Figure 3I, S3D). However, the activation of JNK was more pronounced in KD compared to HFD. Following immunoprecipitation of the IRβ from liver lysates of chow, HFD or KD-fed mice for 3 days, we observed decreased tyrosine IRβ (Tyr1162/1163) phosphorylation, whereas IRβ phosphoserine phosphorylation was upregulated in KD compared to chow (Figure 4A). Furthermore, we observed a reduction of AKT phosphorylation accompanied by a decreased activation of p-GSK3αβ and an upregulation of G6P and PEPCK expression in KD compared to chow or HFD-fed mice (Figure 4B–D, S3G, S4B–C), demonstrating an increased propensity for hepatic gluconeogenesis.
Figure 4.

Three days of KD impairs hepatic insulin signaling. Mice were fed a chow (CD), KD or HFD, fasted for 6 h and injected i.p. with or without glucose (2 g/kg body) 30 min before blood sampling. (A) Equal amounts of liver proteins were immunoprecipitated with an anti-insulin receptor β (IRβ) antibody, and immunoblotted either with an anti-phosphotyrosine IRβ antibody (p-IRβ Tyr1162/1163), or with an anti-phosphoserine antibody (p-IRβ Ser). Membranes were stripped and reblotted with anti-IRβ (n = 4 per group) and protein quantification from glucose injected mice (n = 4 per group). (B) Representative western blots analysis of p-AKT protein expression and protein quantification from glucose injected mice (n = 8 per group). (G) protein quantification levels of p-GSK3αβ from glucose injected mice (n = 8 per group). (H) G6P and PEPCK protein expression and quantification levels (n = 4 per group) and protein quantification from glucose injected mice (n = 4 per group). Values are expressed as mean ± SEM. ∗(P < 0.05), ∗∗(P < 0.01), ∗∗∗(P < 0.001), #(P < 0.05), ##(P < 0.01), &&(P < 0.01), by One-way ANOVA + Tukey's multiple comparison. ∗ = KD vs CD; # = KD vs HFD, & = HFD vs CD.
Altogether, our data suggest that KD enhances IL-6 release from mesenteric fat, thereby, activating the inflammatory mechanisms which in turn might inhibit insulin signaling by reducing the activation of p-IRβTyr and p-AKT.
3.4. Pharmacological inhibition of IL-6 and JNK reverse KD-induced steatosis
KD might induce glucose intolerance and hepatic steatosis via IL-6 and JNK signaling pathways, thus, to assess whether IL-6 was involved in the development of KD-induced MAFLD, neutralizing IL-6 antibodies were used. Given the suggested role of liver JNK activation in the pathogenesis of MAFLD, we also evaluated the effects of JNK inhibition. C57BL/6J mice fed a chow, HFD or KD for 3 days were treated with or without IL-6 antibodies, or JNK inhibitor once per day. Importantly, 3 days of IL-6 neutralization or JNK inhibition rescued mice from KD-induced hepatic steatosis and hepatic inflammations (Figure 5A–C, S5A–C). Furthermore, 3 days of IL-6 neutralization or JNK inhibition significantly decreased liver cholesterol, IL-6 levels in systemic plasma, portal plasma, mesenteric fat, and liver (Figure 5D–H, S5D–H). Also, glucose tolerance was significantly improved in KD-fed mice upon IL-6 neutralization compared to control immunoglobulin (Ig)G-treated KD-fed mice (Figure 5I). These findings indicate that pharmacological neutralization of IL-6 reversed KD-induced glucose intolerance and improved hepatic insulin resistance. In line with results obtained from IL-6 neutralization, JNK inhibition also significantly improved glucose intolerance in KD-fed mice compared to control KD-fed mice (Fig. S5I). Mechanistically, 3 days of IL-6 neutralization or JNK inhibition led to a significant reduction of p-JNK and p-IRβ Ser and an upregulation of p-IRβ Tyr and p-AKT levels (Figure 6A–C, S6A–C). These data indicate that IL-6 neutralization or JNK inhibition can rescue the KD-induced hepatic insulin resistance and steatosis and demonstrate that KD-induced MAFLD is induced at least partially via the activation of IL-6-JNK signaling.
Figure 5.

Neutralization of IL-6 reverses KD-induced glucose intolerance and steatosis. Mice were fed a chow (CD), KD or HFD and treated with or without IL-6 antibodies once per day for 3 days and fasted for 6 hrs and injected i.p. with glucose (2 g/kg body) 30 min before sampling. (A) Representative images of liver sections stained with H&E or oil red O. Scale bar represents 100 μm. Grades of histopathological MAFLD: (B) steatosis grade, (C) hepatic inflammation. (D) cholesterol levels were determined in liver. IL-6 levels in (E) systemic plasma (F) portal plasma (G) mesenteric fat, and (H) Liver. n = 4 per group. (I) i.p.GTT and AUC in mice (n = 4–5 per group). All values are expressed as mean ± SEM. ∗(p < 0.05), ∗∗(p < 0.01), ∗∗∗(p < 0.001), #(p < 0.05), ##(p < 0.01), &&&(p < 0.001), $$$(p < 0.001), by One-way ANOVA for B–H and AUC. 2-way ANOVA + Tukey's multiple comparison for I. (For interpretation of the references to color in this figure legend, the reader is referred to the Web version of this article.)
Figure 6.

IL6 neutralization enhances insulin signaling pathways in KD-fed mice. Mice were fed a chow (CD), KD or HFD and treated with or without IL-6 antibodies once per day for 3 days and fasted for 6 hrs and injected i.p. with glucose (2 g/kg body) 30 min before sampling. (A) Representative western blots analysis of JNK phosphorylation in liver (n = 3–4 per group). (B) Immunoprecipitated insulin receptor β (IRβ) was immunoblotted either with an anti-phosphotyrosine IRβ antibody (p-IRβ Tyr1162/1163), or with an anti-phosphoserine antibody (p-IRβ Ser). Membranes were stripped and reblotted with anti-IRβ (n = 4 per group). (C) Representative western blots analysis of p-AKT protein expression (n = 3–4 per group). All values are expressed as mean ± SEM. ∗(p < 0.05), ∗∗(p < 0.01), ∗∗∗(p < 0.001), by One-way ANOVA.
3.5. KD-fed mice develop NASH and fibrosis
To investigate the metabolic relevance of KD in NASH development, we kept chow, HFD or KD-fed mice at thermoneutrality for 14 weeks (Figure 7A) as it is well known that thermoneutrality increases the proinflammatory immune response and exacerbates HFD-induced NASH in mice [47]. KD-fed mice showed a reduced body weight gain compared to chow or HFD-fed mice under thermoneutrality (Figure 7B). As expected, HFD-fed mice showed a significantly increased body weight gain, fat mass and liver weight (Figure 7B–D). We observed a similar fat tissue mass between chow and KD-fed mice (Figure 7B), whereas KD-fed mice showed an increased liver weight compared to control mice (Figure 7D). Importantly, histological examination of liver sections demonstrated the development of severe steatosis with significantly increased hepatic inflammation and hepatocyte ballooning in KD-fed mice (Figure 7E–H). Furthermore, histological analysis of masson's trichrome stained liver sections and its grading by pathologist demonstrated significant fibrosis in KD-fed mice, consistent with an increased NASH grading and NAFLD activity scores (Figure 7I–K). Supporting these findings, plasma aspartate aminotransferase (AST) and alanine aminotransferase (ALT) levels were significantly increased in KD-fed mice (Figure 7L–M), confirming the presence of advanced fibrosis. Immunohistochemical analysis also revealed activation of caspase3 in hepatocytes (Figure 7E), indicating the presence of apoptotic hepatocytes in KD-fed mice. Altogether, these data indicate that KD-induced MAFLD and aggravated the progression of NASH to fibrosis.
Figure 7.

KD induces liver fibrosis, NASH and NAFLD. Mice were fed a chow (CD), KD or HFD for 14 weeks at thermoneutrality and fasted 6 hrs and injected with glucose (2 g/kg body) 30 min before sampling. (A) Experimental scheme. (B) Body weight (n = 8 per group). (C–D) fat and liver mass. (E) Representative images of liver sections stained with H&E, Gom and mass (for fibrosis) and cleaved caspase 3. Scale bar represents 100 μm. Grades of histopathological NASH: (F) steatosis grade, (G) lobular inflammation, (H) hepatocyte ballooning (I) fibrosis scores, (J) NASH grade and (K) NAFLD score. (L) plasma alanine aminotransferase (ALT), (M) plasma alanine aminotransferase (AST), n = 8 per group. Values are presented as mean ± SEM. ∗(p < 0.05), ∗∗(p < 0.01), ∗∗∗(p < 0.001), ###(p < 0.001), &&&(p < 0.001), by 2-way ANOVA + Tukey's multiple comparison for (B-C); and one-way ANOVA for (D, F-M).
To determine the involvement of IL-6-JNK signaling pathways in the development of NASH, mice were fed a chow, HFD or KD for 14 weeks under thermoneutrality (Figure 8A). The expression of liver IL-6 mRNA was significantly elevated in both KD and HFD-fed mice (Figure 8F). We observed significantly increased liver cholesterol levels and elevated IL-6 protein levels in visceral fat and liver in KD compared to HFD under thermoneutrality (Figure 8B–D). These data suggest that elevated levels of cholesterol and inflammation might facilitate the formation of NASH in KD compared to HFD. Furthermore, p-JNK activation was significantly upregulated in KD fed mice (Figure 8E). Notably, p-AKT levels were reduced only in KD compared to HFD fed mice (Figure 8E), indicating that IL-6-JNK signaling might impair insulin signaling and thereby inducing NASH in response to a KD at thermoneutrality.
Figure 8.

KD induces liver fibrosis, NASH and NAFLD. Mice were fed a chow (CD), KD or HFD for 14 weeks at thermoneutrality and fasted 6 hrs and injected with glucose (2 g/kg body) 30 min before sampling. (A) Experimental scheme, (B) cholesterol levels were determined in liver. IL-6 levels in (C) epididymal fat (eWAT) and (D) Liver. n = 8 per group. (E) Representative western blots analyses of p-JNK and p-AKT protein expression (n = 4 per group). (F) Relative mRNA expression of IL-6 in liver (CD n = 8; KD n = 7; HFD n = 6). Values are presented as mean ± SEM. ∗(p < 0.05), ∗∗(p < 0.01), ∗∗∗(p < 0.001), by one-way ANOVA.
4. Discussion
The mechanism underlying the pathogenesis of NASH is not completely defined due to the lack of animal models that closely recapitulates human NASH [47], linked to a disturbance of metabolic control while mimicking human thermoneutral living conditions. In this context our mouse model possibly provides a useful tool for NASH research in rodents, as it is a model of metabolism-associated steatosis with advanced hepatic injury, inflammation, and fibrosis. Nevertheless, the lack of obesity which is normally associated with NASH development in humans needs to be taken into consideration. Previous studies reported that KD regardless of the proportions and sources of fat impairs glucose and lipid metabolism [24] and subsequently induces hepatic steatosis [35,36] in rodents, with a low degree of inflammation, independent of NASH and fibrosis [37]. Our studies show that combining KD with thermoneutrality aggravated the NASH phenotype. This notion is supported by the fact that KD significantly increased liver cholesterol, hepatocyte injury and inflammation, followed by increased liver fibrosis, and elevated NASH score, potentially via upregulation of cholesterol, and the IL-6 and JNK signaling pathways.
Thermoneutrality, increases proinflammatory immune response and exacerbate diet-induced NASH pathogenesis [47]. In HFD fed-mice chlorpyrifos impairs BAT mitochondrial function and promotes obesity, NAFLD and insulin resistance at thermoneutrality [48]. This is associated with a reduction in diet-induced thermogenesis and activation of BAT [48]. Our work demonstrated that KD feeding at ambient temperature also led to a stronger deterioration of glucose tolerance due to hepatic insulin resistance and increased glucose output by hyperinsulinemic–euglycemic clamp [43]. Diacylglycerol and ceramide have been reported to induce hepatic insulin resistance independent of hepatic TG levels [49] through activation of protein kinase C epsilon (PKCε) in the liver [50,51]. However, genetic PKCε knockout models demonstrated that PKCε does not act directly on the liver to induce hepatic insulin resistance, but instead functions in the adipose tissue [52]. Moreover, we demonstrate that KD does not activate PKCε in the liver (data not shown). We rather identify a decreased tyrosine IRβ (Tyr1162/1163), and an enhanced phosphoserine (p-IRβ Ser) phosphorylation in KD fed mice compared with chow or HFD.
Increased hepatocyte cholesterol upregulates TAZ and promotes fibrosis and NASH in mice and humans [53]. Another study showed that high dietary cholesterol led to the sequential progression of steatosis, NASH, fibrosis, and HCC in mice [[54], [55], [56]], concomitant with insulin resistance due to gut microbiota dysbiosis [56]. Recently, in a high-fat/high-cholesterol diet-induced NASH model, it was shown that ganoderic acid decreased the expression of p-JNK, thereby inhibiting the expression of IL-6 and TNF-α and increasing p-AKT to ameliorate NASH [57]. Our data demonstrates that KD induces hepatic steatosis as early as 3 days. This process can be observed in HFD conditions as well, but the timeline is substantially expanded. The elevation of inflammatory cytokines (TNFα, IL-1β, IL-6) causes hepatic inflammation and injury, which in turn induce liver fibrosis, possibly as the result of a sustained wound-healing processes [58]. Thus, hepatic insulin resistance is associated with MAFLD and inflammation, since increased liver IL-6 expression in MAFLD results in hepatic insulin resistance [59].
In KD-fed mice, we found deteriorated glucose tolerance which was more pronounced in KD compared to HFD feeding. Similarly, we observed upregulation of portal, visceral, and liver IL-6 protein levels in KD-fed mice, which was paralleled by elevated hepatocytes inflammation, injury, and steatosis, indicating that portal, liver, and visceral WAT IL-6 might be critically involved in the observed hepatic insulin resistance and NASH development in KD-fed mice. In agreement, IL-6 expression was increased in NASH patients liver and positively correlated with the degree of inflammation and stage of fibrosis [60]. In healthy lean humans a KD indeed significantly increased IL-6 levels compared to a normal diet [61], in line with our findings of elevated IL-6 levels in lean mice in response to a KD feeding. In addition, plasma markers associated with dyslipidemia and inflammation (cholesterol, triglycerides, monocyte chemotactic protein-1, IL-1β, and IL-6) were increased in KD-fed lean mice [35], which might play a role in the development of hepatic insulin resistance and NASH formation. We propose that additionally long-term KD feeding might create a complex network of yet unidentified pathogenetic mechanisms independent of inflammation. For instance, bile acid toxicity, macrophage and mitochondria dysfunction, and hepatic stellate cell activation as well as changes of the gut microbiota composition might contribute to long term KD-induced insulin resistance and MAFLD independent of IL-6.
It has been reported that IL-6 neutralizations in HFD enhances insulin sensitivity and prevents liver injury [59]. In this study, 3 days of IL-6 neutralization or JNK inhibitions could rescue KD-induced glucose intolerance, hepatic inflammation, and steatosis, and restore insulin sensitivity to normal levels. This notion is supported by significantly decreased liver cholesterol and suppressed IL-6 levels in systemic plasma, portal plasma, mesenteric fat, and liver in KD compared to HFD up on IL-6 neutralization or JNK inhibitions. Furthermore, IL-6 neutralization or JNK inhibition significantly reduced p-JNK and p-IRβ Ser and upregulated p-IRβ Tyr and p-AKT levels. These data provide evidence that KD induces IL-6 production and thereby activates JNK, which in turn leads to a repressed insulin signaling, which is involved in the pathogenesis of MAFLD.
Some clinical studies reported antisteatotic effects of KD with decreased TG levels in MAFLD patients, improved blood glucose, serum lipid and weight loss in obese and diabetic subjects [25,26,32]. Rosenbaum et al. [34] reported that 4 weeks of KD interventions led to stable IL-6 levels in obese subjects. However, it should be noted that IL-6 levels are tightly linked to the degree of obesity [62], which thus confounds the above findings as subjects on a KD normally loose a significant amount of weight [34]. Similarly, it was reported that two weeks of dietary carbohydrate and caloric restriction reduced hepatic TG in NAFLD patients [63] and 6 days of KD could decrease hepatic insulin resistance and TG in MAFLD patients [25]. Moreover, 12 or 24 weeks of KD resulted in significant weight loss and decreased appetite in obese subjects [64,65]. As mentioned above this was accompanied by a substantial weight loss and therefore it remains unclear whether the beneficial effects of the KD are due primarily to weight loss or due to the KD, itself.
In diabetic patients KD led to improved HbA1c and fasting blood glucose compared to low-fat diet [[66], [67], [68]]. These data suggest that KD might leads to depletion of glycogen storage due to low carbohydrate intake and increased ketone levels [45], thereby, decreasing fasting blood glucose levels. Previously we reported that KD increased energy intake, while water intake was not changed [43]. Thus, the reduced fasting blood glucose levels we observe might be attributed to glycogen depletion, as evidenced by significantly decreased glycogen content in the muscle and liver in KD fed-mice [30]. Contrary to the health benefit of KD in overweight subjects, 3 days of KD increased postprandial plasma glucose in lean healthy men [33] and 4 weeks of KD intervention increased cholesterol and inflammatory markers in obese subjects, regardless of body weight loss [34]. In a case study, a 57-year old obese woman after a 4-month KD intervention developed steatosis, increased markers of fibrosis including AST and ALT, coupled to only a modest weight loss [69]. Supporting this finding, children with epilepsy who consumed a KD for 1 year developed steatosis and liver injury [70]. In mice, recently published studies reported that KD significant increases TG content in the heart and liver [30]. These divergent findings illustrate the controversy on the health benefits of KD and indicate that long-term human studies with an accurate diagnosis of liver steatosis and fibrosis coupled to a careful assessment of weight change as a confounding factor are required to form a conclusion about the impact of KD on MAFLD and NASH in humans.
In summary, our data indicate that KD feeding leads to an accelerated glucose intolerance due to hepatic insulin resistance and increased hepatic gluconeogenesis in mice. Furthermore, KD induces NASH and fibrosis possibly through activation of the IL-6-JNK signaling pathway. Lastly, KD in combination with thermoneutrality might be a useful NASH rodent model to study the mechanisms of the NASH pathogenesis.
Authors contributions
FL, TDC and CW wrote the manuscript. TDC and CW jointly supervised this work. FL, MRB, TDC and CW designed experiments and interoperated the data. FL, MRB and AK, TDC performed most of the experiments. SM interpreted the data and revised the manuscript. WS helped with the analysis of RNA sequencing data. MH, GL and JPK preformed the lipidomic analysis and interpreted the data.
Financial support
This work was supported by the Swiss National Science Foundation (CW) and a Swiss National Science Foundation Postdoc.Mobility Grant 183899 (JPK).
Footnotes
Supplementary data to this article can be found online at https://doi.org/10.1016/j.molmet.2023.101675.
Contributor Information
Christian Wolfrum, Email: christian-wolfrum@ethz.ch.
Tenagne D. Challa, Email: tenagne.challa@hest.ethz.ch.
Conflict of interest
The authors declare no competing interests.
Appendix A. Supplementary data
The following are the Supplementary data to this article:
Data availability
The data that has been used is confidential.
References
- 1.Gruben N., Shiri-Sverdlov R., Koonen D.P.Y., Hofker M.H. Nonalcoholic fatty liver disease: a main driver of insulin resistance or a dangerous liaison? Biochim Biophys Acta. 2014;1842(11):2329–2343. doi: 10.1016/j.bbadis.2014.08.004. [DOI] [PubMed] [Google Scholar]
- 2.Duwaerts C.C., Maher J.J. Mechanisms of liver injury in non-alcoholic steatohepatitis. Curr Hepatol Rep. 2014;13(2):119–129. doi: 10.1007/s11901-014-0224-8. [DOI] [PMC free article] [PubMed] [Google Scholar]
- 3.Younossi Z.M. Non-alcoholic fatty liver disease – a global public health perspective. J Hepatol. 2019;70(3):531–544. doi: 10.1016/j.jhep.2018.10.033. [DOI] [PubMed] [Google Scholar]
- 4.Byrne C.D., Targher G. NAFLD: a multisystem disease. J Hepatol. 2015;62(1 Suppl):S47–S64. doi: 10.1016/j.jhep.2014.12.012. [DOI] [PubMed] [Google Scholar]
- 5.Phipps M., Wattacheril J. Non-alcoholic fatty liver disease (NAFLD) in non-obese individuals. Frontline Gastroenterol. 2019;11(6):478–483. doi: 10.1136/flgastro-2018-101119. [DOI] [PMC free article] [PubMed] [Google Scholar]
- 6.Kawano Y., Cohen D.E. Mechanisms of hepatic triglyceride accumulation in non-alcoholic fatty liver disease. J Gastroenterol. 2013;48(4):434–441. doi: 10.1007/s00535-013-0758-5. [DOI] [PMC free article] [PubMed] [Google Scholar]
- 7.Hur J.H., Park S.-Y., Dall'Armi C., Lee J.S., Di Paolo G., Lee H.-Y., et al. Phospholipase D1 deficiency in mice causes nonalcoholic fatty liver disease via an autophagy defect. Sci Rep. 2016;6 doi: 10.1038/srep39170. [DOI] [PMC free article] [PubMed] [Google Scholar]
- 8.Kohjima M., Enjoji M., Higuchi N., Kato M., Kotoh K., Yoshimoto T., et al. Re-evaluation of fatty acid metabolism-related gene expression in nonalcoholic fatty liver disease. Int J Mol Med. 2007;20(3):351–358. [PubMed] [Google Scholar]
- 9.Benhamed F., Denechaud P.-D., Lemoine M., Robichon C., Moldes M., Bertrand-Michel J., et al. The lipogenic transcription factor ChREBP dissociates hepatic steatosis from insulin resistance in mice and humans. J Clin Investig. 2012;122(6):2176–2194. doi: 10.1172/JCI41636. [DOI] [PMC free article] [PubMed] [Google Scholar]
- 10.Bhala N., Younes R., Bugianesi E. Epidemiology and natural history of patients with NAFLD. Curr Pharm Des. 2013;19(29):5169–5176. doi: 10.2174/13816128113199990336. [DOI] [PubMed] [Google Scholar]
- 11.Milic S., Mikolasevic I., Krznaric-Zrnic I., Stanic M., Poropat G., Stimac D., et al. Nonalcoholic steatohepatitis: emerging targeted therapies to optimize treatment options. Drug Des Dev Ther. 2015;9:4835–4845. doi: 10.2147/DDDT.S64877. [DOI] [PMC free article] [PubMed] [Google Scholar]
- 12.Chalasani N., Younossi Z., Lavine J.E., Diehl A.M., Brunt E.M., Cusi K., et al. The diagnosis and management of non-alcoholic fatty liver disease: practice Guideline by the American Association for the Study of Liver Diseases, American College of Gastroenterology, and the American Gastroenterological Association. Hepatology (Baltimore, Md.) 2012;55(6):2005–2023. doi: 10.1002/hep.25762. [DOI] [PubMed] [Google Scholar]
- 13.Wueest S., Item F., Lucchini F.C., Challa T.D., Müller W., Blüher M., et al. Mesenteric fat lipolysis mediates obesity-associated hepatic steatosis and insulin resistance. Diabetes. 2016;65(1):140–148. doi: 10.2337/db15-0941. [DOI] [PubMed] [Google Scholar]
- 14.Wueest S., Konrad D. The controversial role of IL-6 in adipose tissue on obesity-induced dysregulation of glucose metabolism. Am J Physiol Endocrinol Metab. 2020;319(3):E607–E613. doi: 10.1152/ajpendo.00306.2020. [DOI] [PubMed] [Google Scholar]
- 15.Cai D., Yuan M., Frantz D.F., Melendez P.A., Hansen L., Lee J., et al. Local and systemic insulin resistance resulting from hepatic activation of IKK-beta and NF-kappaB. Nat Med. 2005;11(2):183–190. doi: 10.1038/nm1166. [DOI] [PMC free article] [PubMed] [Google Scholar]
- 16.Makki K., Froguel P., Wolowczuk I. Adipose tissue in obesity-related inflammation and insulin resistance: cells, cytokines, and chemokines. ISRN Inflamm. 2013;2013 doi: 10.1155/2013/139239. [DOI] [PMC free article] [PubMed] [Google Scholar]
- 17.Yung J.H.M., Giacca A. Role of c-Jun N-terminal Kinase (JNK) in obesity and type 2 diabetes. Cells. 2020;9(3):E706. doi: 10.3390/cells9030706. [DOI] [PMC free article] [PubMed] [Google Scholar]
- 18.Olefsky J.M., Glass C.K. Macrophages, inflammation, and insulin resistance. Annu Rev Physiol. 2010;72:219–246. doi: 10.1146/annurev-physiol-021909-135846. [DOI] [PubMed] [Google Scholar]
- 19.Czaja M.J. JNK regulation of hepatic manifestations of the metabolic syndrome. Trends Endocrinol Metab. 2010;21(12):707–713. doi: 10.1016/j.tem.2010.08.010. [DOI] [PMC free article] [PubMed] [Google Scholar]
- 20.Sabio G., Das M., Mora A., Zhang Z., Jun J.Y., Ko H.J., et al. A stress signaling pathway in adipose tissue regulates hepatic insulin resistance. Science (New York, N.Y.) 2008;322(5907):1539–1543. doi: 10.1126/science.1160794. [DOI] [PMC free article] [PubMed] [Google Scholar]
- 21.Rinella M.E., Green R.M. The methionine-choline deficient dietary model of steatohepatitis does not exhibit insulin resistance. J Hepatol. 2004;40(1):47–51. doi: 10.1016/j.jhep.2003.09.020. [DOI] [PubMed] [Google Scholar]
- 22.Neuschwander-Tetri B.A. Non-alcoholic fatty liver disease. BMC Med. 2017;15(1):45. doi: 10.1186/s12916-017-0806-8. [DOI] [PMC free article] [PubMed] [Google Scholar]
- 23.D'Andrea Meira I., Romão T.T., Pires do Prado H.J., Krüger L.T., Pires M.E.P., da Conceição P.O. Ketogenic diet and epilepsy: what we know so far. Front Neurosci. 2019;13 doi: 10.3389/fnins.2019.00005. [DOI] [PMC free article] [PubMed] [Google Scholar]
- 24.Li Y., Yang X., Zhang J., Jiang T., Zhang Z., Wang Z., et al. Ketogenic diets induced glucose intolerance and lipid accumulation in mice with alterations in gut microbiota and metabolites. mBio. 2021;12(2):e03601–e03620. doi: 10.1128/mBio.03601-20. [DOI] [PMC free article] [PubMed] [Google Scholar]
- 25.Luukkonen P.K., Dufour S., Lyu K., Zhang X.-M., Hakkarainen A., Lehtimäki T.E., et al. Effect of a ketogenic diet on hepatic steatosis and hepatic mitochondrial metabolism in nonalcoholic fatty liver disease. Proc Natl Acad Sci USA. 2020;117(13):7347–7354. doi: 10.1073/pnas.1922344117. [DOI] [PMC free article] [PubMed] [Google Scholar]
- 26.Dashti H.M., Mathew T.C., Hussein T., Asfar S.K., Behbahani A., Khoursheed M.A., et al. Long-term effects of a ketogenic diet in obese patients. Exp Clin Cardiol. 2004;9(3):200–205. [PMC free article] [PubMed] [Google Scholar]
- 27.Kalafut K.C., Mitchell S.J., MacArthur M.R., Mitchell J.R. Short-term ketogenic diet induces a molecular response that is distinct from dietary protein restriction. Front Nutr. 2022;9 doi: 10.3389/fnut.2022.839341. [DOI] [PMC free article] [PubMed] [Google Scholar]
- 28.Pinckaers P.J.M., Churchward-Venne T.A., Bailey D., van Loon L.J.C. Ketone bodies and exercise performance: the next magic bullet or merely hype? Sports Med. 2017;47(3):383–391. doi: 10.1007/s40279-016-0577-y. [DOI] [PMC free article] [PubMed] [Google Scholar]
- 29.Ródenas-González F., Blanco-Gandía M.C., Miñarro J., Rodríguez-Arias M. Cognitive profile of male mice exposed to a ketogenic diet. Physiol Behav. 2022;254 doi: 10.1016/j.physbeh.2022.113883. [DOI] [PubMed] [Google Scholar]
- 30.Holcomb L.E., O'Neill C.C., DeWitt E.A., Kolwicz S.C. The effects of fasting or ketogenic diet on endurance exercise performance and metabolism in female mice. Metabolites. 2021;11(6):397. doi: 10.3390/metabo11060397. [DOI] [PMC free article] [PubMed] [Google Scholar]
- 31.Stemmer K., Zani F., Habegger K.M., Neff C., Kotzbeck P., Bauer M., et al. FGF21 is not required for glucose homeostasis, ketosis or tumour suppression associated with ketogenic diets in mice. Diabetologia. 2015;58(10):2414–2423. doi: 10.1007/s00125-015-3668-7. [DOI] [PMC free article] [PubMed] [Google Scholar]
- 32.Dashti H.M., Mathew T.C., Khadada M., Al-Mousawi M., Talib H., Asfar S.K., et al. Beneficial effects of ketogenic diet in obese diabetic subjects. Mol Cell Biochem. 2007;302(1–2):249–256. doi: 10.1007/s11010-007-9448-z. [DOI] [PubMed] [Google Scholar]
- 33.Numao S., Kawano H., Endo N., Yamada Y., Konishi M., Takahashi M., et al. Short-term low carbohydrate/high-fat diet intake increases postprandial plasma glucose and glucagon-like peptide-1 levels during an oral glucose tolerance test in healthy men. Eur J Clin Nutr. 2012;66(8):926–931. doi: 10.1038/ejcn.2012.58. [DOI] [PubMed] [Google Scholar]
- 34.Rosenbaum M., Hall K.D., Guo J., Ravussin E., Mayer L.S., Reitman M.L., et al. Glucose and lipid homeostasis and inflammation in humans following an isocaloric ketogenic diet. Obesity. 2019;27(6):971–981. doi: 10.1002/oby.22468. [DOI] [PMC free article] [PubMed] [Google Scholar]
- 35.Ellenbroek J.H., van Dijck L., Töns H.A., Rabelink T.J., Carlotti F., Ballieux B.E.P.B., et al. Long-term ketogenic diet causes glucose intolerance and reduced β- and α-cell mass but no weight loss in mice. Am J Physiol Endocrinol Metab. 2014;306(5):E552–E558. doi: 10.1152/ajpendo.00453.2013. [DOI] [PubMed] [Google Scholar]
- 36.Garbow J.R., Doherty J.M., Schugar R.C., Travers S., Weber M.L., Wentz A.E., et al. Hepatic steatosis, inflammation, and ER stress in mice maintained long term on a very low-carbohydrate ketogenic diet. Am J Physiol Gastrointest Liver Physiol. 2011;300(6):G956–G967. doi: 10.1152/ajpgi.00539.2010. [DOI] [PMC free article] [PubMed] [Google Scholar]
- 37.Jornayvaz F.R., Jurczak M.J., Lee H.-Y., Birkenfeld A.L., Frederick D.W., Zhang D., et al. A high-fat, ketogenic diet causes hepatic insulin resistance in mice, despite increasing energy expenditure and preventing weight gain. Am J Physiol Endocrinol Metab. 2010;299(5):E808–E815. doi: 10.1152/ajpendo.00361.2010. [DOI] [PMC free article] [PubMed] [Google Scholar]
- 38.Höring M., Krautbauer S., Hiltl L., Babl V., Sigruener A., Burkhardt R., et al. Accurate lipid quantification of tissue homogenates requires suitable sample concentration, solvent composition, and homogenization procedure-a case study in murine liver. Metabolites. 2021;11(6):365. doi: 10.3390/metabo11060365. [DOI] [PMC free article] [PubMed] [Google Scholar]
- 39.Bligh E.G., Dyer W.J. A rapid method of total lipid extraction and purification. Can J Biochem Physiol. 1959;37(8):911–917. doi: 10.1139/o59-099. [DOI] [PubMed] [Google Scholar]
- 40.Kleiner D.E., Brunt E.M., Van Natta M., Behling C., Contos M.J., Cummings O.W., et al. Design and validation of a histological scoring system for nonalcoholic fatty liver disease. Hepatology (Baltimore, Md.) 2005;41(6):1313–1321. doi: 10.1002/hep.20701. [DOI] [PubMed] [Google Scholar]
- 41.Clapper J.R., Hendricks M.D., Gu G., Wittmer C., Dolman C.S., Herich J., et al. Diet-induced mouse model of fatty liver disease and nonalcoholic steatohepatitis reflecting clinical disease progression and methods of assessment. Am J Physiol Gastrointest Liver Physiol. 2013;305(7):G483–G495. doi: 10.1152/ajpgi.00079.2013. [DOI] [PubMed] [Google Scholar]
- 42.Liang W., Menke A.L., Driessen A., Koek G.H., Lindeman J.H., Stoop R., et al. Establishment of a general NAFLD scoring system for rodent models and comparison to human liver pathology. PLoS One. 2014;9(12) doi: 10.1371/journal.pone.0115922. [DOI] [PMC free article] [PubMed] [Google Scholar]
- 43.Grandl G., Straub L., Rudigier C., Arnold M., Wueest S., Konrad D., et al. Short-term feeding of a ketogenic diet induces more severe hepatic insulin resistance than an obesogenic high-fat diet. J Physiol. 2018;596(19):4597–4609. doi: 10.1113/JP275173. [DOI] [PMC free article] [PubMed] [Google Scholar]
- 44.Dowman J.K., Tomlinson J.W., Newsome P.N. Pathogenesis of non-alcoholic fatty liver disease. QJM. 2010;103(2):71–83. doi: 10.1093/qjmed/hcp158. [DOI] [PMC free article] [PubMed] [Google Scholar]
- 45.Caprio M., Infante M., Moriconi E., Armani A., Fabbri A., Mantovani G., et al. Very-low-calorie ketogenic diet (VLCKD) in the management of metabolic diseases: systematic review and consensus statement from the Italian Society of Endocrinology (SIE) J Endocrinol Invest. 2019;42(11):1365–1386. doi: 10.1007/s40618-019-01061-2. [DOI] [PubMed] [Google Scholar]
- 46.Boucher J., Kleinridders A., Kahn C.R. Insulin receptor signaling in normal and insulin-resistant states. Cold Spring Harbor Perspect Biol. 2014;6(1):a009191. doi: 10.1101/cshperspect.a009191. [DOI] [PMC free article] [PubMed] [Google Scholar]
- 47.Giles D.A., Moreno-Fernandez M.E., Stankiewicz T.E., Graspeuntner S., Cappelletti M., Wu D., et al. Thermoneutral housing exacerbates nonalcoholic fatty liver disease in mice and allows for sex-independent disease modeling. Nat Med. 2017;23(7):829–838. doi: 10.1038/nm.4346. [DOI] [PMC free article] [PubMed] [Google Scholar]
- 48.Wang B., Tsakiridis E.E., Zhang S., Llanos A., Desjardins E.M., Yabut J.M., et al. The pesticide chlorpyrifos promotes obesity by inhibiting diet-induced thermogenesis in brown adipose tissue. Nat Commun. 2021;12(1):5163. doi: 10.1038/s41467-021-25384-y. [DOI] [PMC free article] [PubMed] [Google Scholar]
- 49.Kantartzis K., Machicao F., Machann J., Schick F., Fritsche A., Häring H.-U., et al. The DGAT2 gene is a candidate for the dissociation between fatty liver and insulin resistance in humans. Clin Sci (Lond) 2009;116(6):531–537. doi: 10.1042/CS20080306. [DOI] [PubMed] [Google Scholar]
- 50.Shulman G.I. Ectopic fat in insulin resistance, dyslipidemia, and cardiometabolic disease. N Engl J Med. 2014;371(12):1131–1141. doi: 10.1056/NEJMra1011035. [DOI] [PubMed] [Google Scholar]
- 51.Schmitz-Peiffer C. The tail wagging the dog--regulation of lipid metabolism by protein kinase C. FEBS J. 2013;280(21):5371–5383. doi: 10.1111/febs.12285. [DOI] [PubMed] [Google Scholar]
- 52.Brandon A.E., Liao B.M., Diakanastasis B., Parker B.L., Raddatz K., McManus S.A., et al. Protein kinase C epsilon deletion in adipose tissue, but not in liver, improves glucose tolerance. Cell Metab. 2019;29(1):183–191.e7. doi: 10.1016/j.cmet.2018.09.013. [DOI] [PubMed] [Google Scholar]
- 53.Wang X., Cai B., Yang X., Sonubi O.O., Zheng Z., Ramakrishnan R., et al. Cholesterol stabilizes TAZ in hepatocytes to promote experimental non-alcoholic steatohepatitis. Cell Metab. 2020;31(5):969–986.e7. doi: 10.1016/j.cmet.2020.03.010. [DOI] [PMC free article] [PubMed] [Google Scholar]
- 54.Zheng S., Hoos L., Cook J., Tetzloff G., Davis H., van Heek M., et al. Ezetimibe improves high fat and cholesterol diet-induced non-alcoholic fatty liver disease in mice. Eur J Pharmacol. 2008;584(1):118–124. doi: 10.1016/j.ejphar.2008.01.045. [DOI] [PubMed] [Google Scholar]
- 55.Savard C., Tartaglione E.V., Kuver R., Haigh W.G., Farrell G.C., Subramanian S., et al. Synergistic interaction of dietary cholesterol and dietary fat in inducing experimental steatohepatitis. Hepatology (Baltimore, Md.) 2013;57(1):81–92. doi: 10.1002/hep.25789. [DOI] [PMC free article] [PubMed] [Google Scholar]
- 56.Zhang X., Coker O.O., Chu E.S., Fu K., Lau H.C.H., Wang Y.-X., et al. Dietary cholesterol drives fatty liver-associated liver cancer by modulating gut microbiota and metabolites. Gut. 2021;70(4):761–774. doi: 10.1136/gutjnl-2019-319664. [DOI] [PMC free article] [PubMed] [Google Scholar]
- 57.Zhu J., Ding J., Li S., Jin J. Ganoderic acid A ameliorates non-alcoholic streatohepatitis (NASH) induced by high-fat high-cholesterol diet in mice. Exp Ther Med. 2022;23(4):308. doi: 10.3892/etm.2022.11237. [DOI] [PMC free article] [PubMed] [Google Scholar]
- 58.Berres M.-L., Koenen R.R., Rueland A., Zaldivar M.M., Heinrichs D., Sahin H., et al. Antagonism of the chemokine Ccl5 ameliorates experimental liver fibrosis in mice. J Clin Investig. 2010;120(11):4129–4140. doi: 10.1172/JCI41732. [DOI] [PMC free article] [PubMed] [Google Scholar]
- 59.Wieckowska A., Papouchado B.G., Li Z., Lopez R., Zein N.N., Feldstein A.E. Increased hepatic and circulating interleukin-6 levels in human nonalcoholic steatohepatitis. Am J Gastroenterol. 2008;103(6):1372–1379. doi: 10.1111/j.1572-0241.2007.01774.x. [DOI] [PubMed] [Google Scholar]
- 60.Ye L., Zhao D., Xu Y., Lin J., Xu J., Wang K., et al. LncRNA-Gm9795 promotes inflammation in non-alcoholic steatohepatitis via NF-[Formula: see text]B/JNK pathway by endoplasmic reticulum stress. J Transl Med. 2021;19(1):101. doi: 10.1186/s12967-021-02769-7. [DOI] [PMC free article] [PubMed] [Google Scholar]
- 61.McKay A.K.A., Peeling P., Pyne D.B., Welvaert M., Tee N., Leckey J.J., et al. Chronic adherence to a ketogenic diet modifies iron metabolism in elite athletes. Med Sci Sports Exerc. 2019;51(3):548–555. doi: 10.1249/MSS.0000000000001816. [DOI] [PubMed] [Google Scholar]
- 62.Roytblat L., Rachinsky M., Fisher A., Greemberg L., Shapira Y., Douvdevani A., et al. Raised interleukin-6 levels in obese patients. Obes Res. 2000;8(9):673–675. doi: 10.1038/oby.2000.86. [DOI] [PubMed] [Google Scholar]
- 63.Browning J.D., Baker J.A., Rogers T., Davis J., Satapati S., Burgess S.C. Short-term weight loss and hepatic triglyceride reduction: evidence of a metabolic advantage with dietary carbohydrate restriction. Am J Clin Nutr. 2011;93(5):1048–1052. doi: 10.3945/ajcn.110.007674. [DOI] [PMC free article] [PubMed] [Google Scholar]
- 64.Vranceanu M., Pickering C., Filip L., Pralea I.E., Sundaram S., Al-Saleh A., et al. A comparison of a ketogenic diet with a LowGI/nutrigenetic diet over 6 months for weight loss and 18-month follow-up. BMC Nutr. 2020;6:53. doi: 10.1186/s40795-020-00370-7. [DOI] [PMC free article] [PubMed] [Google Scholar]
- 65.Mohorko N., Černelič-Bizjak M., Poklar-Vatovec T., Grom G., Kenig S., Petelin A., et al. Weight loss, improved physical performance, cognitive function, eating behavior, and metabolic profile in a 12-week ketogenic diet in obese adults. Nutr Res. 2019;62:64–77. doi: 10.1016/j.nutres.2018.11.007. [DOI] [PubMed] [Google Scholar]
- 66.Zhang X., Qin J., Zhao Y., Shi J., Lan R., Gan Y., et al. Long-term ketogenic diet contributes to glycemic control but promotes lipid accumulation and hepatic steatosis in type 2 diabetic mice. Nutr Res. 2016;36(4):349–358. doi: 10.1016/j.nutres.2015.12.002. [DOI] [PubMed] [Google Scholar]
- 67.Goday A., Bellido D., Sajoux I., Crujeiras A.B., Burguera B., García-Luna P.P., et al. Short-term safety, tolerability and efficacy of a very low-calorie-ketogenic diet interventional weight loss program versus hypocaloric diet in patients with type 2 diabetes mellitus. Nutr Diabetes. 2016;6(9) doi: 10.1038/nutd.2016.36. [DOI] [PMC free article] [PubMed] [Google Scholar]
- 68.Tay J., Luscombe-Marsh N.D., Thompson C.H., Noakes M., Buckley J.D., Wittert G.A., et al. Comparison of low- and high-carbohydrate diets for type 2 diabetes management: a randomized trial. Am J Clin Nutr. 2015;102(4):780–790. doi: 10.3945/ajcn.115.112581. [DOI] [PubMed] [Google Scholar]
- 69.Anekwe C.V., Chandrasekaran P., Stanford F.C. Ketogenic diet-induced elevated cholesterol, elevated liver enzymes and potential non-alcoholic fatty liver disease. Cureus. 2020;12(1) doi: 10.7759/cureus.6605. [DOI] [PMC free article] [PubMed] [Google Scholar]
- 70.Arslan N., Guzel O., Kose E., Yılmaz U., Kuyum P., Aksoy B., et al. Is ketogenic diet treatment hepatotoxic for children with intractable epilepsy? Seizure. 2016;43:32–38. doi: 10.1016/j.seizure.2016.10.024. [DOI] [PubMed] [Google Scholar]
Associated Data
This section collects any data citations, data availability statements, or supplementary materials included in this article.
Supplementary Materials
Data Availability Statement
The data that has been used is confidential.