Abstract
The development of economic and recyclable adsorbents for removing pollutants from contaminated water is gaining increasing attention. Agro residue or nature-based material sourced absorbents could revolutionize the future of wastewater treatment. Hence in this study, nanocellulose was synthesized from coconut husk fiber and immobilized onto chitosan to form hydrogel beads. The BET surface area and zeta potential of the adsorbent nanocrystalline cellulose–chitosan hydrogel (NCC–CH) bead was 25.77 m2 g−1 and +50.6 mV, respectively. The functional group analysis also confirmed that the adsorbent had functional groups appropriate for the adsorption of textile dyes. The adsorption performance of NCC–CH and also the influence of initial dye concentration, adsorbent dose, pH, and contact time was evaluated by batch adsorption studies with crystal violet (CV) and methylene blue (MB) dyes. The most favorable operational conditions achieved through I-optimal design in response surface methodology were 0.5 g NCC–CH, 1 h, 9 pH, and 60 mg L−1 for CV removal (94.75%) and 0.13 g NCC–CH, 1 h, 9 pH, and 30 mg L−1 for MB removal (95.88%). The polynomial quadratic model fits the experimental data with an R2 value of 0.99 and 0.98 for CV and MB removal, respectively. The optimum depiction of the isotherm data was obtained using the Freundlich model for MB adsorption and Freundlich and Langmuir model for CV adsorption. The Dubinin–Radushkevich (D–R) isotherm was also a good fit to the adsorption of CV and MB dye, suggesting the physisorption due to its free energy of adsorption < 8 kJ mol−1. The kinetics were effectively explained by a pseudo-second order model for both the dyes suggesting that chemical mechanisms influenced the adsorption of CV and MB dyes onto NCC–CH. The intraparticle diffusion model best suited the MB adsorption with three stages rather than the CV with a single step process. Also, the removal efficiency of adsorbent was retained at above 60% even after seven adsorption–desorption cycles indicating the effectiveness of the NCC–CH hydrogel beads for the removal of textile dyes.
Nanocellulose based hydrogel beads for efficient removal and recovery of dyes from textile industry effluents.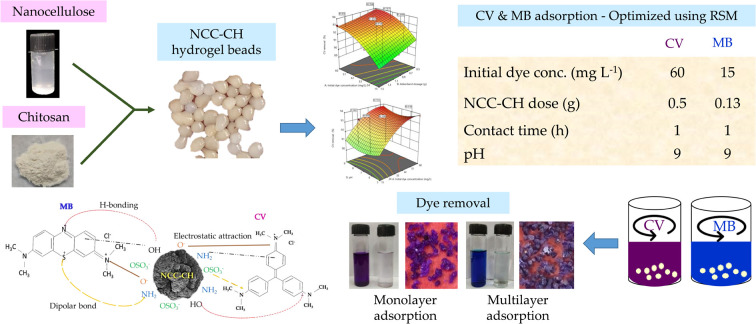
1. Introduction
Globalization enabled rapidity, efficacy, and comfort in every field of life. In addition, it has also contributed to biosphere pollution due to the uncontrolled discharge of pollutants by industries of all kinds, especially the dye industry in particular.1,2 The use of dyes covers a wide range of materials, including paper, textile fiber, leather, food, tannery, pharmaceutical products, cosmetics, etc.3,4 Natural sources were the only sources of dyes before globalization. However, the increasing demands for dyes and the high cost of extraction led to the discovery of synthetic dyes. Since then, dyeing industries have become increasingly dependent on synthetic dyes, producing around 8 × 10⁵ tons of synthetic dyes every year.5 Moreover synthetic dyes are mostly organic, and when discharged into the environment pose a serious threat to all living beings due to their carcinogenicity.6 In this line, crystal violet (CV) and methylene blue (MB) dyes are very toxic and is used for paper printing and textile dyeing. CV (C25N3H30Cl) is a triphenylmethane dye which is more toxic than anionic dyes.7 The chemical stability, thermal, and light stability of CV dye is attributed to its complex aromatic structures and physicochemical properties. The molecule is considered recalcitrant since it is poorly metabolized by microbes and can persist in a wide range of environments.8 Similarly, the most widely used dye in dyeing cotton, wood, and silk is MB (C16H18ClN3S). It can cause adverse effects including methemoglobinemia, nausea, vomiting, hypertension, red blood cell breakdown, allergic responses, and mental problems. Additionally, after a brief period of inhalation, it also causes shortness of breath.9 Therefore, the development of new advanced eco-friendly materials is needed to overcome the problems raised from using conventional materials used in the adsorption of these dyes.4,10 Several methods employed for dye removal are adsorption, membrane filtration, coagulation, flocculation, ozonation and biological treatment.11 Efficacy and viability of these methods depend mainly on their complexity in scaling up. Due to its simplicity, effectiveness and capacity to adsorb different compounds, methods with adsorbents are recognized as the most suitable and promising approach for removing harmful compounds from effluents. Several natural and synthetic absorbents had been developed for the removal of dyes from aqueous solutions during the past few decades.12–14 But, large scale application of these developed adsorbents were limited due to economic or technological concerns. In addition to that high cost, reusability and disposal of the adsorbents is still a question among the researchers and industries. Therefore, development of adsorbents from the nature derived materials with high reactive surface area, specific functional groups to adsorb targeted pollutant and sound reusability, could transform wastewater treatment. Nanocellulose sourced from agro residue is one among them having good mechanical strength, high functionality, biodegradability, non-toxic and high specific surface area.15
Based on the existing data, we considered the coconut husk fibre, a lignocellulosic material could serve as a low cost raw material for the synthesis of nanocellulose. Only a few research have reported the synthesis of nanocellulose from coconut husk fiber that can also be utilized to synthesize nano scale resources such as nanocellulose fibrils, nanocellulose whiskers, and nanocellulose crystals. Karimifard et al.16 hydrolysed the coir fiber with sulphuric acid to produce rod-like nanocrystals with diameters ranging from 10 to 30 nm. Similar to this, cellulose nanowhiskers with lengths ranging from 80 to 500 nm and widths of 6 nm were extracted from coconut husk fibres using nitric acid.17 At large scale, production of nanocellulose can be done through cost-effective alkali–acid hydrolysis method. However after adsorption process, centrifugation or coagulation is needed to recover the nanocellulose, which limits their large scale application.18 To overcome this, nanocellulose can be cross-linked with other polymers to form hydrogel beads. The use of hydrogel beads in wastewater treatment have received the attention of many researchers due to their swelling capability, posing of hydrophobic and hydrophilic proportions and its reusable nature.19 Similar to cellulose, chitosan is one of the biodegradable and non-toxic natural polymer composed of unbranched chains of poly(β-(1,4)-d-glucosamine).20 The presence of hydroxyl (–OH) and active amino (–NH2) groups in chitosan makes it suitable for adsorption processes hence it was used to impregnate the nanocellulose.21 Ecologically friendly nanomaterials for removing toxic compounds from wastewater could be extremely beneficial in the years ahead.
Hence, the main objective of this work was directed to fabricate and develop an effective nanocrystalline cellulose–chitosan (NCC–CH) hydrogel bead to remove CV and MB dyes from textile wastewater. FTIR, SEM, TEM, XRD, TGA and BET were used to characterize the prepared adsorbent. For effective adsorption of CV and MB dyes onto NCC–CH, different variables such as initial dye concentration, contact time, pH and NCC–CH dosage were examined and optimized using Response Surface Methodology (RSM). Optimization of adsorption parameters using conventional method is obsolete since it requires more experimental runs and time consuming. Also, the interaction effects of the optimization parameters were not elucidated in conventional method. Hence, RSM was applied to optimize the process parameters. Also, the reliability of experimental results was checked out using various models in kinetics and isotherm investigation.
2. Experimental methods
2.1. Synthesis of nanocellulose from coconut husk fiber
Coconut husk fiber was selected for nanocellulose synthesis since it is underutilized in agricultural sector and also has high cellulose content of 38 to 40%.22,23 Fibers were washed to remove dirt, shade dried for 48 h and shredded into small fibers. The dried husk fibers were soaked in water for 3 h at 50 °C, followed by alkali treatment with 2% NaOH at 80 °C for 3 h (1 g 10 mL−1). The alkali-treated fibers were washed till neutral pH and then oven dried for 6 h at 80 °C. Followed by bleaching with sodium hypochlorite (pH – 3.5, adjusted with 1 M glacial acetic acid) for 20 min and washed several times with water to remove the traces of chlorine. Bleaching was repeated until the residue became white or ivory yellow. The bleached residue was treated with 0.05 N nitric acid at 70 °C for 1 h, followed by alkali hydrolysis with 0.1 M NaOH at 45 °C for 3 h. Then the substrate was washed with distilled water until the pH became neutral and dried in oven at 80 °C for 3 h. The acid hydrolysis was performed with 45% sulphuric acid for 60 min at 50 °C under continuous stirring at 1200 rpm. A substantial amount of distilled water was added to quench the reaction and centrifuged for 15 min at 8000 rpm to remove the excess sulphuric acid. Then to disperse the nanocrystals, the solution mixture was suspended in distilled water at 1 : 10 ratio and sonicated using probe sonicator PR 250 for 20 min at 25–30 kHz.
2.2. Preparation of NCC–CH hydrogel beads
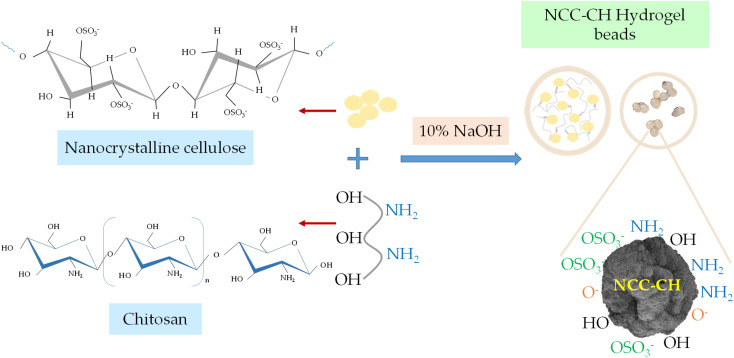
The synthesized nanocrystalline cellulose (NCC) was blended with chitosan to form hydrogel beads24 (Fig. 1). A 2 g of chitosan powder was mixed with 2% v/v acetic acid solution and stirred continuously using magnetic stirrer at 1000 rpm for 1 h. To this solution, 1 g of NCC was added and again stirred for uniform dispersion (1.5 h). Then the solution was allowed to drip from the burette to the alkali media (10% NaOH) under constant stirring condition at 300 rpm. The height of the nozzle from the alkali media was kept at 2.5 cm. Once the mixture came into contact with the NaOH media, the nanocrystalline cellulose–chitosan (NCC–CH) hydrogel bead was formed. For stabilization, the beads were kept in 2% NaOH solution for 12 h. After that, beads were collected and washed with water thoroughly until the wash water pH became neutral. The beads were dried in hot air oven at 50 °C for 2 h and stored for further experiments.
Fig. 1. Preparation of Nanocrystalline cellulose–chitosan hydrogel beads.
2.3. Characterization of NCC–CH hydrogel beads
2.3.1. Surface area and morphology
The surface area of the samples were determined by BET surface area analyzer (SMART SORB 92/93) in liquid nitrogen flow. In this process, the nitrogen gas molecules gets adsorbed onto the surface of the samples at the temperature of −196 °C. The quantity of adsorbed gas forms a monolayer which gives the distinct surface area of the samples.25 Morphology of the sample was examined using the Quanta 250 (FEI, Netherlands) scanning electron microscope (SEM) at a voltage of 10 kV. To eliminate the electron charging effects, the samples were coated with gold. TEM imaging was performed using FEI Techai Sprit (Netherlands) microscope with an accelerating voltage of 120 kV to study the nanostructure.
2.3.2. Swelling studies
Swelling capacity of the composite beads was studied by soaking a known quantity of beads in 100 mL distilled water for 12 h at room temperature. The swollen beads were weighed at an interval of 2 h removing the excess moisture using blotting paper.26 The swelling percentage was calculated using the following eqn (1)
 |
1 |
where, mi and mt is the initial weight and swollen weight of the hydrogel beads, respectively.
2.3.3. Determination of zero point charge (pHzpc) and zeta potential
To determine the pH zero point charge of the beads, pH drift equilibrium technique was employed. Ten conical flasks each containing 50 mL of 0.01 M NaCl was taken and the pH was adjusted from 1 to 10 using NaOH and H2SO4. A known quantity of composite beads was added to each flask and the flasks were equilibrated for 48 h. The final pH measured after 48 h was plotted against the initial pH and the intersection point was taken as pHzpc of the bead.27 For zeta potential analysis, the solution was agitated for 2 h in a mechanical shaker before sonicating. After sonication, the solution was filtered using Whatman no. 42 filter paper and supernatant was collected and analysed for its surface charges in particle size analyser (Horiba Scientific Nanopartica SZ-100, Japan).28
2.3.4. X-ray diffraction analysis
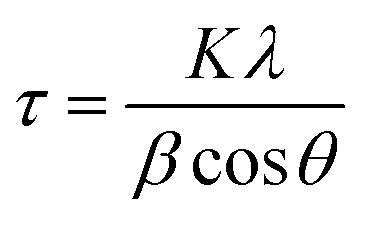
The crystallinity degree of the samples was determined using an X-ray diffractometer (XPERT-PRO D8 Bruker) at 30 mA current and 40 kV voltage.29 The Cu K radiation ranged from 5° to 400°. Amorphous subtraction method was used to calculate the crystallinity index (Xc) by eqn (2)
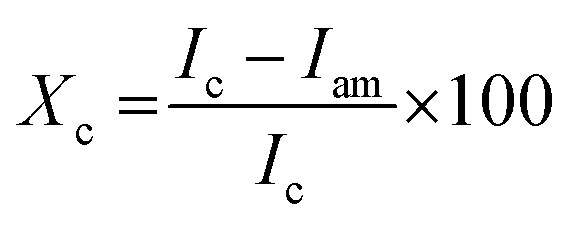 |
2 |
where, Ic and Iam are the peak intensities of crystalline and amorphous materials, respectively. The crystallite size was calculated by Scherrer eqn (3)
 |
3 |
2.3.5. Thermal stability
Thermogravimetric analyser (TG/DTA – EXSTAR/6300) was used to evaluate the thermal stability of the samples. The heating rate was kept at 10 °C min−1 and the temperature ranged from room temperature to 600 °C in nitrogenous atmosphere.30
2.3.6. Functional group analysis
The surface functional groups of the NCC and NCC–CH (before and after adsorption) was examined using Fourier-transform infrared spectroscopy (model 8400S of Shimadzu, Japan). The analysis was performed in the wavenumber range of 500–7000 cm−1 at 4 cm−1 resolution.31
2.4. Dye removal studies
2.4.1. Process variables
As seen in earlier studies, process parameters optimization for adsorption of dyes by keeping one factor constant and varying other factors is time consuming and laborious. To overcome these hurdles, response surface methodology (RSM) was being employed for optimization of process parameters to achieve maximum dye removal. RSM was demonstrated to be a beneficial technique which reduces both cost and time of the experiment.32 Hence, in this study RSM was adopted to optimize the adsorption parameters for MB and CV removal from aqueous solutions. A four independent factors such as initial dye concentration (mg L−1), adsorbent dose (g), contact time (h) and pH were selected based on the results reported by the previous studies. The other parameters temperature and rpm were fixed at 25 °C and 200, respectively. The Integrated Optimal design (I-optimal) of RSM was chosen to study the interaction between the process parameters and the response.33 The response for optimization was dye removal percentage from aqueous solutions. The optimization parameters and their coded variables were given in Table 1. Twenty five runs with random adsorption parameters were suggested by the I-optimal design and the runs were performed in triplicates. The response data were analyzed and evaluated using DESIGNEXPERT software (Stat-Ease, USA, version 13).
Range of factors in RSM I-optimal design for dye removal.
| Factor | Name | Levels of factor | I | II | III | IV | V |
|---|---|---|---|---|---|---|---|
| A | Initial dye concentration (mg L−1) | 4 | 15 | 30 | 45 | 60 | — |
| B | Adsorbent dose (g) | 3 | 0.1 | 0.3 | 0.5 | — | — |
| C | Contact time (h) | 5 | 1 | 2 | 3 | 4 | 5 |
| D | pH | 3 | 5 | 7 | 9 | — | — |
2.4.2. Batch adsorption experiments
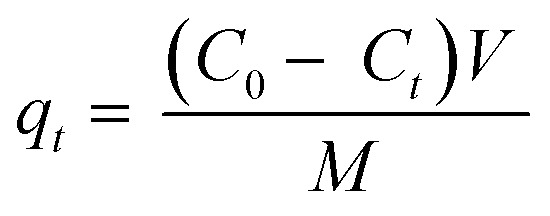
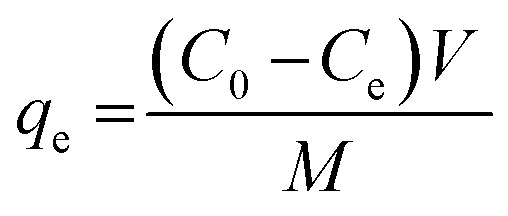
By dissolving 0.1 g of each dye in 100 mL of distilled water, a stock solution of 1000 ppm of dyes (CV and MB) was prepared. The appropriate concentration (15, 30, 45 and 60 mg L−1) was then obtained through dilution. A 25 mL of each concentration was taken in conical flasks to perform the trial runs as given in Table 2. The pH of the solutions were adjusted using 0.1 M NaOH and 0.1 M HCl. All tests were conducted at room temperature (25 °C). After adsorption, residual dye concentration was measured using Thermoscientific Genesys 180 UV-vis spectrophotometer. The maximum absorbance (λmax) of MB and CV were found to be at 664 and 586 nm using a calibration curve.7 Dye removal efficiency (%) and adsorption capacity (mg g−1) of NCC–CH were determined by the given equations.
 |
4 |
 |
5 |
 |
6 |
where, C0 is the initial dye concentration (mg L−1), Ct and Ce is the dye concentration at time and equilibrium (mg L−1), respectively, V is the volume of dye solution (L), M is the weight of dry beads (g), qt and qe is the amount of dye adsorbed (mg g−1) at time and equilibrium, respectively.
Predicted and experimental responses of CV and MB removal by NCC–CH hydrogel beads.
| Run | A a | B a | C a | D a | CV-Removal efficiency (%) | MB-Removal efficiency (%) | ||
|---|---|---|---|---|---|---|---|---|
| Experimentalb | Predicted | Experimentalb | Predicted | |||||
| 1 | 60 | 0.1 | 5 | 7 | 93.21 ± 0.88 | 93.18 | 77.16 ± 0.73 | 76.82 |
| 2 | 30 | 0.5 | 5 | 5 | 88.98 ± 0.71 | 89.16 | 89.21 ± 0.71 | 90.73 |
| 3 | 60 | 0.5 | 4 | 5 | 91.46 ± 0.95 | 91.53 | 90.66 ± 0.94 | 90.94 |
| 4 | 60 | 0.5 | 5 | 9 | 92.60 ± 0.48 | 92.54 | 85.87 ± 0.45 | 86.29 |
| 5 | 30 | 0.1 | 5 | 5 | 91.94 ± 1.04 | 91.84 | 93.69 ± 1.06 | 92.28 |
| 6 | 15 | 0.5 | 3 | 5 | 87.77 ± 1.16 | 87.54 | 91.60 ± 1.21 | 91.21 |
| 7 | 15 | 0.1 | 3 | 7 | 89.55 ± 1.60 | 89.17 | 84.18 ± 1.51 | 83.35 |
| 8 | 60 | 0.1 | 1 | 5 | 93.86 ± 1.32 | 93.82 | 90.33 ± 1.27 | 90.67 |
| 9 | 37.5 | 0.3 | 3 | 7 | 90.84 ± 0.94 | 90.98 | 90.35 ± 0.94 | 90.15 |
| 10 | 37.5 | 0.3 | 3 | 7 | 91.13 ± 0.47 | 90.98 | 93.76 ± 0.49 | 93.42 |
| 11 | 15 | 0.5 | 5 | 7 | 86.73 ± 0.82 | 86.69 | 91.60 ± 0.86 | 90.51 |
| 12 | 15 | 0.3 | 5 | 9 | 88.43 ± 1.17 | 88.43 | 89.24 ± 1.18 | 88.90 |
| 13 | 37.5 | 0.3 | 3 | 7 | 91.07 ± 0.95 | 90.98 | 88.07 ± 0.91 | 86.89 |
| 14 | 45 | 0.5 | 1 | 7 | 92.63 ± 1.12 | 92.64 | 95.11 ± 1.15 | 96.23 |
| 15 | 15 | 0.5 | 2 | 9 | 89.41 ± 0.91 | 89.47 | 93.08 ± 0.95 | 93.22 |
| 16 | 45 | 0.1 | 4 | 9 | 92.49 ± 0.48 | 92.57 | 91.28 ± 0.47 | 91.42 |
| 17 | 15 | 0.3 | 1 | 5 | 90.28 ± 0.72 | 90.31 | 88.84 ± 0.71 | 88.76 |
| 18 | 30 | 0.5 | 1 | 5 | 91.30 ± 0.86 | 91.47 | 90.33 ± 0.85 | 91.28 |
| 19 | 37.5 | 0.3 | 3 | 7 | 90.96 ± 1.28 | 90.98 | 86.78 ± 1.22 | 88.35 |
| 20 | 60 | 0.3 | 1 | 9 | 93.74 ± 1.24 | 93.85 | 87.02 ± 1.15 | 87.11 |
| 21 | 60 | 0.5 | 1 | 5 | 93.15 ± 1.46 | 93.00 | 92.27 ± 1.45 | 91.32 |
| 22 | 37.5 | 0.3 | 3 | 7 | 91.02 ± 0.73 | 90.98 | 89.24 ± 0.72 | 89.73 |
| 23 | 30 | 0.1 | 1 | 9 | 92.93 ± 0.95 | 92.73 | 83.44 ± 0.85 | 83.13 |
| 24 | 15 | 0.1 | 3 | 7 | 88.59 ± 1.25 | 89.17 | 75.73 ± 1.07 | 75.68 |
| 25 | 45 | 0.1 | 4 | 9 | 92.55 ± 0.96 | 92.57 | 85.91 ± 0.89 | 86.37 |
A – initial dye concentration (mg L−1), B – adsorbent dosage (g), C – contact time (h), D – pH.
Values next to ± are standard error of 3 replicates.
2.5. Adsorption isotherm
Adsorption isotherms were studied in batch experiments by varying the dye concentrations from 25 to 60 mg L−1. Contact time and adsorbent dose were fixed at 60 min and 0.1 g, respectively, in this experiment. Various mathematical models were used to determine the influence of dye concentration on removal efficiency (%) and adsorption capacity (mg g−1).
2.6. Adsorption kinetics
Batch adsorption experiments were carried at fixed adsorbent dose (0.1 g) and initial dye concentration (60 mg L−1) by varying the contact time from 20 to 180 min. The dye uptake by the adsorbent was then plotted against time and fitted using different models to determine the adsorption kinetics.
2.7. Desorption and regeneration study
One of the key aspects in dye removal from wastewater applications is a solid adsorbent's recovery and reusability.34 Several cycles of adsorption/desorption investigation were conducted in batch mode. In 25 mL of an aqueous dye solution (60 mg L−1), 0.1 g of hydrogel beads were agitated. After reaching equilibrium, the saturated beads were subjected to desorption by shaking it with double distilled water, 50% ethanol, 1 M NaCl, 1 M NaOH, 1 M KOH, 1 M CaCl2, 0.1 M HCl and 0.1 M HNO3 for 60 min. Between each cycle, the beads were filtered and dried in hot air oven for 1 h at 50 °C. After the process, the concentration of desorbed dye was analysed using standard graphs in spectrophotometer. The amount of desorbed dye was calculated by the following eqn (7),
 |
7 |
where, qd is the amount of dye desorbed (mg g−1) and qa is the amount of the dye adsorbed onto the adsorbent (mg g−1).
3. Results and discussion
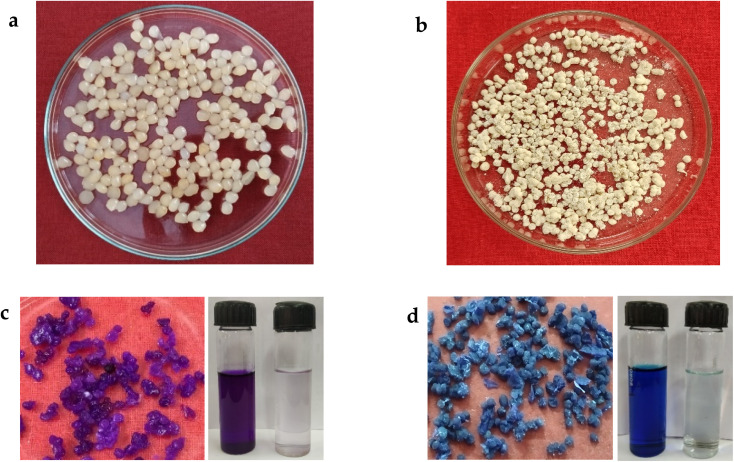
In our work we chose the coconut husk fibre, a lignocellulosic biomass as raw material for isolation of cellulose to synthesize NCC. Alkali treatment by sodium hydroxide, was very effective at extracting the lignin fraction from the fibre (up to 70%), causing structural changes in the biomass.35,36 Sulphuric acid had hydrolysed the cellulose content and yielded spherical NCC with diameter <50 nm (Fig. S1a†). Then the synthesized NCC was blended with chitosan and NCC–CH hydrogel beads were formed. The homogeneous, translucent composites showed that NCC and chitosan had been thoroughly dissolved, homogenized, and dispersed (Fig. 3a). After drying, the composites' pale yellow colour was probably caused by the contact between chitosan's amino groups and cellulose's carbonyl groups (Fig. 3b).24
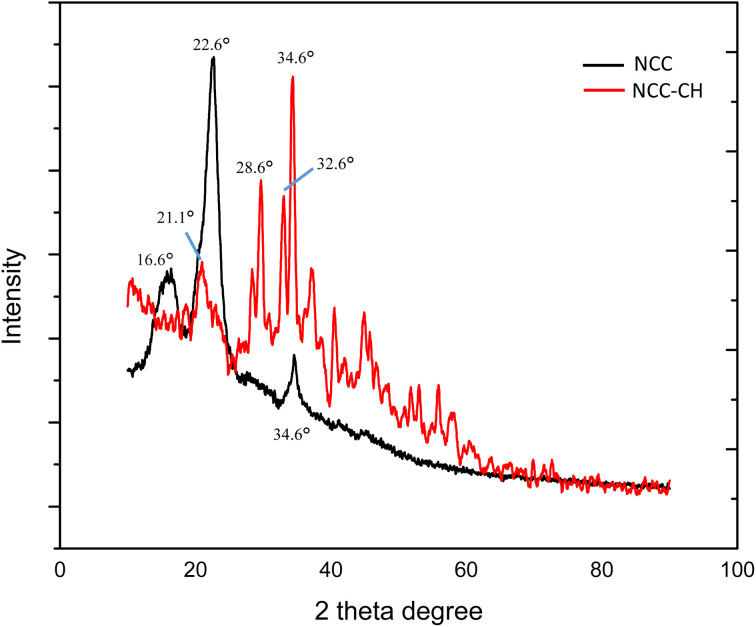
Fig. 3. X-ray diffractograms of NCC and NCC–CH hydrogel beads.
3.1. Characterization of NCC and NCC–CH hydrogel bead
As shown in Fig. 2a, the wet NCC–CH hydrogel beads exhibited spherical shape with smooth surface. After drying, the hydrogel beads were shrunk and surface became wrinkled with slight texture (Fig. 2b). Xu et al.10 also reported that the beads produced from carboxylated chitosan and cellulose nanocrystal had wrinkled surface after drying. The TEM micrograph in Fig. S1a† depicts the morphology of the synthesized NCC, which was <50 nm in diameter and spherical in shape. SEM micrographs shown in Fig. S1b–d† depicts the surface morphology and porous nature of the NCC–CH hydrogel beads before and after adsorption. The NCC incorporated hydrogel have rough and undulated surface which in turn influenced the pore size and distribution on its surface (Fig. S1b†). The undulations and folds on the bead surface might increase the surface area for adsorption of dyes. Also, the presence of NCC could enhance the liquid diffusion into the hydrogel matrix by increasing the hydrophilic groups and binding sites. Furthermore, it is evident from the SEM micrographs that the NCC were efficiently dispersed within in hydrogel network, no agglomerations were seen. This could be due to the presence of hydroxyl groups in NCC, which gives it a hydrophilic character, facilitates better interaction between NCC and chitosan.
Fig. 2. NCC–CH hydrogel beads (a) wet (b) dry (c) after CV adsorption (d) after MB adsorption.
The BET specific surface area, pore volume and corresponding pore size of NCC–CH beads were 25.77 m2 g−1, 0.057 cm3 g−1 and 16.2 nm respectively (Fig. S1†). Similarly, Li et al.37 also reported that the synthesized cellulose–chitosan composite bead has 29.5 m2 g−1 surface area. The pores were mesoporous in nature and distributed uniformly in the bead surface as evidenced in SEM micrograph (Fig. S2b†). Consequently, this can improve the bead's ability to adsorb dyes on its surface.38 The swelling property of hydrogels is one of its key properties, which is very important for the practical application of hydrogels. Swelling ratio (SR) is controlled by the porosity and chemical functionality of the adsorbent.39 The hydrophilic nature of the chitosan (–NH2 group) and NCC (–OH group) is responsible for the initial rise in the SR. The SR of the hydrogel beads gradually increased from 55 to 83% and attained the equilibrium after 8 h (Fig. S3a†). At first, a huge amount of water enters the hydrogel structure and formed hydrogen bonds; later, as more water slowly diffused into the hydrogel network, the osmotic pressure between the water surrounding the hydrogel network decreased, lowering the force opposing elastic contraction.29
The surface charge of the adsorbent material in an aqueous solution is characterized by the point of zero charge. The pHzpc of the cellulose–chitosan hydrogel beads was found to be 4.4 (Fig. S3b†). At this pH, the surface charge of the adsorbent is neutral (ΔpH = 0). Due to the electrostatic force an adsorbent surface becomes negatively charged when pH > pHzpc, thereby favouring the adsorption of cationic dyes while at pH < pHzpc, the adsorbent surface becomes positively charged due to the adsorption of H+.40 Zeta potential measurements were used to prove the stability of the suspension. In order to establish colloidal physical stability, it is considered that a zeta potential value of less than −30 or more than +30 mV provides an appropriate repulsive force. Sulphate groups end up being chemically bonded to NCC as a result of H2SO4 hydrolysis, imparting a negative charge with a zeta potential value of −72.2 mV. For NCC–CH, negative hydroxyl groups are converted into positive quaternary ammonium groups, as indicated by the zeta potential value +50.6 mV.24
The X-ray diffractograms of nanocellulose and hydrogel beads were shown in Fig. 3. The 2θ peaks at 16.6°, 22.6° and 34.6° of the NCC spectra were the lattice planes of crystalline cellulose (110), (200) and (004), respectively. The diffraction peak at 22.6° was shifted to 21.1° after the hydrogel bead formation, which was evident in the NCC–CH spectra. The new diffraction peaks at 28.6° and 32.6° could be due to the crosslinking of NCC with chitosan, which is a semi-crystalline polysaccharide.41 Also, the crystallinity index of the hydrogel bead (46.6%) was found to be declined greatly compared to the NCC (80.05%). This could be due to the reactions occurred on the surface of NCC which decreased the intensity of the interactions while forming hydrogel.30 The increase in average crystallite size (124.7 nm) of the NCC–CH hydrogel bead than the NCC (10.77 nm) confirmed the crosslinking of NCC with chitosan.
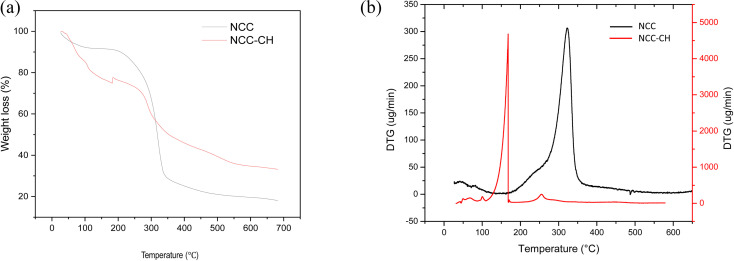
The thermogravimetry analysis and derivative thermogravimetry curves were depicted in Fig. 4. The decomposition occurred in three stages in both the samples. Initially, the weight loss up to 100 °C was due to the loss of low molecular weights and moisture from the samples (Fig. 4a). The second stage at temperature range 160–340 °C in NCC–CH had mass loss of 30% which could be due to decomposition of chitosan components.31 While in NCC, around 50% of mass loss occurred at a narrow range of temperature (200–350 °C) due to the degradation of cellulose components. But, the decomposition of NCC–CH was started at lower temperature (160 °C) than the NCC, indicating that the thermal stability was higher for NCC. This reduced thermal stability of the NCC–CH could be due to decreased crystallinity and weak hydrogen bonding between NCC and chitosan as seen in FTIR spectra. The third stage continued after 350 °C in both the samples was due to complete degradation of components into CO2 and H2O. As in DTG graphs (Fig. 4b), the decomposition in both the samples occurred at a single peak. Also, per cent solid residue left after the pyrolysis was higher in the NCC–CH than NCC. Jia et al.42 also reported low thermal stability of bacterial cellulose–chitosan hydrogel than the cellulose due to decreased crystallinity.
Fig. 4. (a) Thermogravimetric analysis and (b) derivative thermogravimetry of NCC and NCC–CH hydrogel beads.
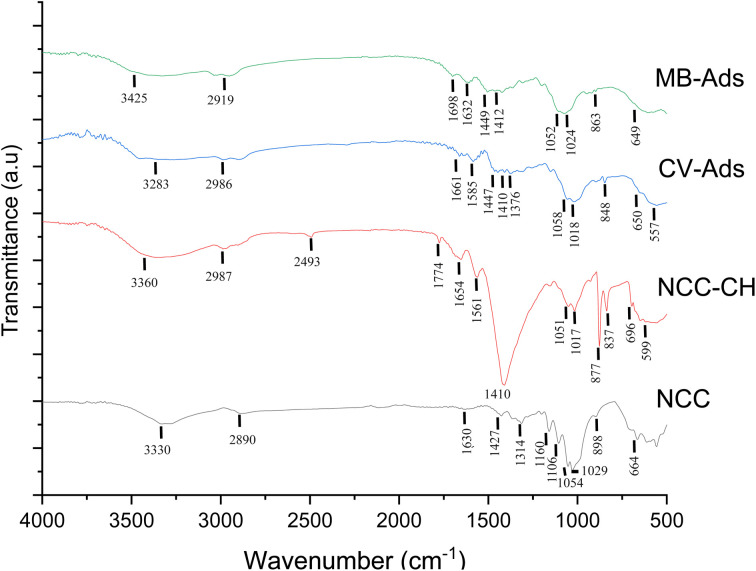
The FTIR spectra of the NCC and NCC–CH hydrogel beads before and after CV adsorption were shown in Fig. 5. Since adsorption is mainly depend on the functional groups present in the adsorbent surface, the study of surface chemistry is inevitable. The C–O stretching of cellulose is represented by the characteristic peak at 1029 cm−1 in the NCC spectra, while that peak shifted to 1017 cm−1 after forming composite bead with chitosan. The intensity of C–O stretching vibrations observed at 1054 cm−1 in NCC spectra was decreased in the NCC–CH spectra (1051 cm−1) before adsorption. The IR spectral peaks at 3330 cm−1 in NCC were shifted to 3360 cm−1 in the hydrogel bead indicating the presence of intermolecular hydroxyl (–OH) bond.27 The reduced intensity of the peak indicates the decrease in crystallinity of the hydrogel bead.43 The composite formation took place as a result of interactions between OH groups on the surface of the NCC and OH and/or NH2 groups on Chitosan.38 Similarly, the peaks at 898 and 1630 cm−1 corresponding to the β-glycosidic linkage between glucose unit in cellulose and OH bending in the NCC spectra were shifted to 877 and 1654 cm−1 in NCC–CH spectra with increased intensity. The shifted peak at 1654 cm−1 and the appearance of new peak at 1561 cm−1 (–NH group) in the NCC–CH spectra could be due to the presence of type I and type II amide groups in the chitosan molecule. This shift was attributed to the presence of an electrostatic interaction between the negatively charged sites of NCC and amine groups of Chitosan.44 Also, the peak at 1427 cm−1 in the NCC spectra indicated the crystallized cellulose I and amorphous cellulose, whereas in the NCC–CH spectra it shifted to 1410 cm−1 representing cellulose II and amorphous cellulose.45 Moreover, NCCs with high ZP (−72.2 mV), caused by high surface charge of single bond OSO3− groups during acid hydrolysis, could have attracted the amide units –NH2+ of chitosan via electrostatic interactions. This indicates the successful mixing of NCC with chitosan.
Fig. 5. FTIR analysis of NCC and NCC–CH hydrogel beads before and after dye adsorption.
3.2. Optimization of parameters for removal of dyes by NCC–CH using integrated optimal design (I-optimal) in RSM
The process parameters for crystal violet and methylene blue adsorption were optimized using I-optimal design in RSM. Experimental design using RSM results in higher accuracy by improving the process parameters for more than two levels thus minimizing the experimental error. The individual and interactive effects of process parameters on the response was determined using 3-D surface plots given by I-optimal design.46 The process parameters were listed in terms of the coded variable, A stands for initial dye concentration (15 to 60 mg L−1), B for adsorbent dose (0.1 to 0.5 g), C for contact time (1 to 5 h), and D for pH (5, 7 and 9). The trial runs with experimental and predicted values were presented in Table 2.
3.2.1. Interactive plots
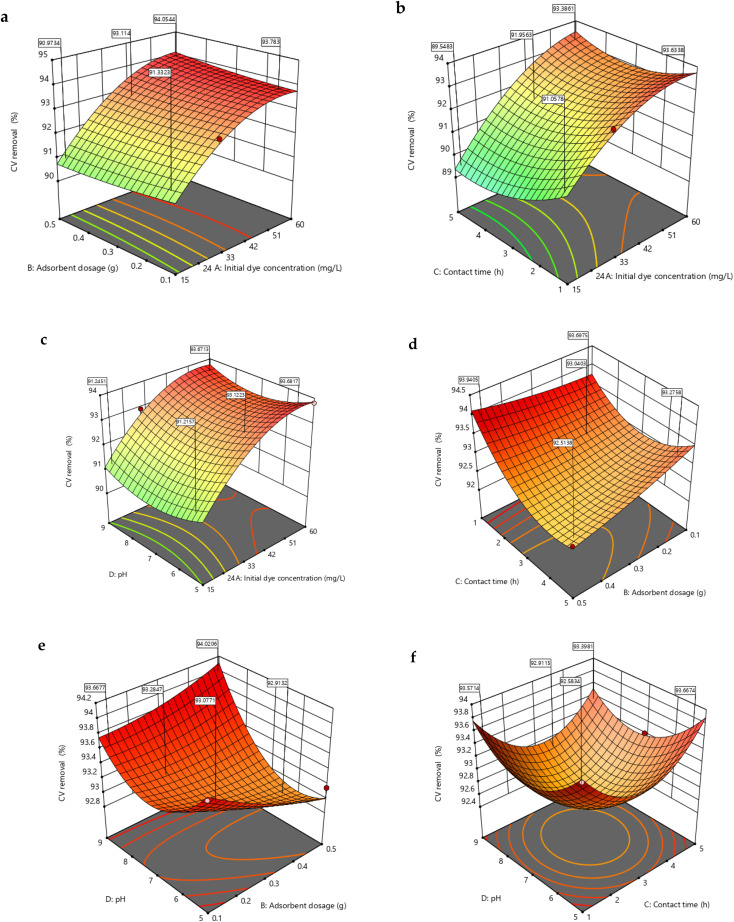
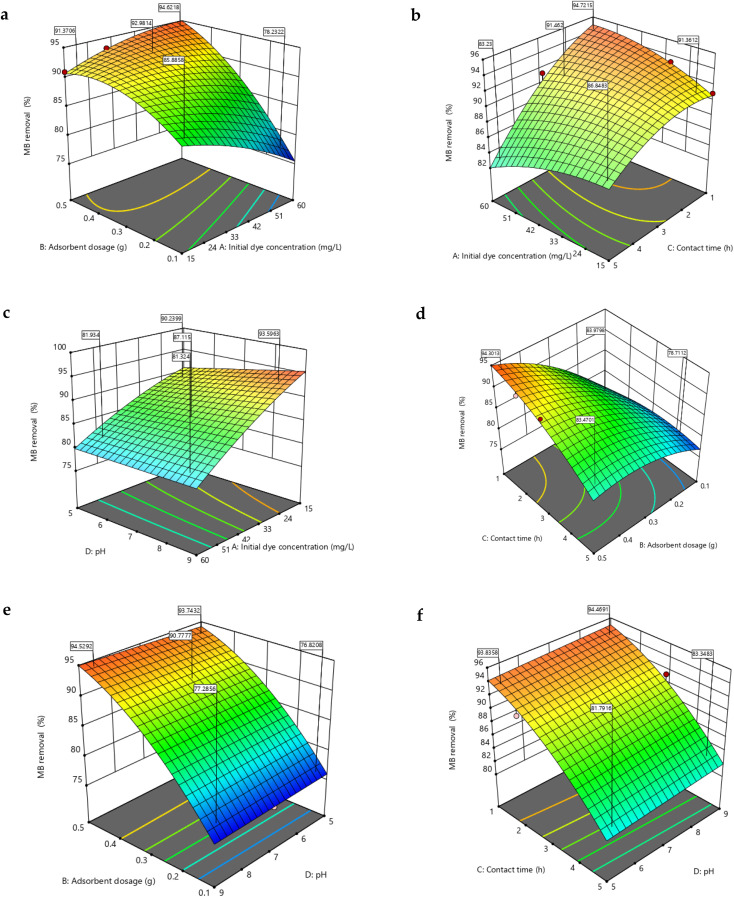
In multivariate optimization, it is important to evaluate how different independent factors affect the outcome.47Fig. 6 and 7 show the three-dimensional (3-D) quadratic response surface plots for different independent variables such as initial dye concentration, adsorbent dosage, contact time and pH concerning CV and MB removal from aqueous solution, respectively. By varying any two variables up to the experimental range's upper limit while holding the other independent factors fixed, the surface plots were generated from the model. Furthermore, the nature of the curvature of the plots illustrates the intensity of the interaction of the process variables.48
Fig. 6. RSM 3-D plots for CV removal (60 mg L−1 initial dye conc., 1 h contact time, 9 pH and 0.1 g adsorbent dosage) (a) adsorbent dose and initial dye concentration (b) contact time and initial dye concentration (c) pH and initial dye concentration (d) contact time and adsorbent dose (e) adsorbent dose and pH (f) pH and contact time.
Fig. 7. RSM 3-D plots for MB removal (60 mg L−1 initial dye conc., 1 h contact time, 9 pH and 0.5 g adsorbent dosage) (a) adsorbent dose and initial dye concentration (b) contact time and initial dye concentration (c) pH and initial dye concentration (d) contact time and adsorbent dose (e) adsorbent dose and pH (f) pH and contact time.
3.2.1.1. Influence of initial dye concentration on dye removal
The initial dye concentration is proven to be one of the most relevant components that would attribute to the dye removal efficiency. According to the contour plots in Fig. 6a–c, as the initial CV concentration increased, the percentage dye removal also increased. As the dye concentration increases, more free dye molecules are available and ready to bind to the adsorbent's surface, increasing the effectiveness of dye removal. Also, at lower CV concentrations the availability of dye molecules was lower in the vicinity of the adsorbent leading to reduced extent of driving force resulting in decreased CV removal percentage.49 Contrarily, increase in initial MB concentration decreased the removal percentage as evident in Fig. 7a–c. This may be caused by the hydrogel surface becoming saturated with adsorption sites due to the low ratio of active sites to dye concentration. This in turn implied that a dye molecule monolayer may form at the hydrogel–dye interface.29 From Fig. 7a, it was noted that the removal percentage decreased from 85 to 78% with increasing dye concentration at 0.1 g NCC–CH. Similar results were obtained by Allouss et al.32. In their study using carboxymethyl cellulose based hydrogel bead, the removal efficiency decreased from 97 to 83% as the MB concentration increased from 2 to 15 mg L−1. Besides, higher interaction of dye molecules with the surface and active sites in the adsorbent structure could be the cause for the high removal efficiency at low MB concentrations.50 Furthermore, the electrostatic attraction between dye molecules increases with dye concentration, causing competition between dye molecules for the limited number of NCC–CH active sites. As a result, the dye removal (%) decreased with increasing initial dye concentrations. The decrease in removal efficiency with increase in initial dye concentration was supported by many researchers.27,32,51
3.2.1.2. Influence of pH on dye removal
The pH of the aqueous solution plays a major role in the adsorption of dye molecules by influencing the surface charge of the adsorbent and also ionization of dye molecules. The dye removal percentages were increased with increasing the pH from 5 to 9. The pHzpc of the NCC–CH was 4.4 and the surface charge of the adsorbent became negatively charged at pH > 4.4. As pH increases above 4.4, deprotonation of amino (–NH2) and carboxyl (–COO) groups could have occurred at the adsorbent surface generating more of negatively charged surface binding sites.52 The NCC–CH has OH, COOH and C O groups, which perform as active sites for dye adsorption. Moreover, CV (Fig. 6c–f) and MB (Fig. 7c–f) dyes readily adsorbed onto NCC–CH in alkaline conditions. From Fig. 9c, it was observed that in-creasing pH had increased the MB removal from 86 to 90% at 15 mg L−1 MB concentration. The active sites get fully ionized as a result of an increase in the amount of negative charges on the adsorbent. This in turn increased the electrostatic interaction between the cationic dye molecules and surface binding sites in NCC–CH hydrogel bead. However, the removal of dyes decreased at higher pH which could be due to the declined surface charge density of the adsorbent resulting in electrostatic repulsion from the positive charge of the dye molecule.53
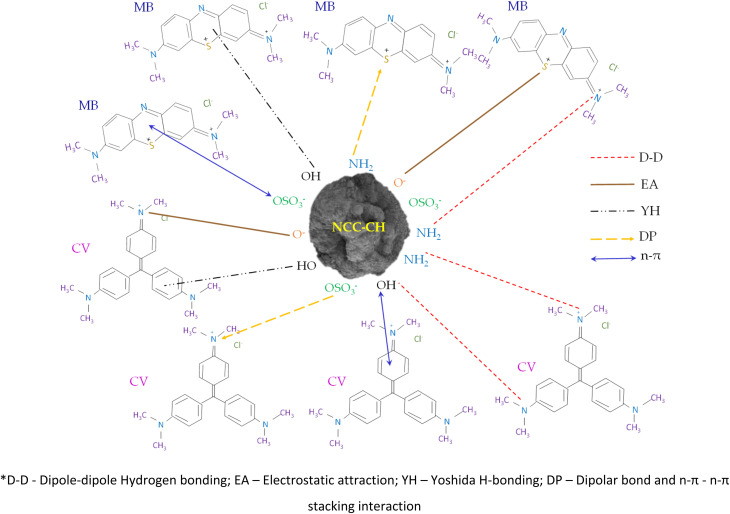
Fig. 9. Proposed adsorption mechanisms for CV and MB dyes onto NCC–CH hydrogel beads.
3.2.1.3. Influence of adsorbent dosage on dye removal
As seen from the contour plots (Fig. 6a–e), increase in adsorbent dose resulted in decreased CV dye removal. The low dose 0.1 g had achieved maximum removal efficiency than the higher doses. The possible reason is that when NCC–CH concentration increases, more active sites are crowded into a smaller space, increasing steric hindrance and suppressing the adsorption process.54 But, several authors had reported that the pollutant removal increases with adsorbent dosage due to the increase in active sites of the adsorbent.55,56 Likely, MB removal increased with increase in adsorbent dosage from 0.1 to 0.5 g (Fig. 7a–e). The MB removal percentage increased from 77 to 94% as adsorbent dosage increased from 0.1 to 0.5 g at 60 mg L−1 MB concentration and pH 9 (Fig. 7a). Through pore diffusion, CV and MB in aqueous solution were first adsorbed on the surface of adsorbents, then transported into the pore interiors of those adsorbents. As dye molecules diffuse, both the structural characteristics of adsorbents and adsorbates play an important role in the adsorption process. A difference in the molecular structures of MB (line-shaped) and CV (fork-shaped) could contribute to the difference in adsorption patterns between CV and MB as a result of the co-influence of the pore size of adsorbents and the structure of adsorbates.57
3.2.1.4. Influence of contact time on dye removal
An essential element of the designed adsorption process is the contact time between the adsorbate and adsorbent. As seen from the surface contour plots, the highest dye removal was observed at minimum contact time. However, no drastic difference was observed in removal efficiency of both the dyes. As time increases, all the vacant adsorption sites in the surface of NCC–CH hydrogel bead got occupied and saturated which lead to decreased CV removal at higher contact time. Moreover, low adsorption could be due to the electrostatic repulsion between the adsorbed dye molecules and positively charged CV molecules in aqueous solution.59 From Fig. 7f, it can be seen that the MB removal efficiency increased from 83 to 94% with decrease in contact time at alkaline pH 9.
3.2.2. Model validation
After applying the desirability function, the optimum CV removal was 94.75% at contact time of 1 h, initial dye concentration of 60 mg L−1, adsorbent dosage of 0.5 g and solution pH of 9. The optimum MB removal was 95.88% at contact time of 1 h, initial dye concentration of 30 mg L−1, adsorbent dosage of 0.13 g and solution pH of 9. To validate the accuracy of the model, the experiment was carried in replicates with the optimized conditions. The average CV and MB removal obtained was 94.75% and 95.88%, respectively, which was closer to the predicted value (CV – 94.10% and MB – 95.74%). It indicated that the quadratic regression model was valid and accurate in predicting the dye removal.60
3.3. Response surface modelling
3.3.1. Model fitting and analysis of variance
The quadratic model suggested by the RSM tool was applied to analyse the experimental results. The statistical analysis for the CV and MB removal processes were given in Table 3, respectively. The p-values for the model variables helps in determining the level of significance (<0.05) of individual as well as interaction effects of each factor.55 The p-values for both the process were <0.0001. Similarly, the magnitude of significance of the quadratic model and the factors was determined by the Fisher's F-test. If the F-value is higher, the significance is higher for the model term.61 The F-value is calculated as the ratio between the mean square of the model and the residual error. In addition to significant p-values (<0.0001), F-value of 85.19 and 30.55 for CV and MB removal, respectively, had also confirmed that the quadratic model was the best fit in explaining the removal of dyes using NCC–CH hydrogel beads. Model also suggested that there is only a 0.01% chance for this large F-value could occur due to noise. According to F-value, the order of effect of the process parameters on the CV removal is as follows, initial dye concentration > contact time > pH > adsorbent dose (Table S1†). Whereas, for MB removal the order was contact time > initial dye concentration > adsorbent dose > pH (Table S2†). The quadratic model equation with coded factors acquired for the CV and MB removal processes by NCC–CH hydrogel beads were given as,
| CV removal (%) = +90.98 + 1.89A − 0.6424B − 0.7624C + 0.1914D + 0.1835AB + 0.3757AC − 0.0074AD − 0.3336BC + 0.3028BD − 0.0652CD − 0.8322A2 + 0.0840B2 + 0.6523C2 + 0.5242D2 | 8 |
| MB removal(%) = +90.35 − 2.46A + 2.24B − 0.7527C + 1.30D + 3.58AB − 2.18AC − 1.16AD − 3.60BC + 0.3121BD + 0.062CD − 1.11A2 − 2.70B2 − 1.86C2 − 0.017D2 | 9 |
ANOVA and coefficients model for the dye removal process.
| ANOVA | CV | MB |
|---|---|---|
| Model | ||
| F-value | 85.19 | 30.55 |
| p-value | <0.0001 | <0.0001 |
| Significance | Sa | Sa |
| Lack of fit | ||
| F-value | 0.70 | 5.05 |
| p-value | 0.6204 | 0.1759 |
| Significance | NSa | NSa |
| Coefficient of variation | 0.30% | 1.26% |
| R 2 | 0.99 | 0.98 |
| Adjusted R2 | 0.98 | 0.94 |
| Predicted R2 | 0.87 | 0.81 |
| Adeq. precision | 33.82 | 23.06 |
S – significant; NS – not significant.
Among those variables, A, C, D, AC, BC, BD, A2, C2, and D2 were found to have significant effect on the removal efficiency of CV by NCC–CH hydrogel bead (Table S1†). Whereas, for MB removal A, B, C, AB, AC, AD, BC, B2 and C2 were found to have significant effect (Table S2†). Any model term with a positive coefficient demonstrated a synergistic effect, whereas those with a negative value indicated an antagonistic effect. The insignificant terms were eliminated and the final model equation is expressed as,
| CV removal (%) = +90.98 + 1.89A − 0.6424B − 0.7624C + 0.1914D + 0.3757AC − 0.3336BC + 0.3028BD − 0.8322A2 + 0.6523C2 + 0.5242D2 | 10 |
| MB removal (%) = +89.76 + 2.53A − 1.93C + 1.25D + 0.3757AC − 0.8340BC + 0.7570BD − 0.8322A2 + 0.6523C2 + 0.5242D2 | 11 |
The lack of fit is insignificant relative to the pure error with an F-value of 0.70 for CV removal and 5.05 for MB removal (Table 3). The significance of “lack-of-fit,” according to the literature, can be linked to repeated measurements with repeating centre point data that are identical to one another.60 Non-significant ‘lack-of-fit’ in our study implies that the quadratic model is the best fit. The fit statistics data such as coefficient of variation (%), adequate precision, R2, adjusted and predicted R2 were also obtained. The obtained co-efficient of variation for both the dyes were <10% and that the data were accepted with less variation between the experimental results.62 The desirability of the I-optimal model was determined by the adequate precision ratio, which was found to be 33.82 and 23.06 for CV and MB removal, respectively in our study. Chinonye et al.63 stated that if the ratio is above 4, then this model could be used to navigate the design space. The R2 value should not be less than 0.75 for an accurate model.64 According to Rai et al.,65 for there to be good agreement, the adjusted R2 (0.98) and predicted R2 (0.87) must be within 20% of each other for CV removal. For MB removal also, the adjusted R2 (0.94) and predicted R2 (0.81) ought to be within 20% of each other. As a result, the suggested model is 87 and 81% versatile in predicting the CV and MB removal outside of the experimental range of reaction conditions.
3.3.2. Diagnostic plots
Graphical estimations that describes the difference between the experimental and predicted values is also essential to prove the fitness of the model. The predicted values plotted against experimental values is shown in Fig. S4† and the normal plot of residuals in Fig. S5.† From the Fig. S3,† it can be seen that the experimental values obtained were in close proximity with the values predicted by the model, which confirmed the robustness of the model.46 Most of the residual values were found to be insignificant as many values show only ±1 unit deviations from the centre point (Fig. S5†). Hence, the quadratic regression model suggested by RSM tool was sufficient in modelling the removal of CV and MB by NCC–CH hydrogel beads. The deviation from the reference point in terms of independent factors was shown in the perturbation plot (Fig. S6†). From the graph, the highest deviation from 88.3 to 92% was exhibited by the initial dye concentration, while the lowest was by solution pH (91.3 to 91.8%) for CV removal. It has been found that a curve or steep slope indicates how sensitive the response is to certain factors, whereas a flat line indicates how insensitive the response is to those factors.65 The least influence on CV and MB removal was exerted by adsorbent dosage and pH, respectively. Whereas, initial dye concentration and contact time had highly influenced the removal of CV and MB, respectively.
3.4. Adsorption isotherms
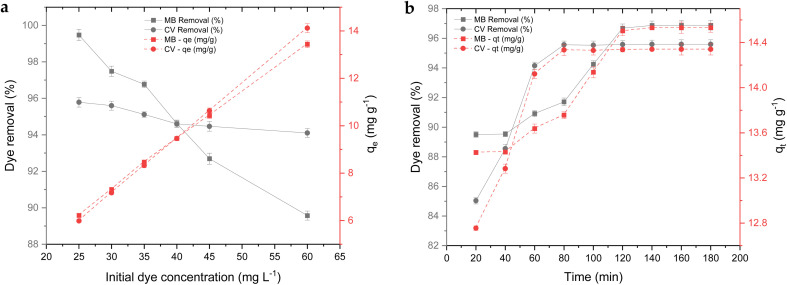
Fig. 8a illustrates the effect of initial dye concentration on the removal efficiency and adsorption capacity of NCC–CH hydrogel bead for CV and MB. The initial dye concentration is proven to be one of the most relevant component that would attribute to the dye removal efficiency. The adsorption capacity was increasing with increase in initial dye concentration which shows that the adsorbent sites got occupied with the dye molecules.66 In our study, the adsorption capacity of NCC–CH hydrogel bead for CV and MB was increased from 5.98 to 14.11 mg g−1 and 6.21 to 13.43 mg g−1, respectively when their initial concentrations was increased (25 to 60 mg L−1). Similar trend was observed by Guzel et al.59 in his study that the adsorption capacity of nanoporous carbon from tomato waste increased from 2.83 to 21.89 mg g−1 with the increase in initial CV concentration from 25 to 200 mg L−1. When CV concentration is increased, mass transfer from the bulk solution to the surface of the sorbent is increased, resulting in faster sorbent uptake and greater adsorption capacity.67
Fig. 8. Effect of initial dye concentration (a) and contact time (b) on removal of CV and MB.
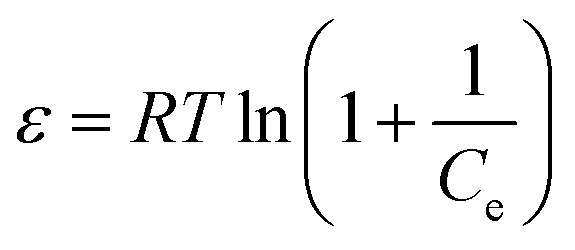
Further, adsorption isotherms were used to determine the relationship between the adsorbent and the adsorbate.68 Four standard isotherm models used in this study were, Langmuir, Freundlich, Temkin and Dubinin–Raduskevich (D–R) isotherm models. The non-linear isotherm equations used were:
 |
12 |
Freundlich:
| qe = KFCe1/n | 13 |
Temkin:
| qe = B ln(KTCe) | 14 |
D–R:
| qe = qm exp(−βε2) | 15 |
 |
16 |
where qe and Ce is the adsorption capacity (mg g−1) and dye concentration (mg L−1) at equilibrium, respectively, qm is the maximum adsorption capacity (mg g−1), KL is the Langmuir adsorption constant (L mg−1), KF is Freundlich adsorption constant, n is the heterogeneity factor, B is the Temkin constant that is controlled by the adjusted uptake temperature (J mol−1), KT is the binding constant of Temkin isotherm (L g−1), β is the adsorption energy constant (mol2 J−2), ε is the Polanyi potential (kJ mol−1), R is the universal gas constant (8.314 J mol−1 K−1) and T is the absolute temperature (K).
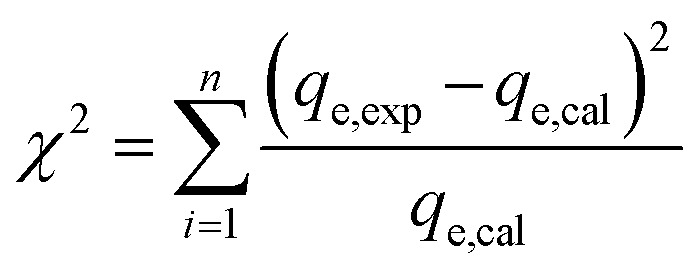
Furthermore, to validate the adsorption isotherm models, Chi-square (χ2)60 error parameter was evaluated in addition to R2. The error equation used was:
 |
17 |
where, “exp” and “calc” indicate the experimental and calculated values of the adsorption capacity for the each isotherm model, respectively.
The isotherm model constants and their fitting correlation coefficients (R2) were given in Table 4. The value of R2, and χ2 were used to determine the suitability of the model. The best suited model is the one which has the higher R2 and lower χ2 values. The non-linear plots of four isotherm models for CV and MB adsorption was given in Fig. S7.† The best suited model for CV removal was found to be Langmuir and Freundlich model, while for MB removal it was D–R and Freundlich model based on the high R2 value. The maximum monolayer adsorption capacity for CV and MB is 34.82 and 11.18 mg g−1, respectively. But, the error analysis for CV removal indicated that the lower error values were found in D–R and Freundlich model even though Langmuir model has higher R2 value. So, CV removal would have followed both Freundlich and Langmuir model i.e. both multilayer adsorption and monolayer chemical adsorption. Monolayer adsorption is the reversible chemical reaction in which adsorption and desorption are equal at equilibrium.69 According to Langmuir isotherm, no additional adsorption can take place at the binding site once the dye has occupied it, and dye molecules cannot interact with one another. Similar to our results, Bassyouni et al.27 also observed that adsorption of direct blue 71 dye on nanocellulose–chitosan beads had followed both Langmuir and Freundlich sorption at different dye concentrations. Whereas, Abdelaziz et al.29 had reported that acid red 8 dye adsorption by cellulose nanocrystal hydrogel is composed of homogenous sorption sites and had followed only Langmuir model with adsorption capacity of 11.24 mg g−1. Freundlich adsorption isotherm for MB removal indicated that the dyes could be removed from the external particle layers very efficiently by the adsorbent in a multilayer coverage where the functional groups were heterogeneous. Moreover, the Freundlich constant KF values were >1 for both the dyes signifying that the energy of adsorption decreases with an increase in the degree of occupancy of active adsorption sites.64 A further indication of adsorption isotherm deviation is provided by the Freundlich intensity parameter or surface heterogeneity, 1/n. The adsorption process is considered favourable when 1/n < 1 and unfavourable when 1/n > 1. The adsorption of CV and MB onto NCC–CH was favourable as indicated by 1/n values being less than unity. Also, this favourable adsorption increases the adsorption capacity of NCC–CH due to the formation of new active adsorption sites. Even though the adsorption is favourable, desorption of dyes from the adsorbent would have similar characteristics with an unfavourable isotherm.69
Adsorption isotherms and kinetics for CV and MB removal by NCC–CH.
| Adsorption isotherms | |||||||||||
|---|---|---|---|---|---|---|---|---|---|---|---|
| Langmuir | Freundlich | Temkin | D–R | ||||||||
| CV | MB | CV | MB | CV | MB | CV | MB | ||||
| q m (mg g−1) | 34.82 | 11.18 | 1/n | 0.71 | 0.22 | B | 6.41 | 1.73 | E (kJ mol−1) | 1.31 | 0.76 |
| K L (L mg−1) | 0.18 | 5.32 | K F (mg g−1) | 5.69 | 8.35 | K T (L mg−1) | 2.25 | 156.01 | q m (mg g−1) | 21.13 | 18.09 |
| β (mol2 J−2) | 0.29 | 0.86 | |||||||||
| R 2 | 0.99 | 0.66 | R 2 | 0.99 | 0.93 | R 2 | 0.95 | 0.81 | R 2 | 0.97 | 0.98 |
| χ 2 | 0.135 | 0.570 | χ 2 | 0.069 | 0.348 | χ 2 | 0.407 | 1.23 | χ 2 | 0.008 | 0.125 |
| Adsorption kinetics | |||||||||||
|---|---|---|---|---|---|---|---|---|---|---|---|
| Pseudo-first order | Pseudo-second order | Elovich | Intra particle diffusion | ||||||||
| CV | MB | CV | MB | CV | MB | CV | MB | ||||
| k 1 (min−1) | 0.11 | 0.11 | k 2 (g mg−1 min−1) | 0.002 | 0.031 | α (mg g−1 min−1) | 12.6 × 10⁴ | 3.62 | k id (mg g−1 h−0.5) | 0.166 | 0.156 |
| q e,cal (mg g−1) | 14.22 | 14.19 | q e,cal (mg g−1) | 14.69 | 14.52 | β (g mg−1) | 1.34 | 1.59 | C | 12.40 | 12.55 |
| q e,exp (mg g−1) | 14.87 | 14.72 | q e,exp (mg g−1) | 14.87 | 14.72 | ||||||
| R 2 | 0.72 | 0.75 | R 2 | 0.91 | 0.90 | R 2 | 0.82 | 0.83 | R 2 | 0.69 | 0.89 |
| χ 2 | 0.097 | 0.018 | χ 2 | 0.029 | 0.101 | χ 2 | 0.006 | 0.004 | χ 2 | 0.108 | 0.026 |
Temkin isotherm addresses the interactions between adsorbate molecules and makes the assumption that the enthalpy of dye molecules drops linearly as the layer is covered and that the adsorption process is characterized with a uniform distribution of binding energies. The constant B, which measures the heat of adsorption was found to be positive, indicating an exothermic reaction.70 The Temkin constant B values obtained for CV and MB removal were 6.41 and 1.73, respectively. Similar findings were recorded by Aysu et al.,71 in which removal of CV and MB by activated carbon was an exothermic process with positive B values of 171.8 and 154.9, respectively.
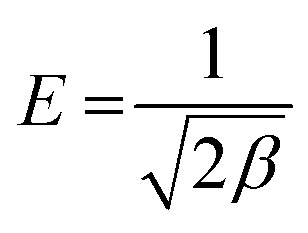
Experimental data was also evaluated using Dubinin–Raduskevich (D–R) isotherm model to confirm the nature of dyes adsorption onto NCC–CH. The high R2 value for CV (0.97) and MB (0.98) removal, indicated that the D–R isotherm is best suited to explain the adsorption of dyes onto NCC–CH. According to D–R isotherm, the mechanism of adsorption of dye molecules in mesopores of NCC–CH is based on pore volume filling.69 But, the nature and strength of adsorption process can be determined by calculating the free energy of adsorption (E) using the eqn (20).
 |
18 |
Usually, the sorption energy ranges from 1 to 8 kJ mol−1 for physical sorption, and from 9 to 16 kJ mol−1 for chemical sorption.72 The adsorption energy obtained in this study for adsorption of CV and MB were 1.31 and 0.76 kJ mol−1, respectively. The adsorption energy for both the dyes were below 1 kJ mol−1 confirming that the adsorption of dyes on to NCC–CH hydrogel bead was physical via weak van der Waals interactions. Similarly, Elsherif et al.73 conducted a study with olive leaves powder as adsorbent for CV dye and reported 0.707 kJ mol−1 indicating that physisorption is predominant process in adsorption.
3.5. Adsorption kinetics
As seen from the Fig. 8b, the removal of dye molecules was rapid at the initial stage and attained equilibrium after some time. CV removal increased rapidly up to 60 min and thereafter attained stationary phase after 80 min. However, MB removal attained stationary phase after 140 min (Fig. 8b). In a study conducted by Chawla et al.74 CV removal using chitosan beads had also attained equilibrium phase after 90 min. As the dye molecules occupied the active sites on NCC–CH, the adsorption slowed down, and equilibrium was eventually reached.58,75 The maximum adsorption capacity of CV and MB by NCC–CH was 14.87 and 14.72 mg g−1, respectively. In an attempt to understand the adsorption kinetics of CV and MB onto NCC–CH hydrogel beads, the pseudo-first order, pseudo-second order, Elovich, and intraparticle diffusion models were employed to explain our experimental results.76 The non-linear equations of used models were given as follows:
 |
19 |
 |
20 |
Elovich:
| qt = β ln(t) + β ln(α) | 21 |
 |
22 |
where, k1 (min−1) and k2 (g mg−1 min−1) are the pseudo-first order rate constant and pseudo-second order rate constant, respectively. The qe and qt refer to the amounts of dye adsorbed onto NCC–CH hydrogel beads (mg g−1) at equilibrium and at time t, respectively. α is the initial adsorption rate (mg g−1 min−1) and β is the desorption constant (g mg−1), kid is the intraparticle diffusion rate constant (g mg−1 min1/2) and C is a constant related to the extent of the boundary layer effect. Usually the best fit kinetic model was selected based on the predicted qe value and correlation coefficient (R2).
The pseudo-first order kinetics is the first equation used to describe the adsorption kinetics of a system based on the quantity of adsorbate adsorbed on to the adsorbent. Whereas, the pseudo-second order is considered as the rate limiting step controlling the adsorption process.77 The values of the kinetic parameters were given in Table 4. The non-linear plots of four models for CV and MB adsorption were given in Fig. S8,† respectively. Adsorption of both the dyes had invariably high R2 value for pseudo-second order kinetic model. It indicates that the effectiveness of the adsorption relies largely on the number of accessible active sites of the adsorbent NCC–CH and hence the experimental data is more accurately explained by pseudo-second order kinetic model. A crucial part in adsorption is also played by the valence forces created by sharing or trading of electrons between the adsorbent and adsorbate.78 The experimental equilibrium adsorption capacity (qe) of CV and MB was 14.87 and 14.72 mg g−1, respectively which was very close to the calculated qe in the pseudo-second order model. This emphasizes the superior fit of pseudo-second model for both the dyes, confirming that the overall rate is driven by the electrostatic attraction. Furthermore, according to this kinetic model, the adsorption rate does not depend on the concentration of the adsorbate but on sorption capacity.79 Hamza et al.80 published similar results, stating that CV adsorption on nanoporous carbon from waste tomato paste followed pseudo-second order kinetic adsorption with qe of 3.08 mg g−1 at 75 ppm. In assuming that solid surfaces are energetically heterogeneous, the Elovich equation was successfully applied to describe the second-order kinetics.81 The low χ2 value of Elovich model for CV (0.006) and MB (0.004) adsorption indicated that the chemisorption would be the rate limiting step and the adsorbent surface was heterogeneous. However, the initial adsorption rate was higher only for CV adsorption with the value of 12.6 × 10⁴ mg g−1 min−1 (ref. 83) than the MB (3.62 mg g−1 min−1). Similarly, Gala et al.82 reported that CV adsorption onto glutaraldehyde cross-linked chitosan beads had followed Elovich model and the adsorption rate decreased with time due to more generous coverage on the surface.
The rate controlling steps of an adsorption process mainly depends on surface or pore diffusion.76 So, to determine the rate controlling step, Weber–Morris intraparticle diffusion model was applied. The plots did not pass through the origin which evidently confirmed that the intraparticle diffusion alone is not the rate controlling step. Some other kinetic models or boundary layer control might also control the adsorption rate by operating simultaneously.72 However, the positive intercept value of 12.40 for CV and 12.55 for MB adsorption indicated that the adsorption process could mainly be controlled by both the external and internal diffusions.7 The MB adsorption had occurred at three stages as depicted in Fig. S8.† The first stage of sharp increase in adsorption is attributed to the movement of dye molecules on to the outer surface of NCC–CH hydrogel bead by diffusion through boundary layer. Followed by a decrease in the rate of adsorption at second stage and then the dye molecules would be diffused into the interior small pores of the adsorbent reaching equilibrium at third stage. Similar findings were reported by Melo et al.79. In their study, MB adsorption onto cellulose nanowhiskers-chitosan hydrogel bead had significant R2 values at the second stage of intraparticle diffusion reflecting non-consecutive diffusion into the wider micropores within the adsorbent. In light of the above results, the adsorption of CV on NCC–CH hydrogel beads can be fitted by the pseudo-second order, Langmuir, and Freundlich models, in which valence forces are involved through the exchange of electrons between the adsorbent and the adsorbate. Whereas, MB adsorption fitted by Freundlich and pseudo-second order models had followed multilayer chemical adsorption.
3.6. FTIR after adsorption of dyes
The significant changes in NCC–CH spectra exhibited after adsorption of dyes were depicted in Fig. 7. The characteristic peak shift from 3360 to 3283 and 3425 cm−1 after CV and MB adsorption, respectively could be due to the strong interactions such as electrostatic bonding of dye molecules with hydroxyl (–OH) group in NCC–CH beads. Besides, the peaks at 1654 cm−1 (amide I) and 1561 cm−1 (amide II) in NCC–CH spectra before adsorption were shifted to higher frequency in CV-ads spectra (1661 and 1585 cm−1) and to lower frequency in MB-ads spectra (1632 and 1509 cm−1). Also, these peaks were weakened after adsorption. The intensity of the peak 1410 cm−1 in NCC–CH spectra corresponding to –NH deformation in –NH2 was drastically reduced after dye adsorption indicating the formation of hydrogen bonds with the dye molecules. The peaks corresponding to C–H deformation and C O stretching of carboxylic acids at 877 and 1774 cm−1 were completely disappeared after adsorption of dyes.59 After the adsorption of CV and MB over NCC–CH beads, a few additional peaks appeared as a result of aromatic rings and the interaction of the dyes with the beads. This proved that chemical adsorption was also involved in the adsorption of CV and MB. These changes in the position of functional groups indicate that the CV and MB adsorption onto NCC–CH hydrogel bead was successful.
3.7. Mechanism of CV and MB adsorption onto NCC–CH hydrogel beads
From the FTIR results and taking into account the functional groups (–OH, –NH2, –OSO3−) present in the NCC–CH hydrogel beads and dyes previously, Fig. 9 summarizes the various mechanisms involved in adsorption of cationic dyes. Adsorption mechanisms include hydrogen bonding, n–π, and electrostatic interaction, dipolar bonds, and van der Waals forces. Two types of hydrogen bonding could have occurred. Dipole–dipole hydrogen bonding between the H-acceptor (nitrogen) in the dye molecules and the hydrogen present in –OH group of NCC–CH surface. Second H-bonding occurred with the –OH groups and the aromatic rings of CV and MB known as Yoshida H-bonding interactions.83 As seen from FTIR results (Fig. 5), the intensity of –OH groups (3360 cm−1) in NCC–CH spectra had reduced slightly after adsorption of CV and MB. This confirms that hydrogen bonding contributed little to the adsorption mechanism. Moreover, weak electrostatic attractions could also occurred between the negatively charged sites on the NCC–CH surface and the cationic dye molecules in the solution. When pH of the solution is above zero point charge, the oxygen-containing functional groups become ionized and decreased the solution pH. Thus increase in negative charge in the adsorbent surface readily binds the positively charged molecules. The electron donor–acceptor interactions (n–π) occurred between the oxygen as donor on the surface of NCC–CH hydrogel bead and aromatic rings of CV and MB dye molecules act as acceptors.84 The disappearance of C O and C–O peaks in the FTIR spectra after dye adsorption indicated that the n–π interactions could have played a substantial part in the adsorption process. Furthermore, CV had followed both Freundlich and Langmuir isotherms revealing the occurrence of electrostatic and n–π interactions and hydrogen bonding. Whereas, MB adsorption had fitted with Langmuir isotherm indicating that the electrostatic attraction (charge neutralization) was predominant.
3.8. Desorption and reusability of NCC–CH hydrogel beads
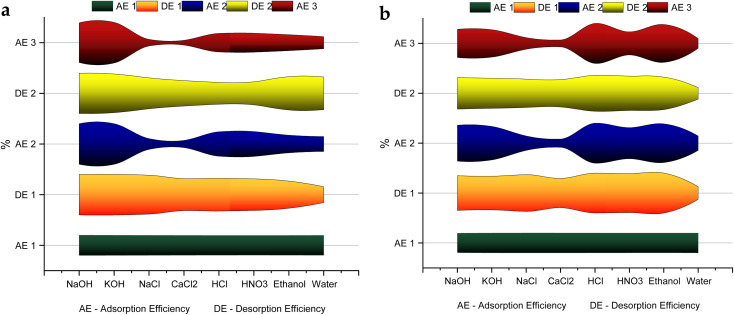
To improve the economic feasibility of the synthesized NCC–CH hydrogel bead, it was subjected to successive adsorption/desorption cycles. After desorption, the adsorbent can be reused thus minimizing the need for resources and cost incurred for the synthesis of new adsorbents.85 Desorption were carried out using different eluents and the results are depicted in Fig. 10. The use of 1 M NaOH and 1 M KOH had performed better in case of CV desorption, while for MB 0.1 M HCl and 50% ethanol performed better. Furthermore, adsorption efficiency of the other adsorbents were decreased below 50%. The adsorption efficiency of NCC–CH for MB was 87% and 83% at the third cycle when desorbed with 0.1 M HCl and 50% ethanol, respectively. Whereas, the CV adsorption at the third cycle was 92% in 1 M NaOH and 95% in KOH desorbed beads. After 8 cycles the CV adsorption capacity of NCC–CH hydrogel beads regenerated with 1 M KOH was found to be 60% (Fig. S9a†). The saturation of active sites on the surface of adsorbents might be the cause of the decline in adsorption/desorption efficiency. The electrostatic interaction between NCC–CH and the dye molecules become weaker in basic solutions and this could be the reason for better desorption while using 1 M NaOH and 1 M KOH than the other ones in CV dye adsorption.86 Desorption of MB adsorbed beads using 0.1 M HCl had 60% adsorption efficiency after 7 cycles. Similarly, Momina et al.87 reported that bentonite based adsorbent was used up to 7 cycles with 70% MB desorption using HCl solution. Also, the adsorption capacity of NCC–CH regenerated with 50% ethanol was reduced by 42% after 7th cycle (Fig. S9b†). Ethanol, which has both hydrophobic (–CH3) and hydrophilic (–OH) functional groups. The hydrophobic group in ethanol can strongly adsorb onto the aromatic structure of carbon,88 whereas the hydrophilic group interacts with surface functional groups (–OH, –COOH) of NCC–CH beads. This interaction keeps ethanol molecules firmly adsorbed on NCC–CH surface and partially inhibits the interaction between adsorbent and dye molecules. Here, desorption of dye molecules using ethanol actually involves two steps: first, the dye molecules are replaced by ethanol molecules, and then they get dissolved in the solution. Hence, the regeneration of NCC–CH were successful while using 1 M NaOH, 1 M KOH, 0.1 M HCl and 50% ethanol as eluents.
Fig. 10. Variation in adsorption and desorption efficiency of NCC–CH under different desorbents (a) CV and (b) MB.
4. Conclusion
The NCC–CH hydrogel beads were evaluated as adsorbent for removal of cationic dyes, CV and MB from aqueous solutions. The characterization techniques reveal that the nanocrystalline cellulose and chitosan were successfully blended to form hydrogel beads. The cationic dyes from the aqueous solution were effectively bound by the pores as well as active functional groups in the NCC–CH surface. The optimum CV removal obtained through RSM was 94.75% at contact time of 1 h, initial dye concentration of 60 mg L−1, adsorbent dosage of 0.5 g and solution pH of 9. The optimum conditions for MB removal (95.88%) were at alkaline pH 9, initial MB concentration of 15 mg L−1, and 0.13 g adsorbent dose at 1 h. The isotherm studies showed that the adsorption of MB dye had followed Freundlich isotherm with multilayer adsorption, while CV adsorption followed both Freundlich and Langmuir isotherm models. According to D–R isotherm studies the adsorption mechanism of CV and MB on NCC–CH hydrogel beads was confirmed to be predominantly physical. Kinetics study suggested that the adsorption of CV and MB onto NCC–CH is predominant by the pseudo-second order adsorption mechanism. This implied that hydrogen bonding, and electrostatic and n–π interactions were involved in the adsorption of cationic dyes on the synthesized NCC–CH hydrogel beads. In addition to that, adsorbent was easily regenerated with 1 M NaOH and 1 M KOH after CV adsorption and 0.1 M HCl and 50% ethanol after MB adsorption even up to eight cycles. Hence, the synthesized NCC–CH hydrogel beads can therefore be used to develop a reliable, effective and eco-friendly tertiary treatment technology for dyeing industry effluents.
Abbreviations
- CV
Crystal violet
- MB
Methylene blue
- NCC
Nanocrystalline cellulose
- NCC–CH
Nanocrystalline cellulose–chitosan hydrogel beads
- FTIR
Fourier transform infrared spectroscopy
- SEM
Scanning electron microscope
- TEM
Transmission electron microscope
- XRD
X-ray diffractogram
- TGA
Thermogravimetric analysis
- DTG
Derivative thermogravimetry
- BET
Brunauer–Emmett–Teller
- RSM
Response surface methodology
- SR
Swelling ratio
- ZP
Zeta potential
- pHzpc
Zero point charge
- D–R
Dubinin–Raduskevich
Author contributions
Chidamparam Poornachandhra: conceptualization, formal analysis, investigation, writing original draft. Rajamani M. Jayabalakrishnan: conceptualization, resources, validation, writing original draft. M. Prasanthrajan: resources. Govindaraj Balasubramanian: supervision. Arunachalam Lakshmanan: resources, supervision. S. Selvakumar: resources. Joseph Ezra John: investigation, editing.
Conflicts of interest
There are no conflicts to declare.
Supplementary Material
Acknowledgments
The authors thank Tamil Nadu Agricultural University, Coimbatore for providing all resources for performing the research.
Electronic supplementary information (ESI) available. See DOI: https://doi.org/10.1039/d2ra08283g
References
- Bharagava R. N., Saxena G. and Mulla S. I., in Bioremediation of industrial waste for environmental safety, Springer, 2020, pp. 1–18 [Google Scholar]
- Khan S. Malik A. Environ. Sci. Pollut. Res. 2018;25:4446–4458. doi: 10.1007/s11356-017-0783-7. [DOI] [PubMed] [Google Scholar]
- Benkhaya S. M'rabet S. El Harfi A. Inorg. Chem. Commun. 2020;115:107891. [Google Scholar]
- Shindhal T. Rakholiya P. Varjani S. Pandey A. Ngo H. H. Guo W. Ng H. Y. Taherzadeh M. J. Bioengineered. 2021;12:70–87. doi: 10.1080/21655979.2020.1863034. [DOI] [PMC free article] [PubMed] [Google Scholar]
- Jamee R. Siddique R. Eur. J. Microbiol. Immunol. 2019;9:114–118. doi: 10.1556/1886.2019.00018. [DOI] [PMC free article] [PubMed] [Google Scholar]
- Hachi M. Chergui A. Selatnia A. Cabana H. Environ. Processes. 2016;3:413–430. [Google Scholar]
- Ganea I. V. Nan A. Baciu C. Turcu R. Nanomaterials. 2021;11:1–15. doi: 10.3390/nano11030679. [DOI] [PMC free article] [PubMed] [Google Scholar]
- Nguyen T. A. H. Ngo H. H. Guo W. S. Zhang J. Liang S. Yue Q. Y. Li Q. Nguyen T. V. Bioresour. Technol. 2013;148:574–585. doi: 10.1016/j.biortech.2013.08.124. [DOI] [PubMed] [Google Scholar]
- El-Sayed G. O. Desalination. 2011;272:225–232. [Google Scholar]
- Xu X. kun Ouyang X. Yang L. Y. J. Mol. Liq. 2021;322:114523. [Google Scholar]
- Ben Slama H. Bouket A. C. Pourhassan Z. Alenezi F. N. Silini A. Cherif-Silini H. Oszako T. Luptakova L. Golińska P. Belbahri L. Appl. Sci. 2021;11:1–21. [Google Scholar]
- Ghosh I. Kar S. Chatterjee T. Bar N. Das S. K. Process Saf. Environ. Prot. 2021;149:345–361. [Google Scholar]
- Ilyas R. A. Sapuan S. M. Ishak M. R. Carbohydr. Polym. 2018;181:1038–1051. doi: 10.1016/j.carbpol.2017.11.045. [DOI] [PubMed] [Google Scholar]
- Rezanezhad S. Nazanezhad N. Asadpur G. Lignocellulose. 2013;2:282–291. [Google Scholar]
- Mohammed N. Grishkewich N. Berry R. M. Tam K. C. Cellulose. 2015;22:3725–3738. [Google Scholar]
- Karimifard S. Alavi Moghaddam M. R. Sci. Total Environ. 2018;640–641:772–797. doi: 10.1016/j.scitotenv.2018.05.355. [DOI] [PubMed] [Google Scholar]
- Mäkelä M. Energy Convers. Manage. 2017;151:630–640. [Google Scholar]
- Tavakolian M. Wiebe H. Sadeghi M. A. Van De Ven T. G. M. ACS Appl. Mater. Interfaces. 2020;12:5040–5049. doi: 10.1021/acsami.9b18679. [DOI] [PubMed] [Google Scholar]
- Allouss D. Essamlali Y. Amadine O. Chakir A. Zahouily M. RSC Adv. 2019;9:37858–37869. doi: 10.1039/c9ra06450h. [DOI] [PMC free article] [PubMed] [Google Scholar]
- Jiménez-Gómez C. P. Cecilia J. A. Molecules. 2020;25:3981. doi: 10.3390/molecules25173981. [DOI] [PMC free article] [PubMed] [Google Scholar]
- Tareq A. Z. Mater. Sci. Forum. 2020;1002:468–477. [Google Scholar]
- Wu J. Du X. Yin Z. Xu S. Xu S. Zhang Y. Carbohydr. Polym. 2019;211:49–56. doi: 10.1016/j.carbpol.2019.01.093. [DOI] [PubMed] [Google Scholar]
- Abraham E. Deepa B. Pothen L. A. Cintil J. Thomas S. John M. J. Anandjiwala R. Narine S. S. Carbohydr. Polym. 2013;92:1477–1483. doi: 10.1016/j.carbpol.2012.10.056. [DOI] [PubMed] [Google Scholar]
- Munim S. A. Saddique M. T. Raza Z. A. Majeed M. I. Polym. Bull. 2020;77:183–196. [Google Scholar]
- Brunauer S. Emmett P. H. Teller E. J. Am. Chem. Soc. 1938;60:309–319. [Google Scholar]
- ALSamman M. M. Sánchez J. Polymers. 2022;14:1498. doi: 10.3390/polym14081498. [DOI] [PMC free article] [PubMed] [Google Scholar]
- Bassyouni M. Zoromba M. S. Abdel-Aziz M. H. Mosly I. Polymers. 2022;14:1852. doi: 10.3390/polym14091852. [DOI] [PMC free article] [PubMed] [Google Scholar]
- Uçar S. Erdem M. Tay T. Karagöz S. Clean Technol. Environ. Policy. 2015;17:747–756. [Google Scholar]
- Abdelaziz R. M. El-Maghraby A. Sadik W. A. A. El-Demerdash A. G. M. Fadl E. A. Sci. Rep. 2022;12:1–17. doi: 10.1038/s41598-022-10087-1. [DOI] [PMC free article] [PubMed] [Google Scholar]
- Udoetok I. A. Wilson L. D. Headley J. V. ACS Appl. Mater. Interfaces. 2016;8:33197–33209. doi: 10.1021/acsami.6b11504. [DOI] [PubMed] [Google Scholar]
- Al-Ghamdi Y. O. Arabian J. Chem. 2022;15:104066. [Google Scholar]
- Allouss D. Essamlali Y. Amadine O. Chakir A. Zahouily M. RSC Adv. 2019;9:37858–37869. doi: 10.1039/c9ra06450h. [DOI] [PMC free article] [PubMed] [Google Scholar]
- Oumabady S. Selvaraj P. S. Kamaludeen S. P. B. Ettiyagounder P. Suganya K. Sangeetha Piriya R. RSC Adv. 2021;11:6535–6543. doi: 10.1039/d0ra10943f. [DOI] [PMC free article] [PubMed] [Google Scholar]
- Lata S. Singh P. K. Samadder S. R. Int. J. Environ. Sci. Technol. 2015;12:1461–1478. [Google Scholar]
- Tang T. K. Lee Y. Y. Phuah E. T. Tan C. P. Kanagaratnam S. Wang Y. Cheong L. Z. Jamalullail N. A. Yap K. L. Lee C. M. Tan J. S. Lai O. M. Food Res. 2021;5:201–213. [Google Scholar]
- Evstigneyev E. I. Shevchenko S. M. Wood Sci. Technol. 2019;53:7–47. [Google Scholar]
- Li G. Nandgaonkar A. G. Habibi Y. Krause W. E. Wei Q. Lucia L. A. RSC Adv. 2017;7:13678–13688. [Google Scholar]
- Kandil H. Ali H. J. Polym. Environ. 2022:1–22. [Google Scholar]
- Darban Z. Shahabuddin S. Gaur R. Ahmad I. Sridewi N. Gels. 2022;8:263. doi: 10.3390/gels8050263. [DOI] [PMC free article] [PubMed] [Google Scholar]
- Uddin M. N. Islam M. T. Das S. Int. J. Chem. Eng. 2014;2014:1–13. [Google Scholar]
- Sobhan A. Muthukumarappan K. Wei L. Zhou R. Tummala H. Anal. Methods. 2021;13:2612–2623. doi: 10.1039/d1ay00365h. [DOI] [PubMed] [Google Scholar]
- Jia Y. Wang X. Huo M. Zhai X. Li F. Zhong C. Nanomater. Nanotechnol. 2017;7:1–8. [Google Scholar]
- Hyeon U. K. Kim J. Weon J. Satoshi C. Cellulose. 2017;24:5517–5528. [Google Scholar]
- Thakur M. Sharma A. Ahlawat V. Bhattacharya M. Goswami S. Mater. Sci. Technol. 2020;3:328–334. [Google Scholar]
- Zheng D. Zhang Y. Guo Y. Yue J. Polymers. 2019;11:1130. doi: 10.3390/polym11071130. [DOI] [PMC free article] [PubMed] [Google Scholar]
- Ositadinma I. C. Tagbo N. J. Elijah O. C. Curr. J. Appl. Sci. Technol. 2019;36:1–11. [Google Scholar]
- Mukherjee A. Datta D. Halder G. Indian Chem. Eng. 2019;61:105–119. [Google Scholar]
- Karri R. R. Tanzifi M. Tavakkoli Yaraki M. Sahu J. N. J. Environ. Manage. 2018;223:517–529. doi: 10.1016/j.jenvman.2018.06.027. [DOI] [PubMed] [Google Scholar]
- Priya Sharma A. K. Kaith B. S. Tanwar V. Bhatia J. K. Sharma N. Bajaj S. Panchal S. Int. J. Biol. Macromol. 2019;129:214–226. doi: 10.1016/j.ijbiomac.2019.02.034. [DOI] [PubMed] [Google Scholar]
- Foroutan R. Peighambardoust S. J. Peighambardoust S. H. Pateiro M. Lorenzo J. M. Molecules. 2021;26:1–19. doi: 10.3390/molecules26082241. [DOI] [PMC free article] [PubMed] [Google Scholar]
- Boubaker H. Ben Arfi R. Mougin K. Vaulot C. Hajjar S. Kunneman P. Schrodj G. Ghorbal A. J. Cleaner Prod. 2021;307:127218. doi: 10.1016/j.jclepro.2021.127218. [DOI] [Google Scholar]
- Mao S. Bao R. Fang D. Yi J. J. Colloid Interface Sci. 2019;538:15–24. doi: 10.1016/j.jcis.2018.11.078. [DOI] [PubMed] [Google Scholar]
- Alshabanat M. Alsenani G. Almufarij R. J. Chem. 2013;2013:1–6. [Google Scholar]
- Onu C. E. Nwabanne J. T. Ohale P. E. Asadu C. O. S. Afr. J. Chem. Eng. 2021;36:24–42. [Google Scholar]
- Sodeifian G. Sajadian S. A. Saadati Ardestani N. J. Taiwan Inst. Chem. Eng. 2016;60:165–173. [Google Scholar]
- salah omer A. El Naeem G. A. Abd-Elhamid A. I. Farahat O. O. M. El-Bardan A. A. Soliman H. M. A. Nayl A. A. J. Mater. Res. Technol. 2022;19:3241–3254. [Google Scholar]
- Wang Y. Tiantian C. Xiaolin Z. Teza M. Front. Environ. Sci. 2021;9:631. [Google Scholar]
- Ali N. S. Jabbar N. M. Alardhi S. M. Majdi H. S. Albayati T. M. Heliyon. 2022;8:e10276. doi: 10.1016/j.heliyon.2022.e10276. [DOI] [PMC free article] [PubMed] [Google Scholar]
- Güzel F. Sayǧili H. Sayǧili G. A. Koyuncu F. J. Ind. Eng. Chem. 2014;20:3375–3386. [Google Scholar]
- Elganidi I. Elarbe B. Ridzuan N. Abdullah N. J. Pet. Explor. Prod. Technol. 2022;12:437–449. [Google Scholar]
- Pilkington J. L. Preston C. Gomes R. L. Ind. Crops Prod. 2014;58:15–24. [Google Scholar]
- Amibo T. A. Beyan S. M. Damite T. M. J. Chem. 2022;2022:1–15. [Google Scholar]
- Emmanuel Chinonye O. Christian Oluchukwu A. Chijioke Elijah O. J. Chin. Adv. Mater. Soc. 2018;6:605–619. [Google Scholar]
- Ukkund S. J. Puthiyillam P. Alshehri H. M. Goodarzi M. Taqui S. N. Anqi A. E. Safaei M. R. Ali M. A. Syed U. T. Mir R. A. Elfasakhany A. Eed E. M. Siddiqui M. I. H. Mokashi I. Soudagar M. E. M. Appl. Sci. 2021;11:8088. [Google Scholar]
- Rai A. Mohanty B. Bhargava R. Food Chem. 2016;192:647–659. doi: 10.1016/j.foodchem.2015.07.070. [DOI] [PubMed] [Google Scholar]
- Nizamuddin S. Mubarak N. M. Tiripathi M. Jayakumar N. S. Sahu J. N. Ganesan P. Fuel. 2016;163:88–97. [Google Scholar]
- Sirajudheen P. Karthikeyan P. Ramkumar K. Nisheetha P. Meenakshi S. J. Mol. Liq. 2021;327:114829. [Google Scholar]
- Bhowmik M. Kanmani M. Debnath A. Saha B. Powder Technol. 2019;354:496–504. [Google Scholar]
- Hu Q. Lan R. He L. Liu H. Pei X. J. Environ. Manage. 2023;329:117104. doi: 10.1016/j.jenvman.2022.117104. [DOI] [PubMed] [Google Scholar]
- Abu Bakar S. Jusoh N. Mohamed A. Muqoyyanah M. Othman M. H. D. Mamat M. H. Ahmad M. K. Mohamed M. A. Azlan M. N. Hashim N. Birowosuto M. D. Soga T. Environ. Sci. Pollut. Res. 2021;28:65171–65187. doi: 10.1007/s11356-021-14918-y. [DOI] [PubMed] [Google Scholar]
- Aysu T. Küçük M. M. Int. J. Environ. Sci. Technol. 2015;12:2273–2284. [Google Scholar]
- Pan M. Lin X. Xie J. Huang X. RSC Adv. 2017;7:4492–4500. [Google Scholar]
- Elsherif K. M. El-dali A. Alkarewi A. A. Mabrok A. Chem. Int. 2021;7:79–89. [Google Scholar]
- Chawla S. Uppal H. Kaur H. Austin Environ. Sci. 2022;7:1076–1082. [Google Scholar]
- Aichour A. Zaghouane-Boudiaf H. Appl. Water Sci. 2020;10:1–13. [Google Scholar]
- Al-Harby N. F. Albahly E. F. Mohamed N. A. Polymers. 2021;13:1–34. doi: 10.3390/polym13244446. [DOI] [PMC free article] [PubMed] [Google Scholar]
- Zhou Y. Fu S. Zhang L. Zhan H. Levit M. V. Carbohydr. Polym. 2014;101:75–82. doi: 10.1016/j.carbpol.2013.08.055. [DOI] [PubMed] [Google Scholar]
- Zaheer Z. AbuBaker Bawazir W. Al-Bukhari S. M. Basaleh A. S. Mater. Chem. Phys. 2019;232:109–120. [Google Scholar]
- Melo B. C. Paulino F. A. A. Cardoso V. A. Pereira A. G. B. Fajardo A. R. Rodrigues F. H. A. Carbohydr. Polym. 2018;181:358–367. doi: 10.1016/j.carbpol.2017.10.079. [DOI] [PubMed] [Google Scholar]
- Hamza W. Dammak N. Hadjltaief H. B. Eloussaief M. Benzina M. Ecotoxicol. Environ. Saf. 2018;163:365–371. doi: 10.1016/j.ecoenv.2018.07.021. [DOI] [PubMed] [Google Scholar]
- Mezenner N. Y. Bensmaili A. Chem. Eng. J. 2009;147:87–96. [Google Scholar]
- Galan J. Trilleras J. Zapata P. A. Arana V. A. Grande-Tovar C. D. Life. 2021;11:1–20. doi: 10.3390/life11020085. [DOI] [PMC free article] [PubMed] [Google Scholar]
- Tran H. N. You S. J. Nguyen T. V. Chao H. P. Chem. Eng. Commun. 2017;204:1020–1036. [Google Scholar]
- Kono H. Gels. 2015;1:94–116. doi: 10.3390/gels1010094. [DOI] [PMC free article] [PubMed] [Google Scholar]
- Vakili M. Zwain H. M. Mojiri A. Wang W. Gholami F. Gholami Z. Giwa A. S. Wang B. Cagnetta G. Salamatinia B. Water. 2020;12:2242–2256. [Google Scholar]
- Patel H. J. Saudi Chem. Soc. 2021;25:101302. [Google Scholar]
- Momina S. M. Suzylawati I. J. Water Process. Eng. 2020;34:101155. [Google Scholar]
- Xing X. Qu H. Shao R. Wang Q. Xie H. Water Sci. Technol. 2017;76:1243–1250. doi: 10.2166/wst.2017.268. [DOI] [PubMed] [Google Scholar]
Associated Data
This section collects any data citations, data availability statements, or supplementary materials included in this article.


